Meta-Analysis
. 2023 Jan 13:13:1090144.
doi: 10.3389/fendo.2022.1090144. eCollection 2022.

The clinical outcomes of imaging modalities for surgical management Cushing's disease - A systematic review and meta-analysis

Affiliations
Meta-Analysis

The clinical outcomes of imaging modalities for surgical management Cushing's disease - A systematic review and meta-analysis

Chan Hee Koh et al. Front Endocrinol (Lausanne). .

Abstract

Introduction: Cushing's disease presents major diagnostic and management challenges. Although numerous preoperative and intraoperative imaging modalities have been deployed, it is unclear whether these investigations have improved surgical outcomes. Our objective was to investigate whether advances in imaging improved outcomes for Cushing's disease.

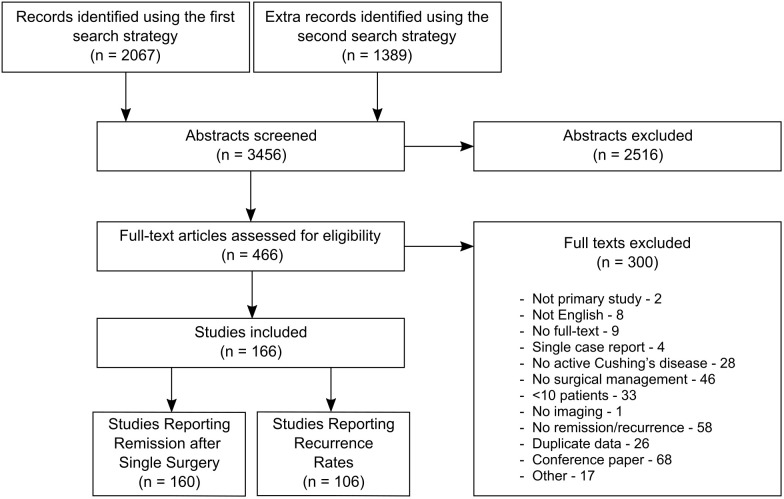
Methods: Searches of PubMed and EMBASE were conducted. Studies reporting on imaging modalities and clinical outcomes after surgical management of Cushing's disease were included. Multilevel multivariable meta-regressions identified predictors of outcomes, adjusting for confounders and heterogeneity prior to investigating the effects of imaging.

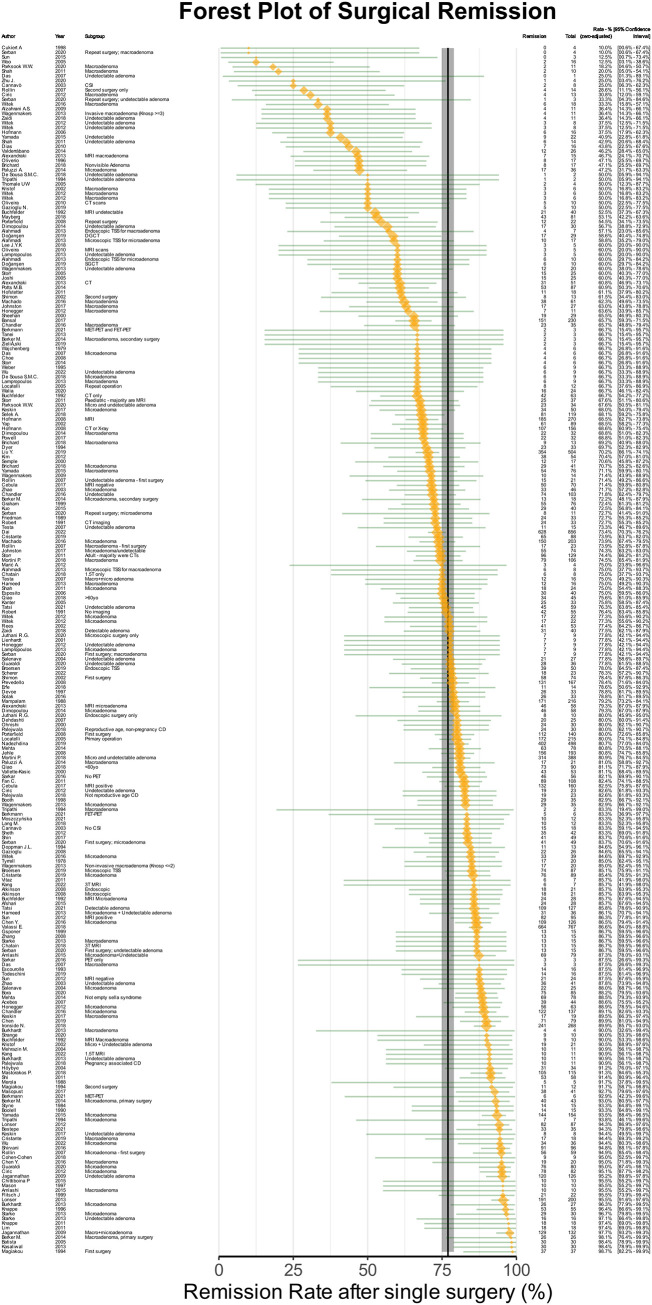
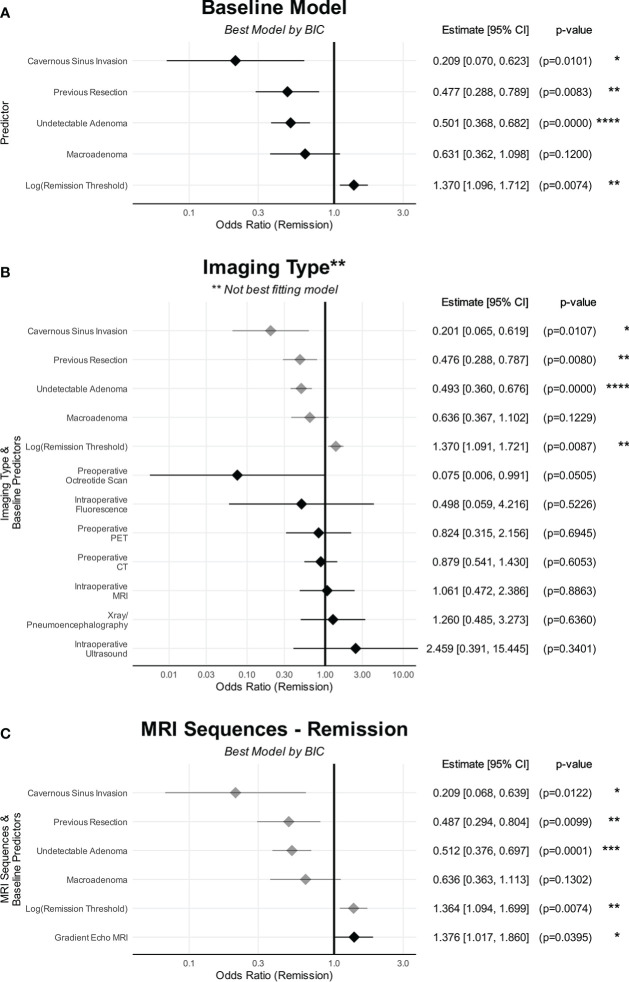
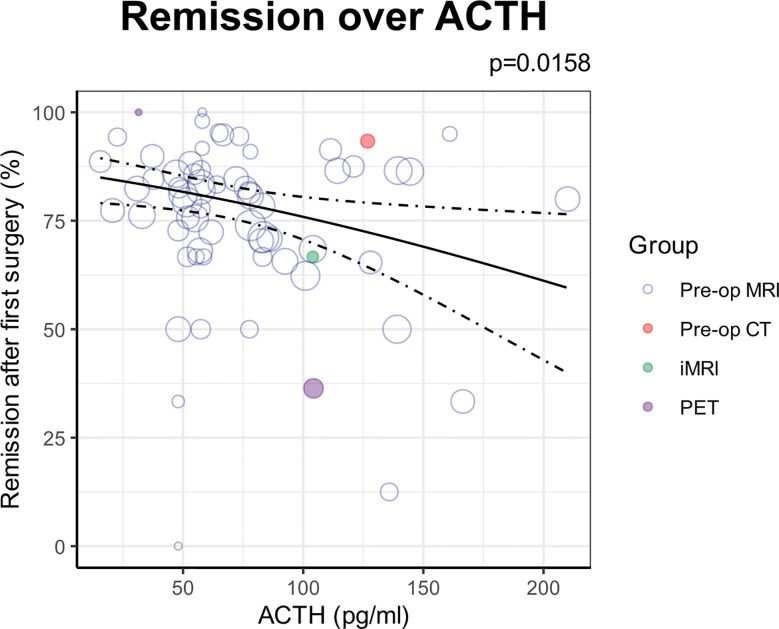
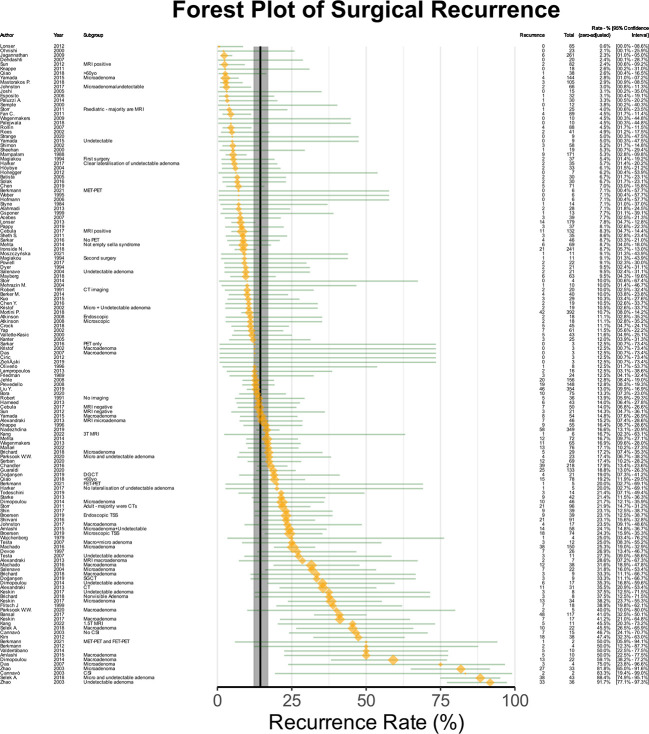
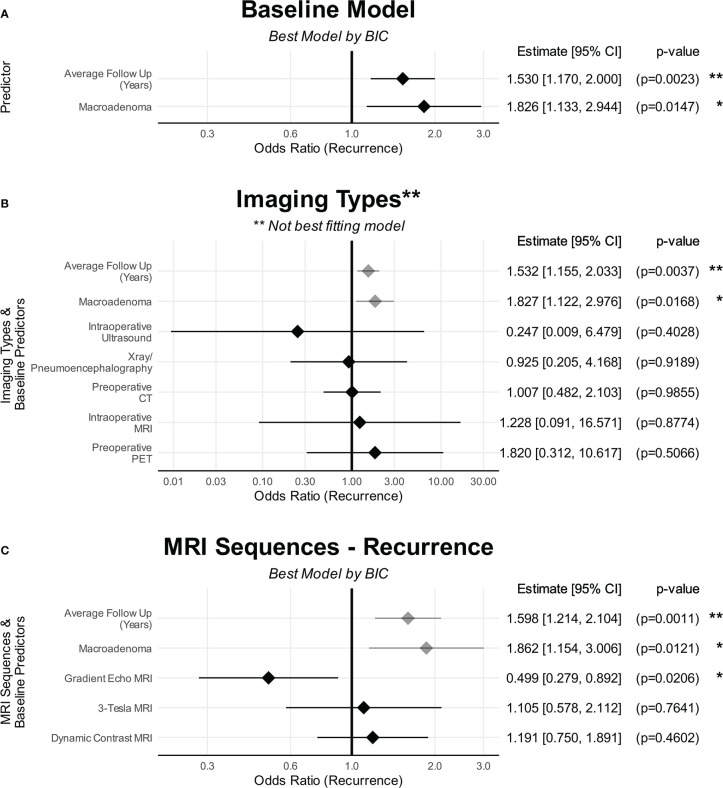
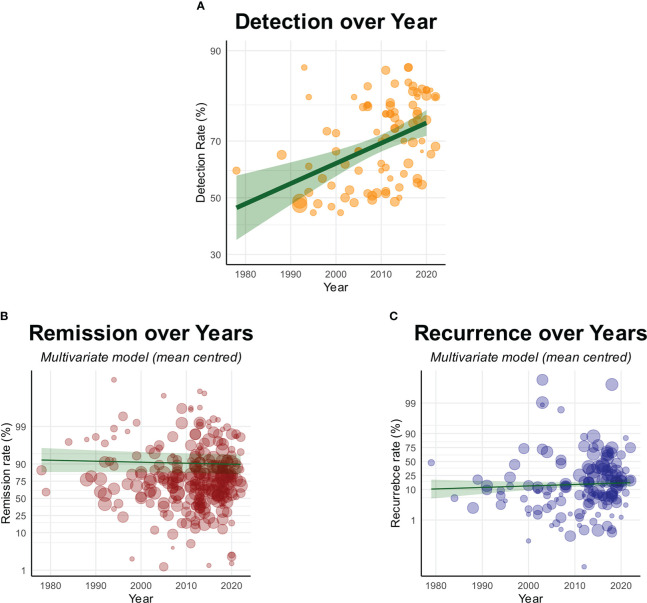
Results: 166 non-controlled single-arm studies were included, comprising 13181 patients over 44 years.The overall remission rate was 77.0% [CI: 74.9%-79.0%]. Cavernous sinus invasion (OR: 0.21 [CI: 0.07-0.66]; p=0.010), radiologically undetectable lesions (OR: 0.50 [CI: 0.37-0.69]; p<0.0001), previous surgery (OR=0.48 [CI: 0.28-0.81]; p=0.008), and lesions ≥10mm (OR: 0.63 [CI: 0.35-1.14]; p=0.12) were associated with lower remission. Less stringent thresholds for remission was associated with higher reported remission (OR: 1.37 [CI: 1.1-1.72]; p=0.007). After adjusting for this heterogeneity, no imaging modality showed significant differences in remission compared to standard preoperative MRI.The overall recurrence rate was 14.5% [CI: 12.1%-17.1%]. Lesion ≥10mm was associated with greater recurrence (OR: 1.83 [CI: 1.13-2.96]; p=0.015), as was greater duration of follow-up (OR: 1.53 (CI: 1.17-2.01); p=0.002). No imaging modality was associated with significant differences in recurrence.Despite significant improvements in detection rates over four decades, there were no significant changes in the reported remission or recurrence rates.

Conclusion: A lack of controlled comparative studies makes it difficult to draw definitive conclusions. Within this limitation, the results suggest that despite improvements in radiological detection rates of Cushing's disease over the last four decades, there were no changes in clinical outcomes. Advances in imaging alone may be insufficient to improve surgical outcomes.

Systematic review registration: https://www.crd.york.ac.uk/PROSPERO/, identifier CRD42020187751.

Keywords: Cushing’s disease; MRI; PET; advanced imaging; cushing; imaging; pituitary; transsphenoidal.


Conflict of interest statement

The authors declare that the research was conducted in the absence of any commercial or financial relationships that could be construed as a potential conflict of interest.

Figures

Figure 1
Figure 1
Study flow diagram.
Figure 2
Figure 2
Forest plot of remission after single surgery. The orange points denote sample level effect, with the size proportional to the weight. The green horizontal lines denote the 95% confidence interval for the sample. The solid vertical black line denotes the summary estimate for the univariable meta-analysis, and the vertical shaded area denotes the 95% confidence interval of the summary estimate.
Figure 3
Figure 3
The effects of predictors on remission. (A) Baseline characteristics. (B) Imaging types. (C) MRI sequences. (A) shows the baseline characteristics that were predictive of remission. (B) No imaging modality was predictive of remission compared to preoperative MRI. (C) Only GRE was found to be predictive of remission compared to standard MRI sequences/protocols whereas DMRI and Tesla strength were not. The point denotes the estimated effect size, and the line denotes the 95% confidence interval of that estimate. Baseline variables are in grey The point denotes the estimated effect size, and the line denotes the 95% confidence interval of that estimate. CI, confidence interval. *p < 0.05, **p < 0.01, ***p < 0.001, ****p < 0.0001.
Figure 4
Figure 4
ACTH as an additional predictor of remission found on univariable analysis. Each circle denotes the sample level effect, with the size proportional to the weight. The solid line denotes the regression line, and the dotted lines denote the 95% confidence interval of the line.
Figure 5
Figure 5
Forest plot of recurrence rates. The orange points denote sample level effect, with the size proportional to the weight. The green horizontal lines denote the 95% confidence interval for the sample. The solid vertical black line denotes the summary estimate for the univariable meta-analysis, and the vertical shaded area denotes the 95% confidence interval of the summary estimate.
Figure 6
Figure 6
The effects of predictors on recurrence. (A) Baseline characteristics. (B) Imaging types. (C) MRI sequences. (A) shows the baseline characteristics that were predictive of recurrence. (B) No imaging modality was predictive of recurrence compared to preoperative MRI. (C) Only GRE was found to be predictive of recurrence compared to standard MRI sequences/protocols whereas DMRI and Tesla strength were not. The point denotes the estimated effect size, and the line denotes the 95% confidence interval of that estimate. Baseline variables are in grey The point denotes the estimated effect size, and the line denotes the 95% confidence interval of that estimate. CI, confidence interval. *p < 0.05, **p < 0.01, ***p < 0.001, ****p < 0.0001.
Figure 7
Figure 7
Graphs showing (A) Significant improvement in detection rates over time, but with (B) no improvements in remission or (C) recurrence over time. Each circle denotes the sample level effect, with the size proportional to the weight. The solid line denotes the regression line, and the grey area denotes the 95% confidence interval of the line.

References

    1. Lonser RR, Nieman L, Oldfield EH. Cushing’s disease: pathobiology, diagnosis, and management. J Neurosurg (2017) 126(2):404–17. doi: 10.3171/2016.1.JNS152119 - DOI - PubMed
    1. Pivonello R, De Martino MC, De Leo M, Simeoli C, Colao A. Cushing’s disease: the burden of illness. Endocrine (2017) 56(1):10–8. doi: 10.1007/s12020-016-0984-8 - DOI - PubMed
    1. Pivonello R, De Leo M, Cozzolino A, Colao A. The treatment of cushing’s disease. Endocr Rev (2015) 36(4):385–486. doi: 10.1210/er.2013-1048 - DOI - PMC - PubMed
    1. Marcus HJ, Vercauteren T, Ourselin S, Dorward NL. Intraoperative ultrasound in patients undergoing transsphenoidal surgery for pituitary adenoma: Systematic review [corrected]. World Neurosurg (2017) 106:680–5. doi: 10.1016/j.wneu.2017.07.054 - DOI - PubMed
    1. Ghorbani M, Akbari H, Griessenauer CJ, Wipplinger C, Dastmalchi A, Malek M, et al. . Lateralization of inferior petrosal sinus sampling in cushing’s disease correlates with cavernous sinus venous drainage patterns, but not tumor lateralization. Heliyon (2020) 6(10):e05299. doi: 10.1016/j.heliyon.2020.e05299 - DOI - PMC - PubMed

Publication types

LinkOut - more resources