. 2022 Aug 4;1(4):pgac148.
doi: 10.1093/pnasnexus/pgac148. eCollection 2022 Sep.

Ancient dental calculus preserves signatures of biofilm succession and interindividual variation independent of dental pathology

Affiliations

Ancient dental calculus preserves signatures of biofilm succession and interindividual variation independent of dental pathology

Irina M Velsko et al. PNAS Nexus. .

Abstract

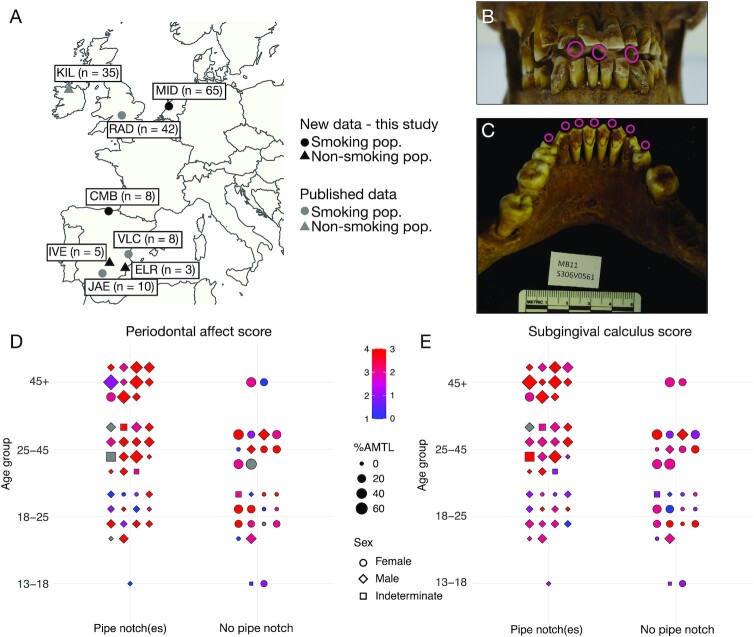
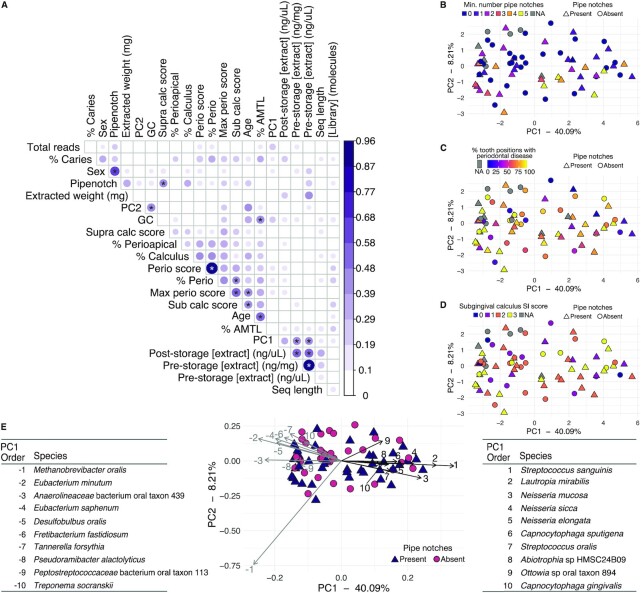
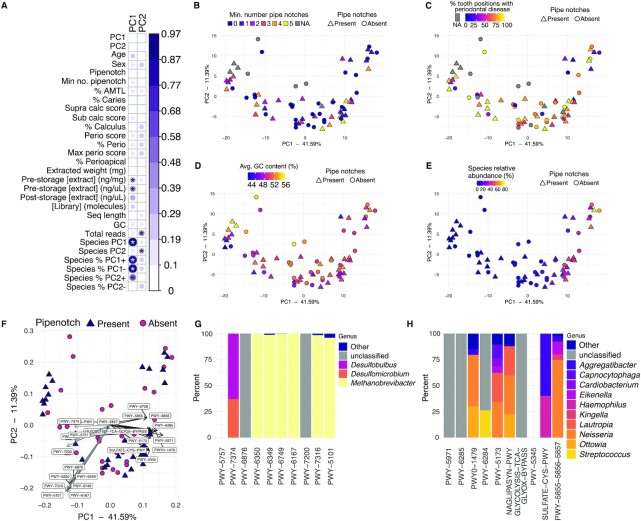
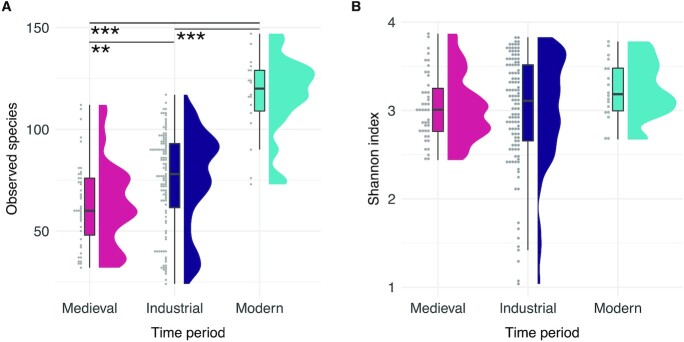
Dental calculus preserves oral microbes, enabling comparative studies of the oral microbiome and health through time. However, small sample sizes and limited dental health metadata have hindered health-focused investigations to date. Here, we investigate the relationship between tobacco pipe smoking and dental calculus microbiomes. Dental calculus from 75 individuals from the 19th century Middenbeemster skeletal collection (Netherlands) were analyzed by metagenomics. Demographic and dental health parameters were systematically recorded, including the presence/number of pipe notches. Comparative data sets from European populations before and after the introduction of tobacco were also analyzed. Calculus species profiles were compared with oral pathology to examine associations between microbiome community, smoking behavior, and oral health status. The Middenbeemster individuals exhibited relatively poor oral health, with a high prevalence of periodontal disease, caries, heavy calculus deposits, and antemortem tooth loss. No associations between pipe notches and dental pathologies, or microbial species composition, were found. Calculus samples before and after the introduction of tobacco showed highly similar species profiles. Observed interindividual microbiome differences were consistent with previously described variation in human populations from the Upper Paleolithic to the present. Dental calculus may not preserve microbial indicators of health and disease status as distinctly as dental plaque.

Keywords: ancient DNA; dental calculus; metagenomics; smoking; tobacco.


Figures

Fig. 1.
Fig. 1.
The Middenbeemster collection. (A) Map of sites included in the study. (B) Male individual from Middenbeemster with three prominent pipe notches in the anterior dentition indicated by hollow pink dots. (C) Mandible of a male individual S306V0561 with at least seven pipe notches on the anterior dentition, indicated by hollow pink dots. (D) and (E) Dental pathology of Middenbeemster individuals in relation to age, sex, antemortem tooth loss (AMTL), and presence of pipe notches, points colored by (D) periodontal affect score (1 to 4), or (E) subgingival calculus score (0 to 3). Gray indicates no data. Sample sites: CMB—Convento de los Mercedarios de Burtzeña; ELR—El Raval; IVE—Iglesia de la Virgen de la Estrella; JAE—Jaen; KIL—Kilteasheen; MID—Middenbeemster; RAD—Radcliffe; and VLC—Valencia. Photo credit: Sarah A. Inskip.
Fig. 2.
Fig. 2.
Microbial community diversity and correlations with oral pathology and laboratory work metadata. (A) CC for MID samples between metadata categories and principal components loadings. Significance tests were performed with a Pearson correlation test. The size and color of the dots corresponds to the CC value, which does not determine the direction of the correlation (positive or negative. Hence, all CC values are positive). Correlations ≥ 0.4 have significance indicated with stars. * P ≤ 0.001. (B)–(E) PCA based on species composition of MID and CMB samples colored by (B) Minimum number of pipe notches. (C) Percent of tooth positions with periodontal disease. (D) Subgingival calculus SI score. Samples from CMB are colored gray in (B)–(D) because due to the fragmented nature of the skeletons, the same metadata could not be collected (see Figure S1). (E) PCA based on species composition of MID and CMB samples colored by pipe notch presence, including a bi-plot indicating the loadings of 10 species with strongest positive and negative PC1 loadings, with the species indicated by number corresponding to the strength of loading (1/−1 is strongest, 10/−10 is weakest). The species are listed in tables to the left and right of the plot, ordered by decreasing strength of the loading. Metadata shown in (A): extracted weight (mg)—weight of calculus used in extraction; PC2–PC2 loadings; GC—library average GC content; % caries—% of teeth with caries; Sex—estimated biological sex; Pipenotch—pipe notch present; Seq length—library average sequence length; [Library] (molecules)—total DNA molecules in the library (x 106); Supra calc score—subragingival calculus SI score; % perioapical—% of teeth with perioapical lesions; % calculus—% of teeth with calculus; Perio score—average periodontitis score; % perio—% of teeth with periodontal disease; % AMTL—% of teeth lost ante-mortem; Max perio score—maximum periodontitis score; Sub calc score—subgingival calculus SI score; poststorage [extract] (ng/uL)—extract DNA concentration after storage; prestorage [extract] (ng/mg)—extract DNA concentration directly after extraction; prestorage [extract] (ng/uL)—extract DNA concentration directly after extraction; total reads—total reads in the library after quality-trimming and merging; and PC1–PC1 loadings.
Fig. 3.
Fig. 3.
Metabolic pathway analysis and correlations. (A) CC for MID and CMB samples between metadata categories and principal component loadings for a PCA based on pathway abundance. Significance tests were performed with a Pearson correlation test. The size and color of the dots corresponds to the CC value, which does not determine the direction of the correlation (positive or negative. Hence, all CC values are positive). Correlations ≥ 0.4 have significance indicated with stars. * P ≤ 0.001. (B)–(E) PCA plot based on pathway abundance in MID and CMB samples colored by (B) minimum number of pipe notches, (C) percent of teeth with periodontal disease, (D) average GC content (%), and (E) relative abundance of the 10 species with strongest PC1 positive loadings from the species PCA in Figure 2(E). In (C) samples from CMB are colored gray because due to the fragmented nature of the skeletons, the same metadata could not be collected (see Figure S1). (F) PCA biplot showing the 20 pathways with strongest loadings in PC1 (10 highest positive loadings and 10 highest negative loadings). (G) and (H) show the % of each pathway contributed by species in the indicated genera. (G) A total of 10 pathways with strongest positive PC1 loadings. (H) A total of 10 pathways with strongest negative PC1 loadings. PWY-5855, PWY-5856, and PWY-5857 all have the same PC1 loading, and are contributed by the same proportions of the same species. All genera for which the total contribution was < 5% are grouped together as Other. The empty places for PWY-5757 in (D) and PWY-5345 in (G) indicate that HUMAnN3 was not able to attribute these pathways to specific species. Metadata shown in (A) PC1–PC1 loadings; PC2–PC2 loadings; age—estimated age at death; sex—estimated biological sex; pipenotch—one or more pipe notches present; min no. pipenotch—minimum number of pipe notches; % AMTL—% of teeth lost ante-mortem; % caries—% of teeth with caries; supra calc score—subragingival calculus SI score; sub calc score—subgingival calculus SI score; % calculus—% of teeth with calculus; perio score—average periodontitis score; % perio—% of teeth with periodontal disease; max perio score—maximum periodontitis score; % perioapical—% of teeth with perioapical lesions; extracted weight (mg)—weight of calculus used in extraction; prestorage [extract] (ng/mg)—extract DNA concentration directly after extraction; prestorage [extract] (ng/uL)—extract DNA concentration directly after extraction; poststorage [extract] (ng/uL)—extract DNA concentration after storage; [Library] (molecules)—total DNA molecules in the library (x 106); seq length—library average sequence length; GC—library average GC content; total reads—total reads in the library after quality-trimming and merging; species PC1–sample loading in PC1 from the PCA based on the MetaPhlAn3 species table; species PC2–sample loading PC2 from the PCA based on the MetaPhlAn3 species table; species % PC1+—% of 10 species with strongest PC1 + loadings in the species-based PCA out of total species; species % PC1—% of 10 species with strongest PC1-loadings in the species-based PCA out of total species; species % PC2+—% of 10 species with strongest PC2 + loadings in the species-based PCA out of total species; and species % PC2—% of 10 species with strongest PC1-loadings in the species-based PCA out of total species.
Fig. 4.
Fig. 4.
Within-sample species diversity. (A) Raincloud plots showing the observed species in each sample, grouped by time period. (B) Raincloud plots showing the Shannon index in each sample, grouped by time period. *** P < 0.001 and ** P < 0.01.
Fig. 5.
Fig. 5.
Community structure is shaped by species aerotolerance and sample GC content rather than time period. (A) PCA of species profile colored by time period. (B) CC analysis correlations between metadata categories principal component loadings for all libraries. Significance tests were performed with a Pearson correlation test. The size and color of the dots corresponds to the CC value, which does not determine the direction of the correlation (positive or negative. Hence, all CC values are positive). The tested metadata were selected because the information was available for the majority of libraries. Only correlations ≥ 0.4 have significance indicated with stars, * P ≤ 0.001. (C) PCA of species profile colored by relative abundance of the 10 species with strongest negative loadings in PC1, all of which are aerobic or facultative species found early in dental biofilm development (Table S2). (D) PCA of species profile colored by average GC content of the sample. (E) Average GC content of the 10 species with strongest PC1 negative (NEG) and positive (POS) loadings, indicating that species characterizing the samples with higher average GC content have higher average GC content than the species characterizing the samples with lower GC content. N.S.—nonsignificant (P > 0.05 by Wilcox test). Site—site of the samples; PC2–PC2 loadings; GC—library average GC content; PC1–PC1 loadings; Seq length—library average sequence length; total reads—total reads in the library after quality-trimming and merging; and time period—time period of the samples.

References

    1. Warinner C, et al. 2014. Pathogens and host immunity in the ancient human oral cavity. Nat Genet. 46:336–344. - PMC - PubMed
    1. Adler CJ, et al. 2013. Sequencing ancient calcified dental plaque shows changes in oral microbiota with dietary shifts of the Neolithic and Industrial revolutions. Nat Genet. 45:450–455e1. - PMC - PubMed
    1. Velsko IM, et al. 2017. The dental calculus metabolome in modern and historic samples. Metabolomics. 13:134. - PMC - PubMed
    1. Velsko IM, et al. 2019. Microbial differences between dental plaque and historic dental calculus are related to oral biofilm maturation stage. Microbiome. 7:102. - PMC - PubMed
    1. Hardy K, et al. 2016. Dental calculus reveals potential respiratory irritants and ingestion of essential plant-based nutrients at Lower Palaeolithic Qesem Cave Israel. Quat Int. 398:129–135.