Do prokinetic agents provide symptom relief through acceleration of gastric emptying? An update and revision of the existing evidence
- PMID: 36714973
- PMCID: PMC10039797
- DOI: 10.1002/ueg2.12362
Do prokinetic agents provide symptom relief through acceleration of gastric emptying? An update and revision of the existing evidence
Abstract
Background: Gastroparesis and functional dyspepsia are disorders characterized by upper gastrointestinal symptoms and multifaceted etiologies. One of the main therapeutic approaches is accelerating gastric emptying (GE) by means of prokinetic agents. Their efficacy has been demonstrated, although the association between symptom improvement and acceleration of emptying is less clear. Meta-analyses have found contradictory results. Differences in applied methodology and included trials might drive these contradictions.
Objective: To provide a transparent meta-analysis update to elucidate the association between symptom improvement and acceleration of GE due to gastroprokinetic agents available for long-term use in patients with gastroparesis.
Design: Two approaches from earlier meta-analyses were executed and compared. One analyzed the relative changes on active treatment versus baseline, the other compared the change from baseline on active treatment versus the change from baseline on placebo. Papers that reported sufficient numerical data for both analyses were selected. Both analyses included the same trials.
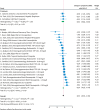
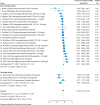
Results: Overall, both approaches yield the same positive direction of association between symptom improvement and acceleration of emptying (0.291 (-0.391, 0.972), p = 0.4 and 0.453 (0.123, 0.782), p = 0.007 for the active-only and placebo-controlled analysis respectively). The association between symptom improvement and GE acceleration for studies using optimal GE tests was either 0.028 (p > 0.9) or 0.463 (p = 0.007), and for sub-optimal GE tests was either 0.370 (p = 0.4) or 0.052 (p > 0.9) depending on the used meta-analysis methodology.
Conclusions: The applied methodology for GE testing, and the meta-analysis substantially impacts the conclusion. When considering the clinically relevant outcome of improvement from baseline, symptoms and emptying improve with prokinetics, but no correlation is found between both aspects. When the change over placebo is considered, limiting the analysis to scientifically more rigorous study approaches, changes in emptying rate and symptom improvement are positively associated.
Keywords: botulinum toxin; buspirone; cisapride; domperidone; erythromycin; gastric emptying; gastroparesis; ghrelin; levosulpiride; metoclopramide; prokinetic.
© 2023 The Authors. United European Gastroenterology Journal published by Wiley Periodicals LLC on behalf of United European Gastroenterology.
Conflict of interest statement
Jan Tack has given Scientific advice to Adare, AlfaWassermann, Arena, Bayer, Christian Hansen, Clasado, Danone, Devintec, Falk, FitForMe, Grünenthal, Ironwood, Janssen, Kiowa Kirin, Menarini, Mylan, Neurogastrx, Neutec, Novartis, Nutricia, Reckitt Benckiser, Ricordati, Shionogi, Takeda, Truvion, Tsumura, Zealand and Zeria pharmaceuticals, has received research support from Biohit, Shire, Sofar and Takeda, and has served on the Speaker bureau for Abbott, Allergan, AstraZeneca, FitForMe, Janssen, Kyowa Kirin, Mayoly, Menarini, Mylan, Novartis, Schwabe Parmaceuticals, Takeda, Wellspect and Zeria.
Figures


Comment in
-
Gastric emptying rate and relevance for symptoms.United European Gastroenterol J. 2023 Apr;11(3):269-270. doi: 10.1002/ueg2.12379. Epub 2023 Mar 14. United European Gastroenterol J. 2023. PMID: 36918964 Free PMC article. No abstract available.
References
Publication types
MeSH terms
Substances
LinkOut - more resources
Full Text Sources
Medical

