. 2023 Jan 30:12:e80317.
doi: 10.7554/eLife.80317.

An atrial fibrillation-associated regulatory region modulates cardiac Tbx5 levels and arrhythmia susceptibility

Affiliations

An atrial fibrillation-associated regulatory region modulates cardiac Tbx5 levels and arrhythmia susceptibility

Fernanda M Bosada et al. Elife. .

Abstract

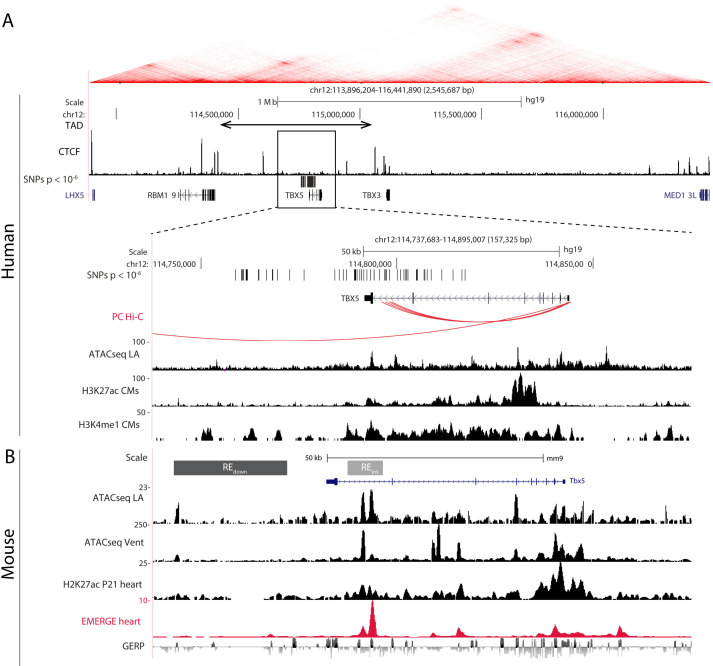
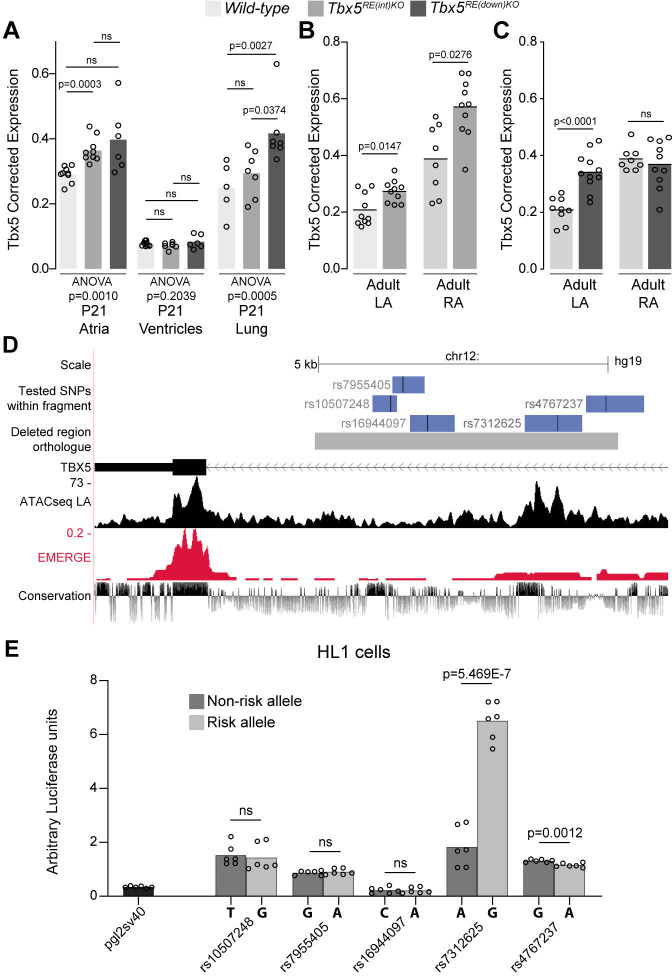
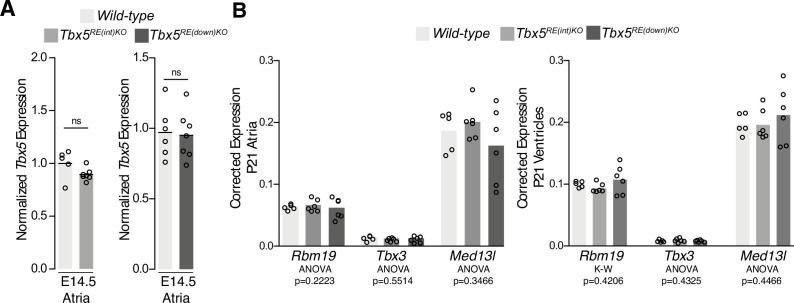
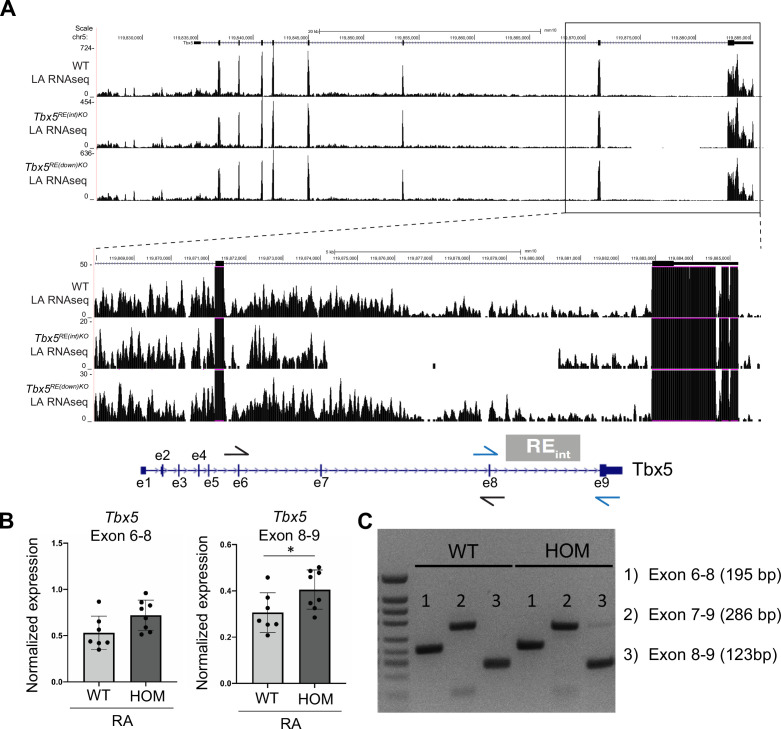
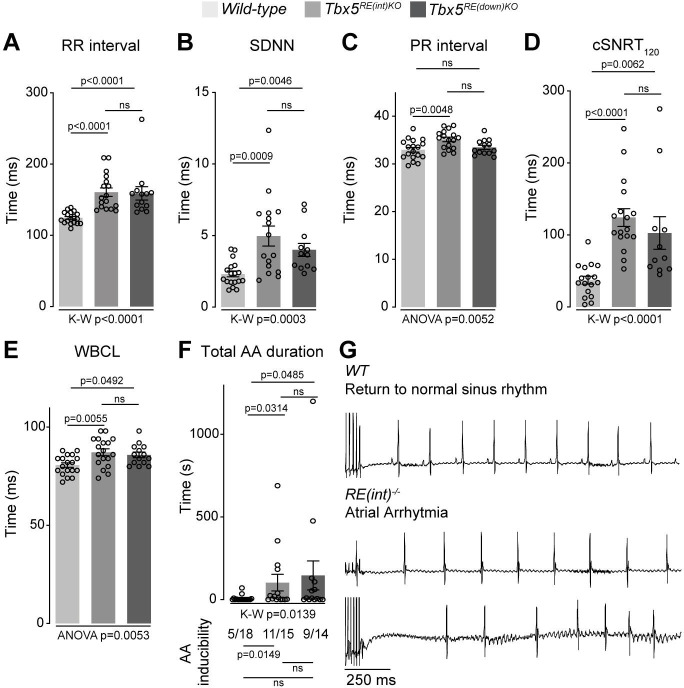
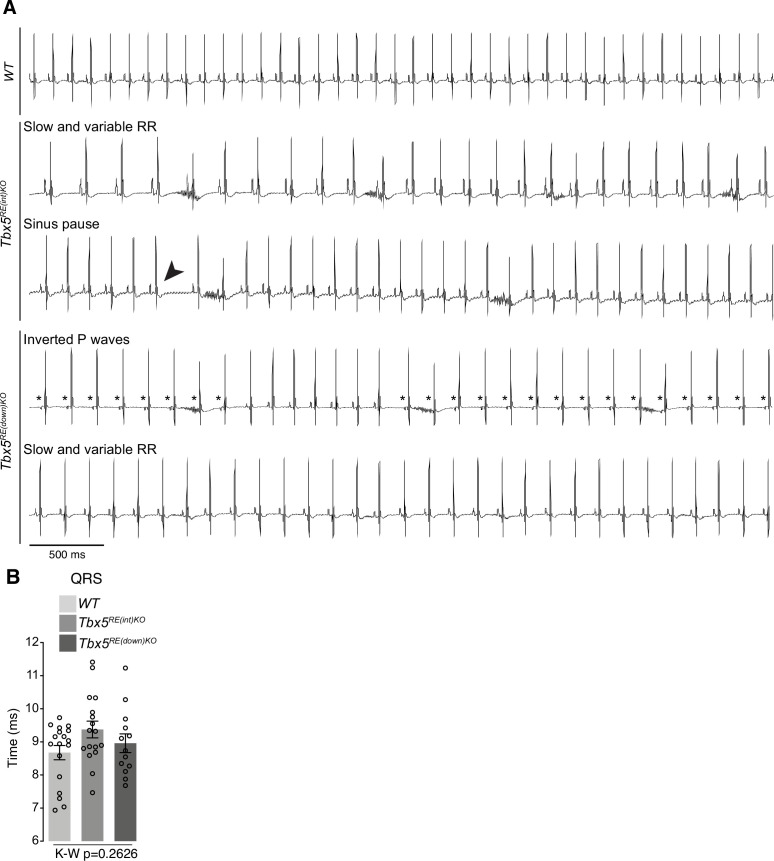
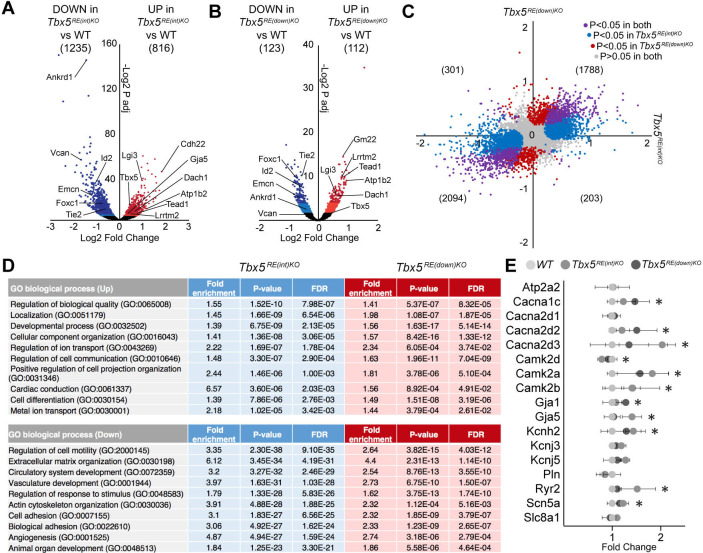
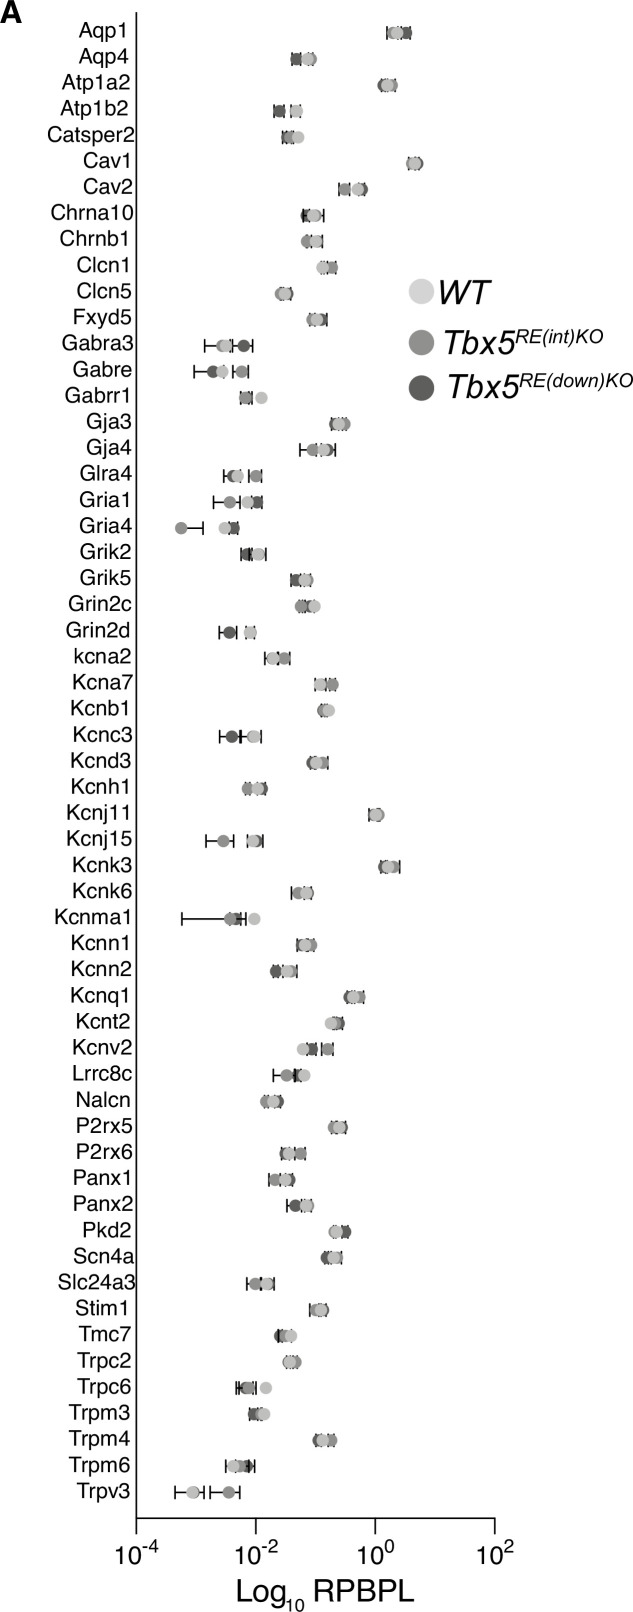
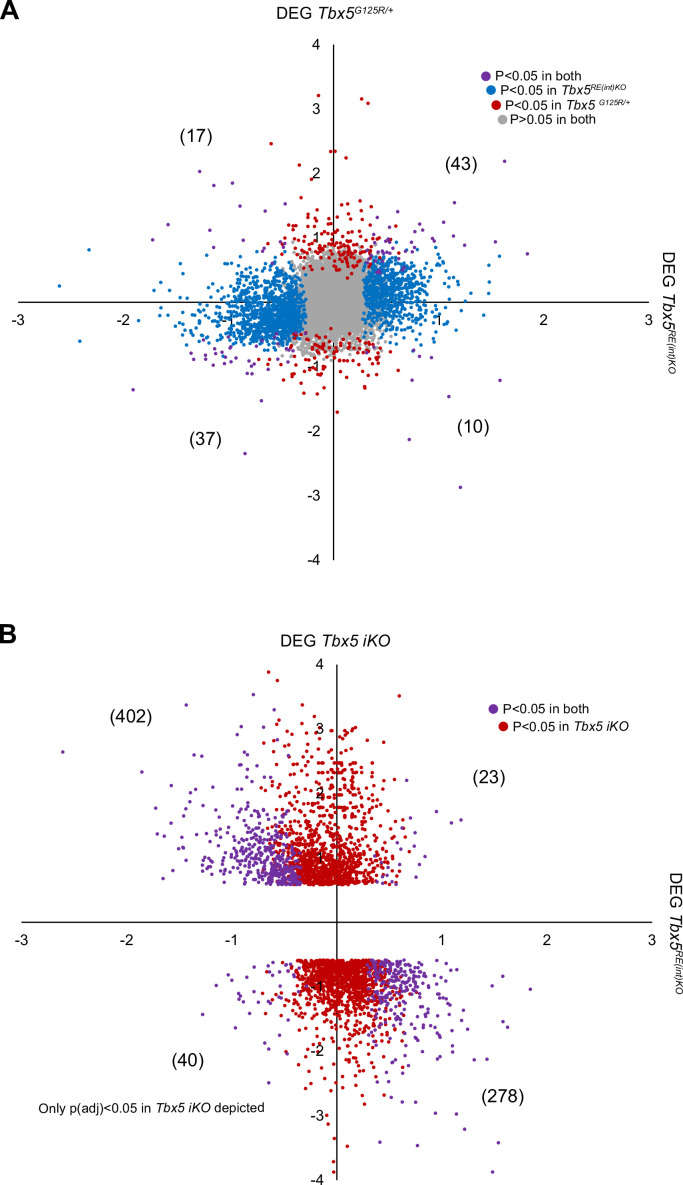
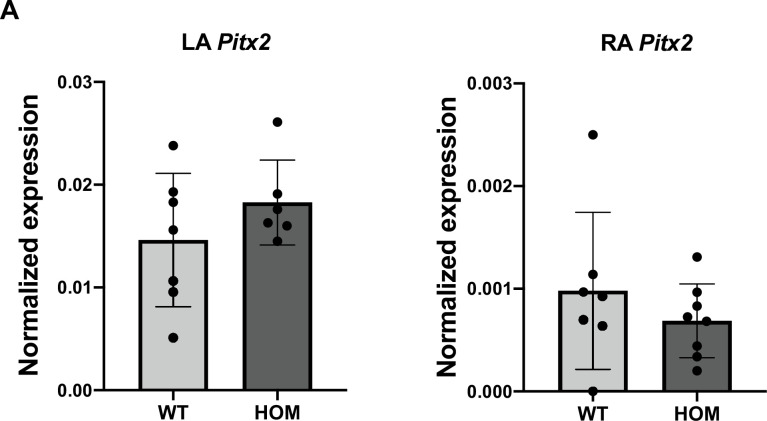
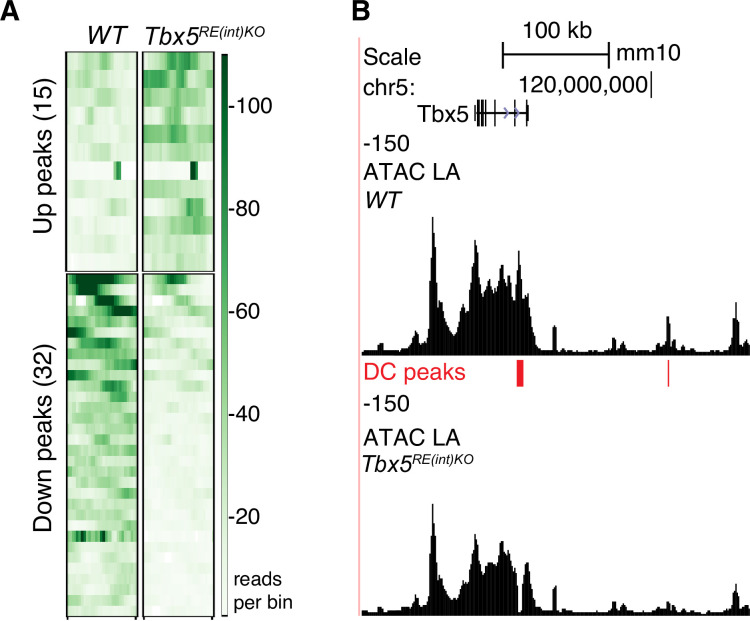
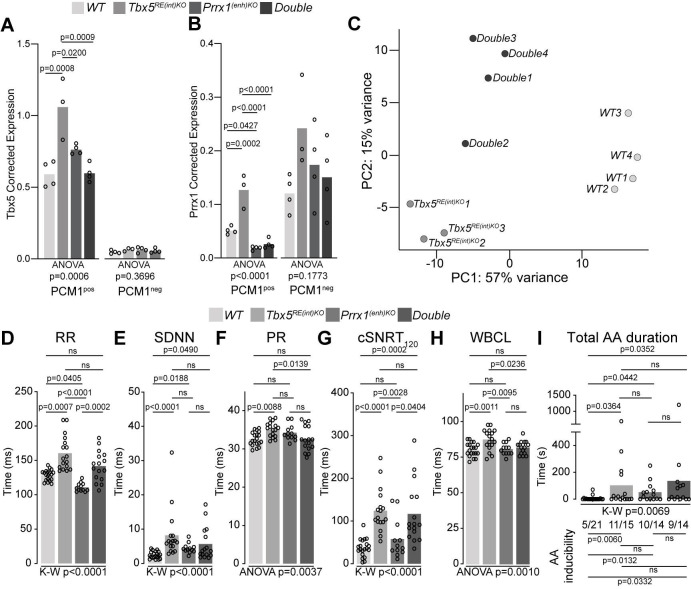
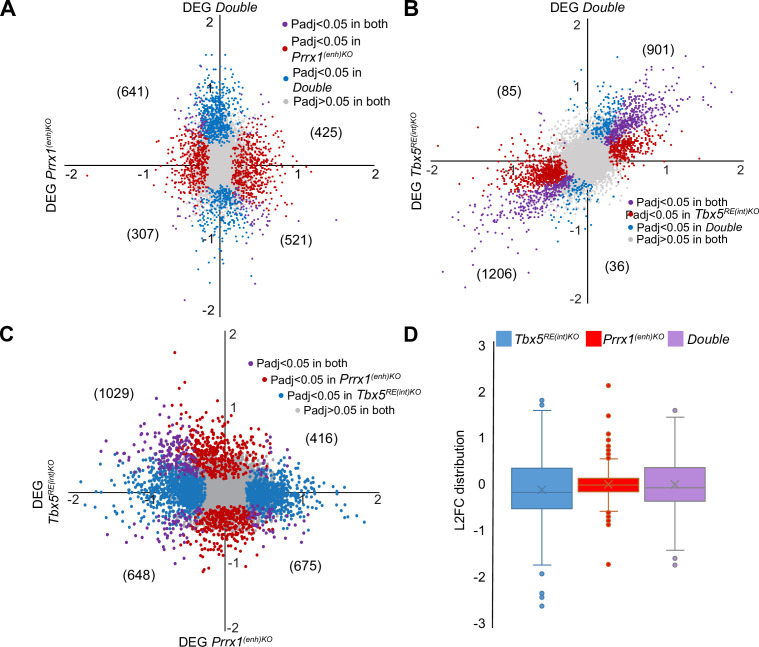
Heart development and rhythm control are highly Tbx5 dosage-sensitive. TBX5 haploinsufficiency causes congenital conduction disorders, whereas increased expression levels of TBX5 in human heart samples has been associated with atrial fibrillation (AF). We deleted the conserved mouse orthologues of two independent AF-associated genomic regions in the Tbx5 locus, one intronic (RE(int)) and one downstream (RE(down)) of Tbx5. In both lines, we observed a modest (30%) increase of Tbx5 in the postnatal atria. To gain insight into the effects of slight dosage increase in vivo, we investigated the atrial transcriptional, epigenetic and electrophysiological properties of both lines. Increased atrial Tbx5 expression was associated with induction of genes involved in development, ion transport and conduction, with increased susceptibility to atrial arrhythmias, and increased action potential duration of atrial cardiomyocytes. We identified an AF-associated variant in the human RE(int) that increases its transcriptional activity. Expression of the AF-associated transcription factor Prrx1 was induced in Tbx5RE(int)KO cardiomyocytes. We found that some of the transcriptional and functional changes in the atria caused by increased Tbx5 expression were normalized when reducing cardiac Prrx1 expression in Tbx5RE(int)KO mice, indicating an interaction between these two AF genes. We conclude that modest increases in expression of dose-dependent transcription factors, caused by common regulatory variants, significantly impact on the cardiac gene regulatory network and disease susceptibility.

Keywords: arrhythmias; atrial fibrillation; chromosomes; epigenetics; gene expression; genetic variation; genetically altered; genetics; genomics; mouse; regulation; transgenic models.


Conflict of interest statement

FB, Kv, AG, MR, JU, AV, BB, VC No competing interests declared

Figures

Figure 1.
Figure 1.. AF-associated noncoding variants are found in the TBX5 locus.
(A) Hi-C heatmap from human lymphoblastoid line GM12878 shows AF-associated variants are found in the regulatory domain of TBX5. Zoom-in of the AF-associated region overlaid with promoter capture Hi-C (red arcs), regions of open chromatin in whole left atria (ATACseq LA), H3K27ac and H3K4me1 ChIPseq signatures in cardiomyocytes. (B) Mouse orthologue of the human region including ATACseq from left atrial and ventricular CMs, H3K27ac ChIPseq from whole juvenile hearts, EMERGE, and conservation tracks. CRISPR/Cas9-generated deletions in light gray (REint), and dark gray (REdown).
Figure 1—figure supplement 1.
Figure 1—figure supplement 1.. AF-associated variants near TBX5 are grouped into distinct haplotypes.
Linkage disequilibrium (LD) matrix plot of SNPs located at the TBX5 locus associated with AF. The SNPs found in the last intron and downstream of the gene are clustered into two distinct haplotypes based on minimum linkage disequilibrium r2 of 0.1. The plot was generated using the LD matrix tool al ldlink.nci.nih.gov. Scale bar depicted above and below gene.
Figure 2.
Figure 2.. Deletion of AF-associated regions results in increased Tbx5 in adult atrial tissue.
(A) Tbx5 expression in atria, ventricles, and lungs from P21 control, Tbx5RE(int)KO, and Tbx5RE(down)KO mice determined by RT-qPCR. (B–C) Tbx5 expression levels in adult control and Tbx5RE(int)KO (B) or Tbx5RE(down)KO (C) left and right atria. (D) UCSC browser view of the human intronic region (gray) and tested fragments containing AF-associated SNPs (blue) overlaid with chromatin conformation, EMERGE, and conservation tracks. (E) Luciferase assay (n=6) shows enhancer activity differences between non-risk (dark gray) or risk (gray) alleles (Kruskal-Wallis p=0.0019). Statistical significance within each tissue type was determined with ANOVA followed by pairwise comparisons using Dunnett’s T3 multiple comparison test in A, unpaired t-tests in B, C, and Kruskal-Wallis tests followed by pairwise unpaired t-tests (p values shown in figure) in E.
Figure 2—figure supplement 1.
Figure 2—figure supplement 1.. No difference in transcript levels of genes adjacent to Tbx5 in deletion mutants.
(A) Fetal (E14.5) expression levels of Tbx5 were normalized to controls within each litter. (B) Reference gene-corrected expression levels of Rbm19, Tbx3, and Med13l in juvenile whole atria (left) and ventricles (right) in WT (n=5), Tbx5RE(int)KO (n=6), and Tbx5RE(down)KO (n=6). Statistical significance within each gene and tissue type was determined with Kruskal-Wallis tests.
Figure 2—figure supplement 2.
Figure 2—figure supplement 2.. Tbx5 is selectively expressed in cardiomyocyte nuclei in atria of WT and Tbx5RE(int)KO mice.
(A) Immunoflourescence staining on paraffin sections of adult left atria for Tbx5 (red), PCM-1 which marks cardiomyocytes nuclei (green), and DAPI (blue). Red arrowheads point to non-cardiomyocyte (Tbx5-negative, PCM-1-negative) nuclei, and yellow arrowheads point to Tbx5 +cardiomyocytes. Scale bar is 50 µm.
Figure 2—figure supplement 3.
Figure 2—figure supplement 3.. Tbx5 splicing is not affected in deletion mutants.
(A) UCSC browser view shows exon read coverage including the ones flanking the intronic deletion is similar across genotypes. (B) RTq-PCR of WT and Tbx5RE(int)KO (HOM) left and right atria using primers spanning exons 6–8 and 8–9. (C) Resulting amplicon sizes are not different in homozygous mice.
Figure 3.
Figure 3.. Increased Tbx5 in adult atria results in altered in vivo electrophysiology.
(A–C) Graphs show individual and average ECG measurements for heart rate (RR) (A), heart rate variation (SDNN) (B), and PR-interval (C) of adult wild-type, Tbx5RE(int)KO, and Tbx5RE(down)KO mice. (D, E) Graphs show changes in heart rate-corrected sinus node recovery times at 120ms (cSNRT120) (D), and Wenckebach cycle length (WBCL) (E). (F) Bar graph depicts the total time each mouse spent in an atrial arrhythmia (AA) episode after two pacing passes, with the number of mice in which at least one episode lasting >1 s was observed below each bar. (G) Representative traces from wild-type (top) and two Tbx5RE(int)KO (bottom) individuals showing disappearance of p waves or the start of atrial arrhythmia with variability in ventricular response after pacing stimulus. Significance for in vivo parameters was determined with Kruskal-Wallis test followed by Dunn’s multiple comparison tests in A, B, D, and AA duration in F (top graph), and one-way ANOVA followed by Tukey’s multiple comparisons test in C and E. AA inducibility significance was determined with pairwise Fisher’s exact test (F bottom of graph).
Figure 3—figure supplement 1.
Figure 3—figure supplement 1.. Additional in vivo electrophysiology parameters.
(A) Lead 2 traces of WT, Tbx5RE(int)KO, and Tbx5RE(down)KO mice showing slow and variable RR, a sinus pause (arrowhead), or abnormal P waves (asterisk). (B) Graph shows no significant change in QRS duration in either mutant. Statistical significance was determined in B with Kruskal-Wallis test.
Figure 4.
Figure 4.. Atrial function abnormalities in Tbx5RE(int)KO mice.
(A) Typical action potentials (APs) and upstroke velocity measured at 6 Hz in single left atrial cardiomyocytes using the amphotericin-perforated patch clamp technique. (B) Average resting membrane potential (RMP), AP amplitude (APA), and AP upstroke velocity remain unchanged in mutants. (C) AP duration at 20, 50, and 90% of repolarization (APD20, APD50, APD90, respectively) is increased in mutants. (D) APD90 was prolonged at all tested frequencies in mutant left atrial cardiomyocytes. Error bars are SD. (E) Diastolic and systolic intracellular Ca2+ concentrations ([Ca2+]i) were not changed in Tbx5RE(int)KO compared to controls. Statistical significance in B was determined with unpaired t-tests with Welch’s correction, and unpaired t-tests were used in B. Experimental groups were compared using two-way repeated measures ANOVA (D, E), followed by pairwise unpaired t-tests (C). Error bars are SEM.
Figure 5.
Figure 5.. Transcriptomic analysis of Tbx5RE(int)KO left atria.
(A, B) Volcano plot showing differentially expressed transcripts in Tbx5RE(int)KO (n=3)(A) and Tbx5RE(down)KO (n=3) (B) from wild-type (n=4) left atria. Dark red and light red dots indicate significantly upregulated genes by raw p-value and p-adjusted for multiple testing, respectively. Correspondingly, dark blue and light blue dots indicate downregulated genes. p Values were adjusted for multiple testing using the false discovery rate (FDR) method of Benjamini-Hochberg. (C) X-Y plot of all transcripts in Tbx5RE(int)KO (x axis) and Tbx5RE(down)KO (y axis), with deregulated genes common to both deletion mutants in purple, Tbx5RE(int)KO deregulated genes in blue, and Tbx5RE(down)KO deregulated genes in red. (D) Gene ontology (GO) analysis of upregulated and downregulated genes in Tbx5RE(int)KO and Tbx5RE(down)KO mutants. (F) Graph depicts fold change expression in control and mutant samples of genes known to affect action potential duration. * denotes significantly deregulated in one or both mutant lines.
Figure 5—figure supplement 1.
Figure 5—figure supplement 1.. Ion channel expression in left atria of deletion mutants.
(A) Graph depicts differential ion channel expression (fold change) in control and mutant left atria. RPBPL; Reads per (transcript) base pair length.
Figure 5—figure supplement 2.
Figure 5—figure supplement 2.. Comparison of genes differentially expressed between left atria of Tbx5RE(int)KO and control mice, Tbx5G125R/+ and control mice and Tbx5 iKO and control mice.
(A–B) Scatterplots of Log2(Fold Change) of transcripts in Tbx5RE(int)KO (x axis) and (A) Tbx5G125R/+ or (B) Tbx5 iKO (y axis), with deregulated genes (Padj <0.05) common to both genotypes in purple, Tbx5RE(int)KO deregulated genes in blue and Tbx5G125R/+ or Tbx5 iKO deregulated genes in red.
Figure 5—figure supplement 3.
Figure 5—figure supplement 3.. Pitx2 expression is not affected in Tbx5RE(int)KO atria.
(A) RT-qPCR on left and right atria of controls and deletion mutants for Pitx2. Statistical significance was determined by unpaired t-tests (no significant differences detected).
Figure 5—figure supplement 4.
Figure 5—figure supplement 4.. Modest Tbx5 upregulation minimally alters genome-wide chromatin accessibility.
(A) Heatmaps depicting vertically sorted up or downregulated accessible regions spanning 1500 bp bins (Padj <0.05) in Tbx5RE(int)KO (n=4) vs WT (n=4) cardiomyocytes. (B) UCSC browser view of the Tbx5 locus showing differential accessibility profiles in mutants.
Figure 6.
Figure 6.. A genetic interaction between Tbx5 and Prrx1.
(A, B) Graph shows reference gene-corrected expression of Tbx5 (A), and Prrx1 (B) in PCM1-positive and -negative nuclei fractions of wild-type, Tbx5RE(int)KO, Prrx1(enh)KO and double mutant whole hearts determined by RT-qPCR. (C) Principal component analysis of transcriptomes of wild-type, Tbx5RE(int)KO and DoubleKO left atrial samples. (D–H) Graphs show individual and average ECG measurements for RR (D), heart rate variation (SDNN) (E), PR interval (F), cSNRT at 120ms pacing (G), and WBCL (H) of wild-type, Tbx5RE(int)KO, Prrx1(enh)KO and DoubleKO mice. (I) Bar graph depicts the total time each mouse spent in an AA episode after two pacing passes, with the number of mice in which at least one episode lasting >1 s was observed below each bar. Statistical significance was determined using one-way ANOVA followed by Tukey’s test for pairwise comparisons in A, B, F, H, Kruskal-Wallis test followed by Dunn’s test for pairwise comparisons in D, E, G, and AA duration in I (top of graph), Fisher’s exact test for pairwise comparisons of AA inducibility in I (bottom of graph).
Figure 6—figure supplement 1.
Figure 6—figure supplement 1.. Comparison of genes differentially expressed between left atria of Prrx1(enh)KO and control mice, Tbx5RE(int)KO and control mice, and Double homozygous mutants and control mice.
(A–B) X-Y plot of all transcripts in Prrx1(enh)KO (A) or Tbx5RE(int)KO (B) (x axis) and Double homozygous (y axis), with deregulated genes (Padj <0.05) common to both genotypes in purple, Prrx1(enh)KO, or Tbx5RE(int)KO deregulated genes in red and Double homozygous deregulated genes in blue. (C) Plot depicts comparison between Tbx5RE(int)KO (x axis) and Prrx1(enh)KO (y axis). (D) Box plots showing differences in Log2(Fold Change) distribution of Prrx1(enh)KO, Tbx5RE(int)KO, and Double homozygous left atria.

Similar articles

Cited by

References

    1. Albergante L, Blow JJ, Newman TJ. Buffered qualitative stability explains the robustness and evolvability of transcriptional networks. eLife. 2014;3:e02863. doi: 10.7554/eLife.02863. - DOI - PMC - PubMed
    1. Bamshad M, Lin RC, Law DJ, Watkins WC, Krakowiak PA, Moore ME, Franceschini P, Lala R, Holmes LB, Gebuhr TC, Bruneau BG, Schinzel A, Seidman JG, Seidman CE, Jorde LB. Mutations in human TBX3 alter limb, apocrine and genital development in Ulnar-Mammary syndrome. Nature Genetics. 1997;16:311–315. doi: 10.1038/ng0797-311. - DOI - PubMed
    1. Barry PH, Lynch JW. Liquid junction potentials and small cell effects in patch-clamp analysis. The Journal of Membrane Biology. 1991;121:101–117. doi: 10.1007/BF01870526. - DOI - PubMed
    1. Basson CT, Bachinsky DR, Lin RC, Levi T, Elkins JA, Soults J, Grayzel D, Kroumpouzou E, Traill TA, Leblanc-Straceski J, Renault B, Kucherlapati R, Seidman JG, Seidman CE. Mutations in human Tbx5 [ corrected ] cause limb and cardiac malformation in Holt-Oram syndrome. Nature Genetics. 1997;15:30–35. doi: 10.1038/ng0197-30. - DOI - PubMed
    1. Berecki G, Wilders R, de Jonge B, van Ginneken ACG, Verkerk AO. Re-Evaluation of the action potential upstroke velocity as a measure of the Na+ current in cardiac myocytes at physiological conditions. PLOS ONE. 2010;5:e15772. doi: 10.1371/journal.pone.0015772. - DOI - PMC - PubMed

Publication types

Associated data