. 2023 Apr 3;13(4):1002-1025.
doi: 10.1158/2159-8290.CD-22-0805.

LKB1-Dependent Regulation of TPI1 Creates a Divergent Metabolic Liability between Human and Mouse Lung Adenocarcinoma

Affiliations

LKB1-Dependent Regulation of TPI1 Creates a Divergent Metabolic Liability between Human and Mouse Lung Adenocarcinoma

Benjamin D Stein et al. Cancer Discov. .

Abstract

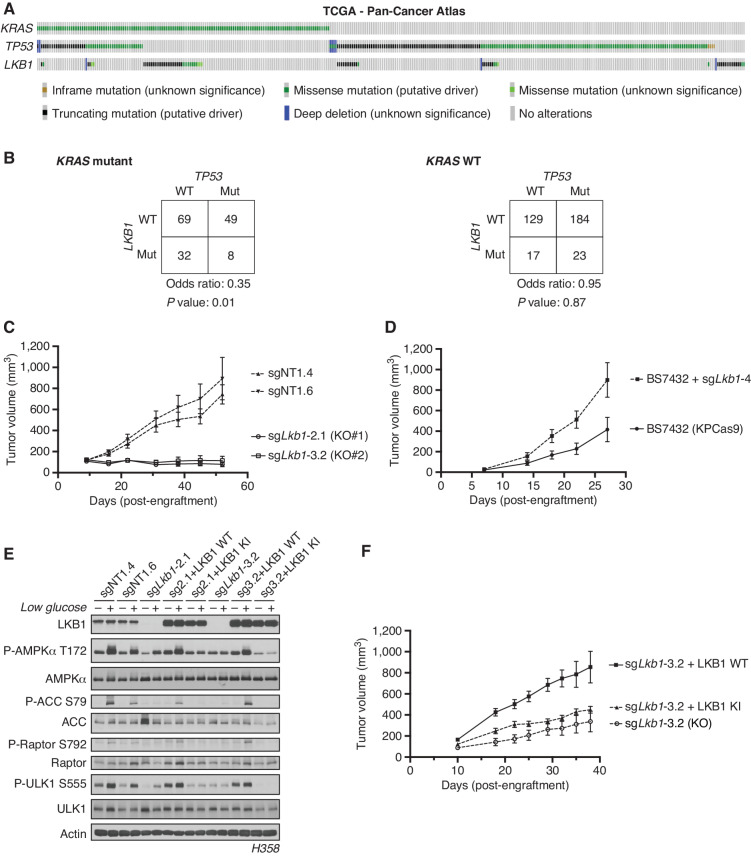
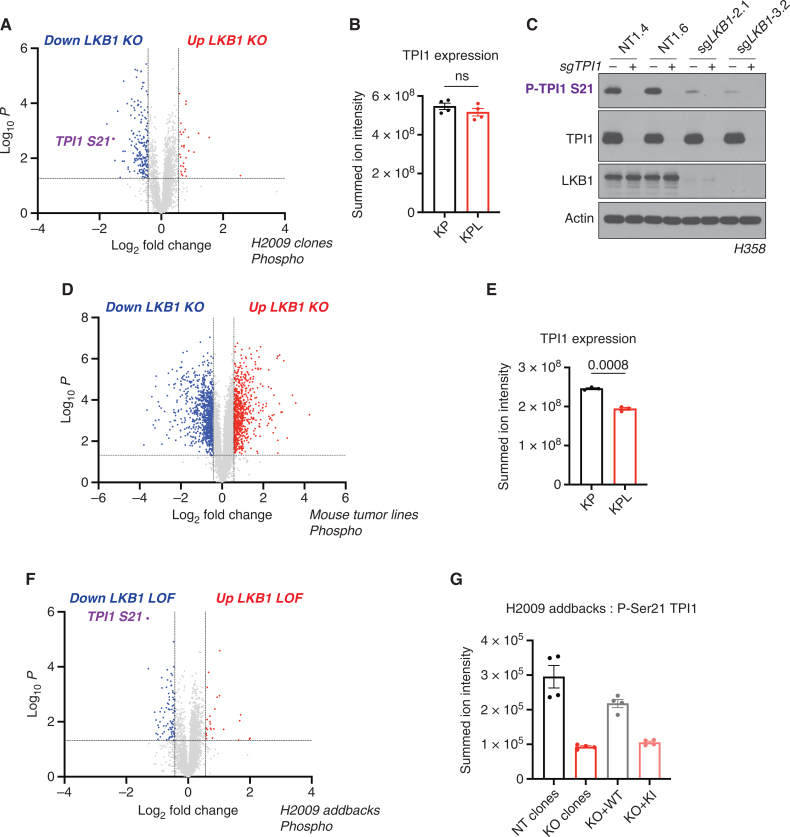
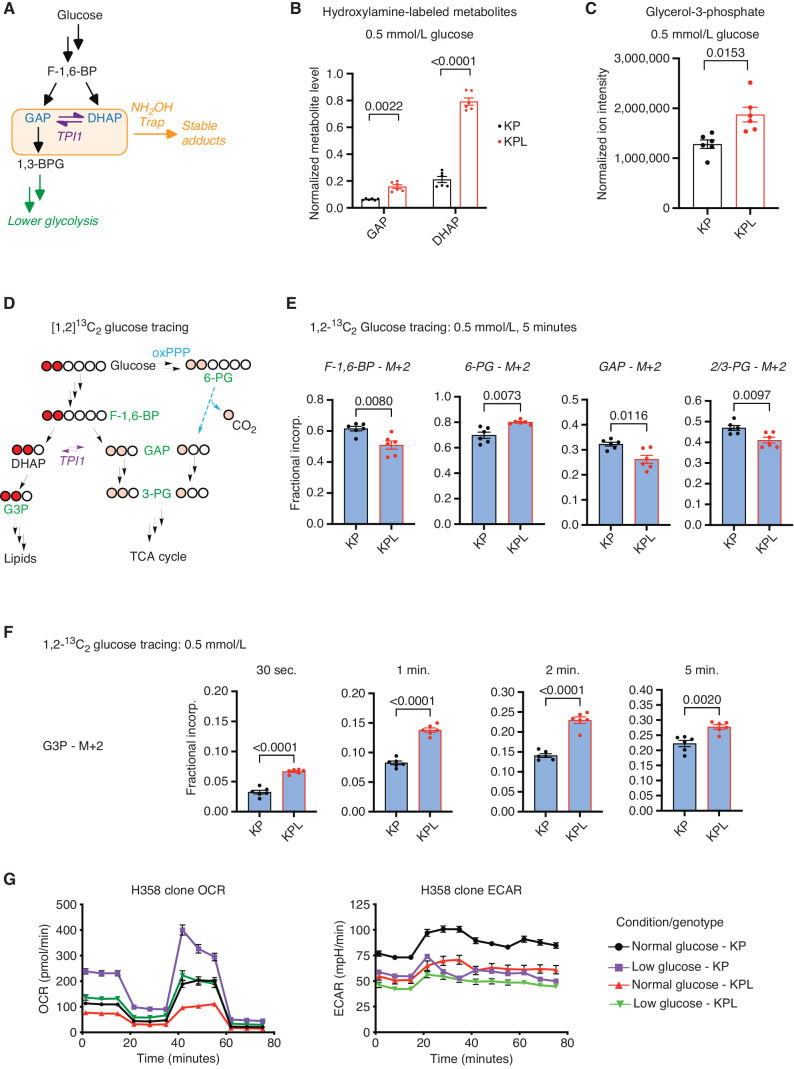
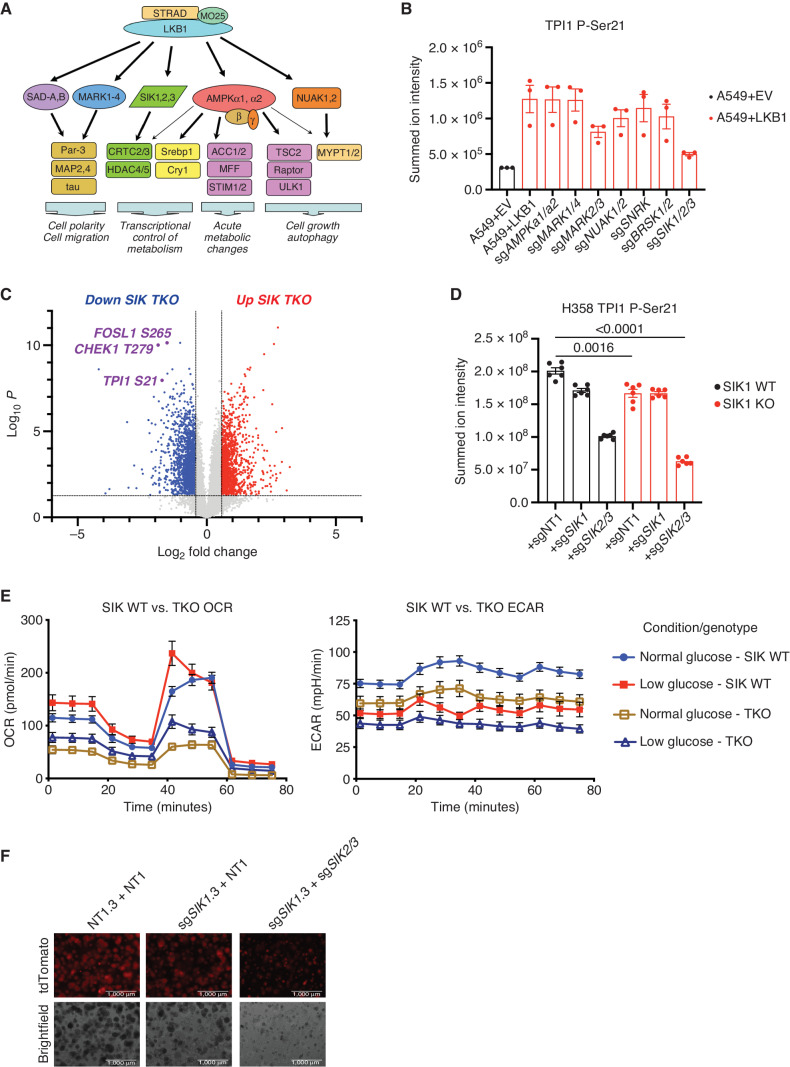
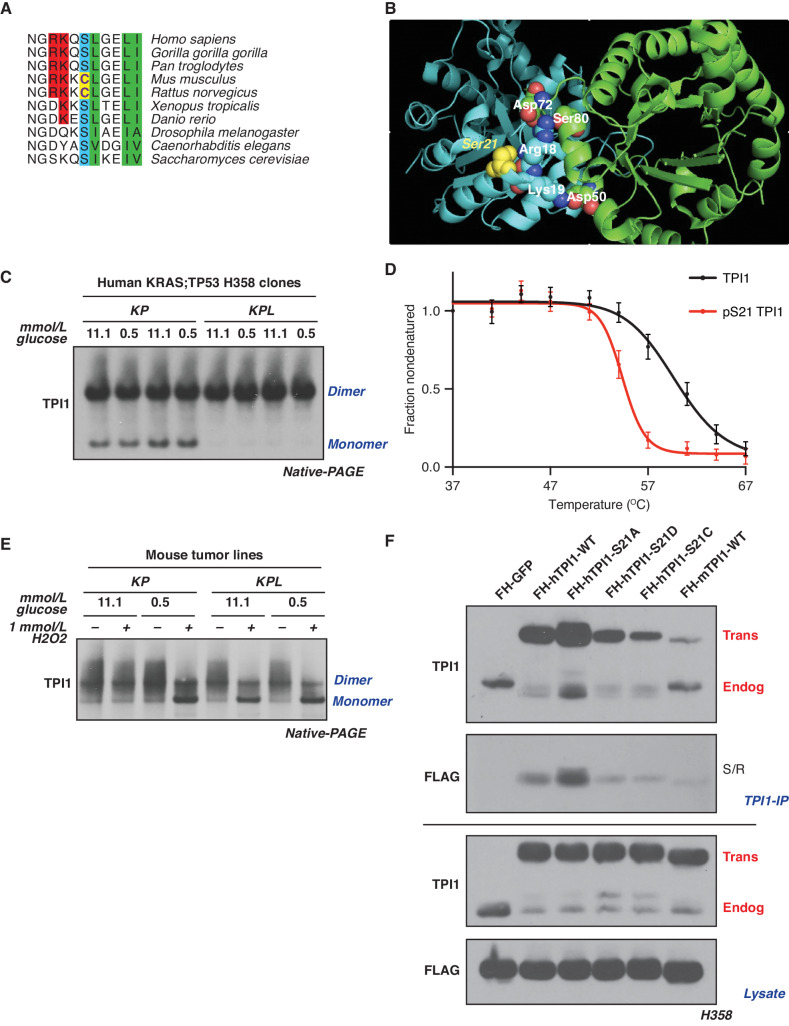
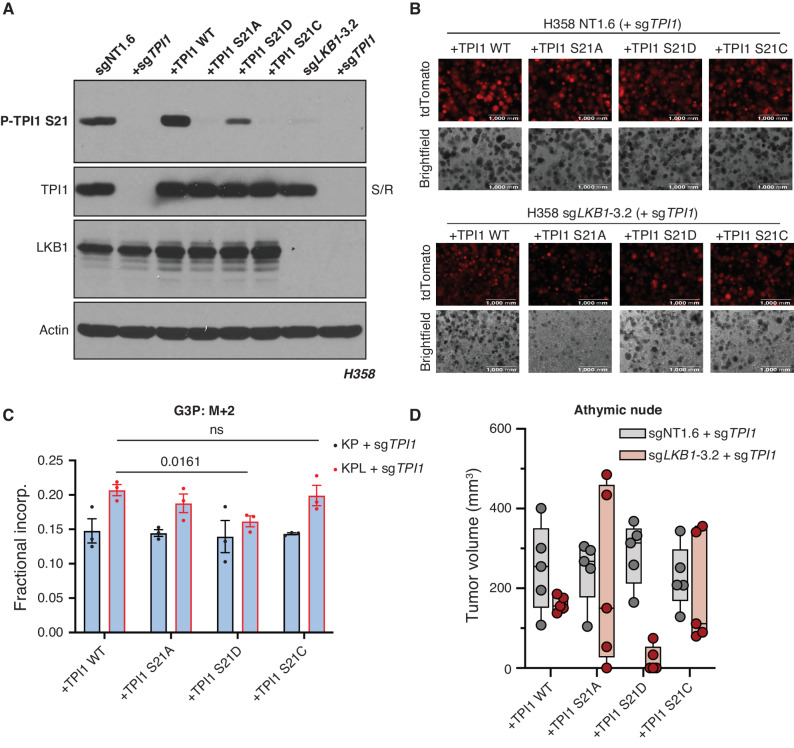
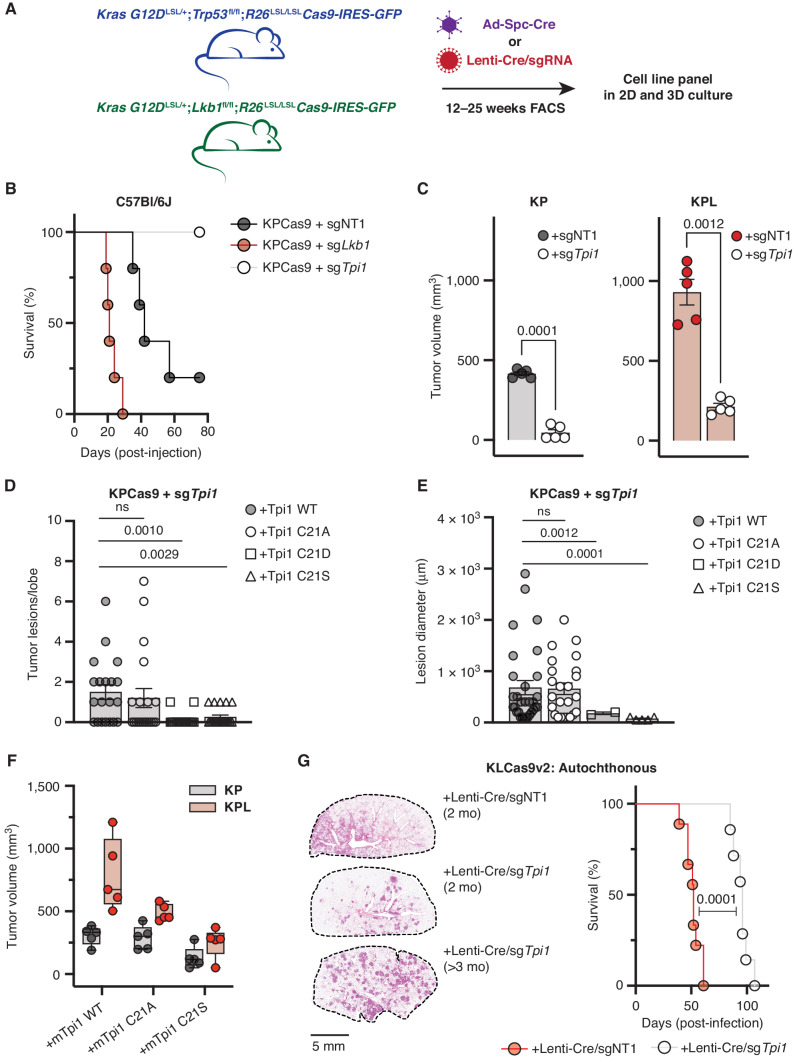
KRAS is the most frequently mutated oncogene in human lung adenocarcinomas (hLUAD), and activating mutations frequently co-occur with loss-of-function mutations in TP53 or STK11/LKB1. However, mutation of all three genes is rarely observed in hLUAD, even though engineered comutation is highly aggressive in mouse lung adenocarcinoma (mLUAD). Here, we provide a mechanistic explanation for this difference by uncovering an evolutionary divergence in the regulation of triosephosphate isomerase (TPI1). In hLUAD, TPI1 activity is regulated via phosphorylation at Ser21 by the salt inducible kinases (SIK) in an LKB1-dependent manner, modulating flux between the completion of glycolysis and production of glycerol lipids. In mice, Ser21 of TPI1 is a Cys residue that can be oxidized to alter TPI1 activity without a need for SIKs or LKB1. Our findings suggest this metabolic flexibility is critical in rapidly growing cells with KRAS and TP53 mutations, explaining why the loss of LKB1 creates a liability in these tumors.

Significance: Utilizing phosphoproteomics and metabolomics in genetically engineered human cell lines and genetically engineered mouse models (GEMM), we uncover an evolutionary divergence in metabolic regulation within a clinically relevant genotype of human LUAD with therapeutic implications. Our data provide a cautionary example of the limits of GEMMs as tools to study human diseases such as cancers. This article is highlighted in the In This Issue feature, p. 799.


Figures

Figure 1. Co-occurrence of KRAS, TP53, and LKB1 mutations differentially affects the growth of human and mouse LUADs. A, The Cancer Genome Atlas PanCancer Atlas oncoprint of co-occurrence of KRAS, TP53, and LKB1 in human LUAD patients. B, Fisher exact test of the statistical likelihood of co-occurrence of LKB1 and TP53 mutations in a KRAS-mutant or WT background, respectively. C, Graph of mean (± SEM) tumor volumes of subcutaneous flank injections of H358 (KRAS;TP53) isogenic clones expressing Cas9 and a nontargeting (sgNT1.4 and sgNT1.6) or LKB1-specific (sgLKB1-2.1 and sgLKB13.2) guide RNA. 1 × 10⁶ cells implanted in the right hind flank (n = 10 per cohort). D, Mean (± SEM) volumes of isogenic KPCas9 LUAD allograft tumors expressing a nontargeting (BS7432) or Lkb1-specific (sgLkb1-4) guide RNA. 0.25 × 10⁶ cells implanted in left and right flank of C57Bl/6J mice (n = 10 per cohort). E, Western blot analysis of H358 (KRAS;TP53) isogenic clones (KP: sgNT1.4 and sgNT1.6; KPL: sgLKB1-2.1 and sgLKB1-3.2) and KPL lines with additional transgenic expression of guide RNA-resistant LKB1 WT; sgLKB1-2.1 + LKB1 WT and sgLKB1-3.2 + LKB1 WT) or LKB1 kinase–inactive (KI); sgLKB1-2.1 + LKB1 KI and sgLKB1-3.2 LKB1 KI) and treated with 11.1 mmol/L or 0.5 mmol/L glucose for 6 hours as indicated. Restoration of AMPK signaling in LKB1 WT lines in response to 0.5 mmol/L glucose validated by blotting for P-AMPK Thr172 and downstream substrates (P-ACC S79, P-ULK1 S555, and P-Raptor S792). Similar results were observed in three independent experiments and in an additional KRAS;TP53 cell line, H2009 (Supplementary Fig. S1E). F, Graph of mean (± SEM) tumor volumes of subcutaneous flank injections of H358 (KRAS;TP53) isogenic clones with transgenic expression of an empty vector (KO) or guide RNA-resistant LKB1 wild-type (LKB1 WT) or LKB1 kinase–inactive (LKB1 KI). 1 × 10⁶ cells implanted in the right hind flank (n = 10 per cohort).
Figure 1.
Co-occurrence of KRAS, TP53, and LKB1 mutations differentially affects the growth of human and mouse LUADs. A, The TCGA Pan-Cancer Atlas oncoprint of co-occurrence of KRAS, TP53, and LKB1 in hLUAD patients. B, Fisher exact test of the statistical likelihood of co-occurrence of LKB1 and TP53 mutations in a KRAS-mutant or wild-type (WT) background, respectively. C, Graph of mean (± SEM) tumor volumes of subcutaneous flank injections of H358 (KRAS;TP53) isogenic clones expressing Cas9 and a nontargeting (sgNT1.4 and sgNT1.6) or LKB1-specific (sgLkb1-2.1 and sgLkb1-3.2) guide RNA; 1 × 10⁶ cells were implanted in the right hind flank (n = 10 per cohort). KO, knockout. D, Mean (± SEM) volumes of isogenic KPCas9 LUAD allograft tumors expressing a nontargeting (BS7432) or Lkb1-specific (sgLkb1-4) guide RNA; 0.25 × 10⁶ cells were implanted in left and right flank of C57Bl/6J mice (n = 10 per cohort). E, Western blot analysis of H358 (KRAS;TP53) isogenic clones (KP: sgNT1.4 and sgNT1.6; KPL: sgLkb1-2.1 and sgLkb1-3.2) and KPL lines with additional transgenic expression of guide RNA resistant LKB1 WT (sgLkb1-2.1 + LKB1 WT and sgLkb1-3.2 + LKB1 WT) or LKB1 kinase-inactive (KI; sgLkb1-2.1 + LKB1 KI and sgLkb1-3.2 LKB1 KI) and treated with 11.1 mmol/L or 0.5 mmol/L glucose for 6 hours as indicated. Restoration of AMPK signaling in LKB1 WT lines in response to 0.5 mmol/L glucose validated by blotting for P-AMPK Thr172 and downstream substrates (P-ACC S79, P-ULK1 S555, and P-Raptor S792). Similar results were observed in three independent experiments and in an additional KRAS;TP53 cell line, H2009 (Supplementary Fig. S1E). F, Graph of mean (± SEM) tumor volumes of subcutaneous flank injections of H358 (KRAS;TP53) isogenic clones with transgenic expression of an empty vector (KO) or guide RNA resistant LKB1 WT or LKB1 KI; 1 × 10⁶ cells were implanted in the right hind flank (n = 10 per cohort).
Figure 2. Phosphorylation of human TPI1 is LKB1-dependent and regulates triose phosphate levels. A, Volcano plot of quantitative phospho-proteomic data of genetic sensitivity in H2009 clones (2 KP clones and 2 KPL clones), two biological replicates each, N = 4 per genotype. Cells were grown in 0.5 mmol/L glucose for 6 hours. Phosphopeptides that pass statistical criteria (P < 0.05) are highlighted in black, red and blue, peptides that do not satisfy this are colored gray. Phosphopeptides colored red satisfy a fold change > 1.5; colored blue, fold change <−1.5. TPI1 P-Ser21 peptide labeled in purple text. B, Bar graph of summed ion intensities for TPI1 protein expression in H2009 isogenic lines (KP: sgNT1.1 and sgNT1.2; KPL: sgLKB1-3.1 and sgLKB1-3.7). Cell lines were treated with 0.5 mmol/L glucose for 6 hours prior to collection. Data, representative of 4 independent biological experiments and reported as the mean (± SEM). Statistical significance was determined by a two-tailed paired t test. C, Western blot analysis of H358 (KRAS;TP53) isogenic cell (KP: sgNT1.4 and sgNT1.6; KPL: sgLKB1-2.1 and sgLKB1-3.2) and KPL lines to validate phospho-specific antibody. D, Volcano plot for comparison of quantitative phospho-proteomic data of genetic sensitivity in mLUAD cell lines, 634T (KP) and Lkb1-t2 (KPL) in biological triplicate for each condition. Analysis was conducted on cells treated with 0.5 mmol/L glucose for 6 hours in culture. Statistical criteria and color scheme same as for other Volcano plots presented. E, Bar graph of summed ion intensities for TPI1 protein expression in mLUAD lines from companion unenriched total proteomic analysis. Data, representative of 3 independent biological experiments and reported as the mean (± SEM). Statistical significance was determined by a two-tailed paired t test. F, Volcano plot of quantitative phospho-proteomic data of genetic sensitivity in H2009 isogenic clones including clones with transgenic expression of guide RNA-resistant WT or kinase-inactive (KI) LKB1 in LKB1-specific knockouts (sgLKB1-3.1 and sgLKB1-3.7) from Supplementary Fig. S1E; 4 biological replicates each. LKB1 loss-of-function (LOF) group consisted of merging LKB1 knockout lines (KPL: sgLKB1-3.1 and sgLKB1-3.7) with lines expressing guide RNA-resistant LKB1 KI (KPL + LKB1 KI: sgLKB1-3.1 + LKB1 KI and sgLKB1–3.7 + LKB1 KI); and compared with H2009 lines containing nontargeting guide RNA (KP: sgNT1.1 and sgNT1.2) merged with LKB1 knockout lines expressing guide RNA-resistant LKB1 WT (KPL + LKB1 WT: sgLKB1–3.1 + LKB1 WT and sgLKB1-3.7 + LKB1 WT) at the phosphopeptide level. Cells were grown in 0.5 mmol/L glucose for 6 hours. Statistical criteria and color scheme same as for A. TPI1 P-Ser21 peptide labeled in purple text. G, Summed ion intensity of the H2009 (KRAS;TP53) isogenic clones (KP: sgNT1.1 and sgNT1.2; KPL: sgLKB1-3.1 and sgLKB1-3.7) and lines with additional transgenic expression of guide RNA-resistant LKB1 WT; sgLKB1-3.1 + LKB1 WT and sgLKB1-3.7 + LKB1 WT) or LKB1 kinase–inactive (KI; sgLKB1-3.1 + LKB1 KI and sgLKB1-3.7 LKB1 KI) for the phosphopeptide containing Serine 21 of TPI1 from the experiments from which the volcano plot in Supplementary Fig. S2E was derived. Bar graph depicts each genotype individually and shows the restoration of TPI1 phosphorylation in KPL lines expressing transgenic WT LKB1 but not KI LKB1. Ion intensities were normalized to identify TPI1 protein expression from paired unenriched total proteomic analysis across conditions to control for protein expression; the relevant phosphopeptide was observed 3 times in each biological replicate.
Figure 2.
Phosphorylation of human TPI1 is LKB1-dependent and regulates triose phosphate levels. A, Volcano plot of quantitative phosphoproteomic data of genetic sensitivity in H2009 clones (2 KP clones and 2 KPL clones); 2 biological replicates each, n = 4 per genotype. Cells were grown in 0.5 mmol/L glucose for 6 hours. Phosphopeptides that pass statistical criteria (P < 0.05) are highlighted in red and blue; peptides that do not satisfy this are colored gray. Phosphopeptides colored red satisfy a fold change > 1.5 and those colored blue satisfy a fold change < −1.5. The TPI1 P-Ser21 peptide labeled in purple text. KO, knockout. B, Bar graph of summed ion intensities for TPI1 protein expression in H2009 isogenic lines (KP: sgNT1.1 and sgNT1.2; KPL: sgLKB1-3.1 and sgLKB1-3.7). Cell lines were treated with 0.5 mmol/L glucose for 6 hours prior to collection. Data are representative of 4 independent biological experiments and reported as the mean (± SEM). Statistical significance was determined by a two-tailed paired t test. ns, not significant. C, Western blot analysis of H358 (KRAS;TP53) isogenic cell (KP: sgNT1.4 and sgNT1.6; KPL: sgLKB1-2.1 and sgLKB1-3.2) and KPL lines to validate phosphospecific antibody. D, Volcano plot for comparison of quantitative phosphoproteomic data of genetic sensitivity in mLUAD cell lines, 634T (KP) and Lkb1-t2 (KPL), in biological triplicate for each condition. Analysis was conducted on cells treated with 0.5 mmol/L glucose for 6 hours in culture. Statistical criteria and color scheme are the same as for other volcano plots presented. E, Bar graph of summed ion intensities for TPI1 protein expression in mLUAD lines from companion unenriched total proteomic analysis. Data are representative of 3 independent biological experiments and reported as the mean (±SEM). Statistical significance was determined by a two-tailed paired t test. F, Volcano plot of quantitative phosphoproteomic data of genetic sensitivity in H2009 isogenic clones including clones with transgenic expression of guide RNA resistant WT or KI LKB1 in LKB1-specific KO (sgLKB1-3.1 and sgLKB1-3.7) from Supplementary Fig. S1E; 4 biological replicates each. The LKB1 loss-of-function (LOF) group consisted of merging LKB1 KO lines (KPL: sgLKB1-3.1 and sgLKB1-3.7) with lines expressing guide RNA resistant LKB1 KI (KPL + LKB1 KI: sgLKB1-3.1 + LKB1 KI and sgLKB1-3.7 + LKB1 KI), and was compared with H2009 lines containing nontargeting guide RNAs (KP: sgNT1.1 and sgNT1.2) merged with LKB1 KO lines expressing guide RNA resistant LKB1 WT (KPL + LKB1 WT: sgLKB1-3.1 + LKB1 WT and sgLKB1-3.7 + LKB1 WT) at the phosphopeptide level. Cells were grown in 0.5 mmol/L glucose for 6 hours. Statistical criteria and color scheme same as for A. The TPI1 P-Ser21 peptide is labeled in purple text. G, Summed ion intensity of the H2009 (KRAS;TP53) isogenic clones (KP: sgNT1.1 and sgNT1.2; KPL: sgLKB1-3.1 and sgLKB1-3.7) and lines with additional transgenic expression of guide RNA resistant LKB1 WT (sgLKB1-3.1 + LKB1 WT and sgLKB1-3.7 + LKB1 WT) or LKB1 KI (sgLKB1-3.1 + LKB1 KI and sgLKB1-3.7 LKB1 KI) for the phosphopeptide containing Ser21 of TPI1 from the experiments from which the volcano plot in Supplementary Fig. S2E was derived. Bar graph depicts each genotype individually and shows the restoration of TPI1 phosphorylation in KPL lines expressing transgenic WT LKB1 but not KI LKB1. Ion intensities were normalized to identify TPI1 protein expression from paired unenriched total proteomic analysis across conditions to control for protein expression; the relevant phosphopeptide was observed 3 times in each biological replicate.
Figure 3. TPI1 phosphorylation regulates triose phosphate levels and metabolic flux. A, Schematic showing metabolites (shaded in the orange box) chemically labeled to create stable adducts. B, Bar graph depicting in situ chemical-trapping metabolomics of hydroxylamine-labeled GAP and DHAP in H2009 clones (KP: sgNT1.1 and sgNT1.2; KPL: sgLKB1-3.1 and sgLKB1-3.7) treated in culture for 6 hours with 0.5 mmol/L, respectively. Data, representative of three independent biological experiments each containing three technical replicates and reported as the mean (± SEM). Cell number normalized across models 12 hours prior to assay and samples normalized to an exogenous standard, d 3-serine. Statistical significance was determined by a two-tailed paired t test. C, Normalized ion intensity of glycerol-3-phosphate from steady-state analysis of H2009 clones treated for 30 minutes with 0.5 mmol/L glucose. Analysis conducted in H2009 isogenic clones (KP: sgNT1.1 and sgNT1.2; KPL: sgLKB1-3.1 and sgLKB1-3.7) in biological triplicate and reported as the mean (± SEM). Statistical significance was determined by a two-tailed paired t test. D, Schematic showing isotopic glucose tracing using positionally labeled 1,2-13C2 glucose with circles representing carbons in each metabolite. Red circles indicate isotopic carbons and direct path to lipid synthesis through DHAP. Pink circles indicate readout of TPI1 conversion of DHAP to GAP and downstream glycolytic intermediates as well as alternate flux through the oxidative pentose phosphate pathway. Green text indicates metabolites monitored and presented in histograms. E, Isotopic tracing results for M+2 isotopologues at 5-minute time point. Analysis conducted in H358 isogenic lines (KP: sgNT1.4 and sgNT1.6; KPL: sgLKB1-2.1 and sgLKB1-3.2) in biological triplicate (N = 6 per genotype) and reported as the mean (± SEM). Statistical significance was determined by a two-tailed paired t test. F, Isotopic tracing results for M+2 isotopologue for glycerol-3-phosphate at 30 seconds, 1, 2, and 5 minutes. Analysis conducted in H358 isogenic lines (KP: sgNT1.4 and sgNT1.6; KPL: sgLKB1-2.1 and sgLKB1-3.2) in biological triplicate (N = 6 per genotype) and reported as the mean (± SEM). Statistical significance was determined by a two-tailed paired t test. G, Mitochondrial Stress test results; oxygen consumption rate (OCR) and ECAR plotted over the course of the assay. Analysis conducted in H358 isogenic lines (KP: sgNT1.4 and sgNT1.6; KPL: sgLKB1-2.1 and sgLKB1-3.2) in biological triplicate (N = 6 per genotype) and reported as the mean (± SEM) and treated as indicated with normal (11.1 mmol/L) or low (0.5 mmol/L) glucose for 6 hours prior.
Figure 3.
TPI1 phosphorylation regulates triose phosphate levels and metabolic flux. A, Schematic showing metabolites (shaded in the orange box) chemically labeled to create stable adducts. 1,3-BPG, 1,3-bisphosphoglycerate. B, Bar graph depicting in situ chemical-trapping metabolomics of hydroxylamine-labeled GAP and DHAP in H2009 clones (KP: sgNT1.1 and sgNT1.2; KPL: sgLKB1-3.1 and sgLKB1-3.7) treated in culture for 6 hours with 0.5 mmol/L. Data are representative of 3 independent biological experiments each containing 3 technical replicates and reported as the mean (±SEM). Cell number was normalized across models 12 hours prior to assay, and samples were normalized to an exogenous standard, d3-serine. Statistical significance was determined by a two-tailed paired t test. C, Normalized ion intensity of G3P from steady-state analysis of H2009 clones treated for 30 minutes with 0.5 mmol/L glucose. Analysis conducted in H2009 isogenic clones (KP: sgNT1.1 and sgNT1.2; KPL: sgLKB1-3.1 and sgLKB1-3.7) in biological triplicate and reported as the mean (± SEM). Statistical significance was determined by a two-tailed paired t test. D, Schematic showing isotopic glucose tracing using positionally labeled 1,2-13C2 glucose, with circles representing carbons in each metabolite. Red circles indicate isotopic carbons and direct path to lipid synthesis through DHAP. Pink circles indicate readout of TPI1 conversion of DHAP to GAP and downstream glycolytic intermediates as well as alternate flux through the oxPPP. Green text indicates metabolites monitored and presented in histograms. E, Isotopic tracing results for M+2 isotopologues at 5-minute time point. Analysis conducted in H358 isogenic lines (KP: sgNT1.4 and sgNT1.6; KPL: sgLKB1-2.1 and sgLKB1-3.2) in biological triplicate (n = 6 per genotype) and reported as the mean (± SEM). Statistical significance was determined by a two-tailed paired t test. F, Isotopic tracing results for M+2 isotopologue for G3P at 30 seconds and 1, 2, and 5 minutes. Analysis conducted in H358 isogenic lines (KP: sgNT1.4 and sgNT1.6; KPL: sgLKB1-2.1 and sgLKB1-3.2) in biological triplicate (n = 6 per genotype) and reported as the mean (± SEM). Statistical significance was determined by a two-tailed paired t test. G, Mitochondrial stress test results; oxygen consumption rate (OCR) and extracellular acidification rate (ECAR) plotted over the course of the assay. Analysis conducted in H358 isogenic lines (KP: sgNT1.4 and sgNT1.6; KPL: sgLKB1-2.1 and sgLKB1-3.2) in biological triplicate (n = 6 per genotype) and reported as the mean (± SEM) and treated as indicated with normal (11.1 mmol/L) or low (0.5 mmol/L) glucose for 6 hours prior.
Figure 4. SIK phosphorylate human TPI1 in KP hLUAD cell lines. A, Cartoon depicting regulation of the AMPK-related (AMPKR) kinase family members by LKB1 and their downstream substrates. B, Bar graph of summed ion intensity for the TPI1-derived Ser-21 phosphopeptide from extracts of A549 cell lines infected with an empty vector or a vector expressing WT LKB1; the indicated guide RNAs were used to inactivate members of the AMPKR subfamilies in LKB1 transgenic expressing cells. Cell lines were cultured in 11.1 mmol/L glucose prior to analysis. Ion intensities were normalized to identified nonphosphorylated peptides across conditions to control for protein expression and reported as the mean (± SEM). C, Volcano plot of quantitative phospho-proteomic data used to compare phosphorylation in H358 clones (2 KP clones and 2 KP SIK TKO clones, with 3 biological replicates of each). Cells were cultured in 0.5 mmol/L glucose for 6 hours before lysis. Phosphopeptides that pass statistical criteria (P < 0.05) are highlighted in black, red, and blue; those that do not satisfy this criterion are colored gray. Proteins highlighted in red satisfy the fold change threshold (>1.5) after triple deletion of SIK1,2,3. Phosphopeptides highlighted in blue satisfy the fold change threshold of <−1.5) for a decrease after SIK1,2,3 triple deletion. D, Bar graph of summed ion intensities for the TPI1-derived, Ser-21 phosphopeptide in extracts of isogenic H358 cell lines containing a nontargeting control (sgNT1.3 and sgNT1.4) or SIK1-specific (sgSIK1.3 and sgSIK1.4) guide RNA and additional control (NT1) SIK1 (sgSIK1) or dual SIK2 and SIK3 (sgSIK2/3) guide RNAs in a polyclonal population. Ion intensities were normalized against identified nonphosphorylated variant across conditions. Cell lines were cultured in 0.5 mmol/L glucose prior to lysis, analyzed in biological triplicate per clone, N = 6 per genotype, and reported as the mean ((± SEM). Statistical significance was determined by a two-tailed paired t test. E, Mitochondrial stress test results; OCR and ECAR plotted over the course of the assay, respectively. Analysis conducted in H358 isogenic lines used for phospho-proteomic analysis in D in biological triplicate (N = 6 per genotype) and reported as the mean ((± SEM) and treated as indicated with normal (11.1 mmol/L) or low (0.5 mmol/L) glucose for 6 hours prior. F, 3D spheroid growth in Matrigel of isogenic clones of the H358 cell line labeled with a tdTomato fluorescent reporter and expressing CAS9 and nontargeting controls (sgNT1.3) or SIK1-specific (sgSIK1-2.3) guide RNA and additional control (NT1) or dual SIK2 and SIK3 (sgSIK2/3) guide RNAs in a polyclonal population. 5,000 cells were seeded into Matrigel and grown for 14 days, and the media were changed every 24 hours. Images were taken on an EVOS fluorescence microscope under 4× magnification and filtered to resolve tdTomato signal intensity and brightfield.
Figure 4.
SIKs phosphorylate human TPI1 in KP hLUAD cell lines. A, Cartoon depicting regulation of the AMPKR kinase family members by LKB1 and their downstream substrates. B, Bar graph of summed ion intensity for the TPI1-derived Ser21 phosphopeptide from extracts of A549 cell lines infected with an empty vector (EV) or a vector expressing WT LKB1; the indicated guide RNAs were used to inactivate members of the AMPKR subfamilies in LKB1 transgenic expressing cells. Cell lines were cultured in 11.1 mmol/L glucose prior to analysis. Ion intensities were normalized to identified nonphosphorylated peptides across conditions to control for protein expression and reported as the mean (±SEM). C, Volcano plot of quantitative phosphoproteomic data used to compare phosphorylation in H358 clones (2 KP clones and 2 KP SIK TKO clones, with 3 biological replicates of each). Cells were cultured in 0.5 mmol/L glucose for 6 hours before lysis. Phosphopeptides that pass statistical criteria (P < 0.05) are highlighted in red and blue; those that do not satisfy this criterion are colored gray. Proteins highlighted in red satisfy the fold change threshold of >1.5 after triple deletion of SIK1,2,3. Phosphopeptides highlighted in blue satisfy the fold change threshold of < −1.5 for a decrease after SIK1,2,3 triple deletion. D, Bar graph of summed ion intensities for the TPI1-derived Ser21 phosphopeptide in extracts of isogenic H358 cell lines containing a nontargeting control (sgNT1.3 and sgNT1.4) or SIK1-specific (sgSIK1.3 and sgSIK1.4) guide RNA and additional control (NT1), SIK1 (sgSIK1), or dual SIK2 and SIK3 (sgSIK2/3) guide RNAs in a polyclonal population. Ion intensities were normalized against identified nonphosphorylated variant across conditions. Cell lines were cultured in 0.5 mmol/L glucose prior to lysis, analyzed in biological triplicate per clone (n = 6 per genotype), and reported as the mean (± SEM). Statistical significance was determined by a two-tailed paired t test. KO, knockout. E, Mitochondrial stress test results; oxygen consumption rate (OCR) and ECAR plotted over the course of the assay, respectively. Analysis conducted in H358 isogenic lines used for phosphoproteomic analysis in D in biological triplicate (n = 6 per genotype) and reported as the mean (± SEM) and treated as indicated with normal (11.1 mmol/L) or low (0.5 mmol/L) glucose for 6 hours prior. F, 3D spheroid growth in Matrigel of isogenic clones of the H358 cell line labeled with a tdTomato fluorescent reporter and expressing Cas9 and nontargeting controls (sgNT1.3) or SIK1-specific (sgSIK1-2.3) guide RNA and additional control (NT1) or dual SIK2 and SIK3 (sgSIK2/3) guide RNAs in a polyclonal population. Five thousand cells were seeded into Matrigel and grown for 14 days, and the media were changed every 24 hours. Images were taken on an EVOS fluorescence microscope under 4× magnification and filtered to resolve tdTomato signal intensity and brightfield.
Figure 5. LKB1 regulates the multimeric state of hTPI1 but not mTpi1 due to an amino acid difference at position 21. A, Sequence alignment of TPI1 amino acid residues 16 to 26 across species, showing conservation of Ser21 from H. sapiens to S. cerevisiae, with cysteine at position 21 in mouse and rat Tpi1. Cartoon comparing predicted side-chain chemistry, with oxidized cysteine and phosphorylated serine, is drawn below. B, Crystal structure of TPI1 homodimer (cyan and green, respectively) with critical residues highlighted in space-filling atoms. Serine 21 on the cyan monomer is highlighted in yellow. C, Western blot analysis of Blue Native PAGE of human isogenic clones derived from KP H358 hLUAD cell line. Cells were grown under normal (11.1 mmol/L) or low (0.5 mmol/L) glucose conditions for 6 hours prior to collection. D, Melting curve plot from thermal profiling of unmodified and serine 21 phosphorylated TPI1. Analysis conducted in H2009 and H358 isogenic clones expressing Cas9 and a nontargeting (sgNT1.1 and sgNT1.2 or sgNT1.4 and sgNT1.6, respectively) guide RNA. Data presented are from seven biological replicates and reported as the mean (± SEM). E, Western blot (Blue Native PAGE) of extracts from mLUAD cell lines. Cells were cultured in either 11.1 mmol/L or 0.5 mmol/L glucose for 6 hours and then treated with 1 mmol/L H2O2 for 15 minutes. F, Western blot of proteins coimmunoprecipitated from extracts of H358 cells expressing Cas9 and a nontargeting (FH-GFP cell line) or TPI1-specific (all other cell lines) guide RNA and transgenic expression of Flag-HA tagged GFP or guide RNA-resistant TPI1 allelic variants using a polyclonal antibody against full-length TPI1. Cells were cultured in 0.5 mmol/L glucose for 6 hours prior to collection.
Figure 5.
LKB1 regulates the multimeric state of hTPI1 but not mTPI1 due to an amino acid difference at position 21. A, Sequence alignment of TPI1 amino acid residues 16 to 26 across species, showing conservation of Ser21 from H. sapiens to S. cerevisiae, with cysteine at position 21 in mouse and rat TPI1. B, Crystal structure of TPI1 homodimer (cyan and green, respectively), with critical residues highlighted in space-filling atoms. Ser21 on the cyan monomer is highlighted in yellow. C, Western blot analysis of (BN-PAGE) of human isogenic clones derived from KP H358 hLUAD cell line. Cells were grown under normal (11.1 mmol/L) or low (0.5 mmol/L)-glucose conditions for 6 hours prior to collection. D, Melting curve plot from thermal profiling of unmodified and Ser21-phosphorylated TPI1. Analysis conducted in H2009 and H358 isogenic clones expressing Cas9 and a nontargeting (sgNT1.1 and sgNT1.2 or sgNT1.4 and sgNT1.6, respectively) guide RNA. Data presented are from 7 biological replicates and reported as the mean (±SEM). E, Western blot (Blue Native PAGE) of extracts from mLUAD cell lines. Cells were cultured in either 11.1 mmol/L or 0.5 mmol/L glucose for 6 hours and then treated with 1 mmol/L H2O2 for 15 minutes. F, Western blot of proteins coimmunoprecipitated from extracts of H358 cells expressing Cas9 and a nontargeting (FH-GFP cell line) or TPI1-specific (all other cell lines) guide RNA and transgenic expression of FLAG-HA tagged GFP or guide RNA resistant TPI1 allelic variants using a polyclonal antibody against full-length TPI1. Cells were cultured in 0.5 mmol/L glucose for 6 hours prior to collection. IP, immunoprecipitation.
Figure 6. TPI1 amino acid differences at position 21 affect growth in organotypic culture, in vivo, and alter metabolic flux. A, Western blot analysis of human H358 (KRAS;TP53) isogenic KP and KPL cells (KP: sgNT1.6; KPL: sgLKB1-3.2) and derived untagged TPI1 allelic panel with phospho-specific antibody. B, 3D spheroid growth in Matrigel of isogenic clones of the H358 cell line labeled with a tdTomato fluorescent reporter and expressing Cas9- and TPI1-specific (sgTPI1-3) guide RNA and transgenic expression of guide RNA-resistant TPI1 allelic variants. 5,000 cells were seeded into Matrigel and grown for 14 days, and the media were changed every 24 hours. Images were taken on an EVOS fluorescence microscope under 4× magnification and filter to resolve tdTomato signal intensity and brightfield. C, Isotopic tracing results for M+2 isotopologue for glycerol-3-phosphate at 1 minute. Analysis conducted in H358 isogenic lines (KP: sgNT1.6; KPL: sgLKB1-3.2) with additional expression of sgTPI1 guide RNA and guide RNA-resistant TPI1 allelic variants in biological triplicate (N = 3 per genotype) and reported as the mean ((± SEM). Statistical significance was determined by a two-tailed paired t test. D, Subcutaneous tumor growth of human H358 isogenic lines (KP: sgNT1.6; KPL: sgLKB1-3.2) with additional expression of sgTPI1 guide RNA and guide RNA-resistant TPI1 allelic variants. Cells first infected with control or LKB1-targeting guide RNA to produce isogenic KP and KPL, respectively. Derived lines were then infected with lentiviruses encoding TPI1 sgRNA with a subsequent lentiviral expression of transgenic guide RNA-resistant hTPI1 WT, S21A or S21D and S21C and measured 30 days following engraftment. Injections in athymic nude mice (n = 5/group).
Figure 6.
TPI1 amino acid differences at position 21 affect growth in organotypic culture, in vivo, and alter metabolic flux. A, Western blot analysis of human H358 (KRAS;TP53) isogenic KP and KPL cells (KP: sgNT1.6; KPL: sgLKB1-3.2) and derived untagged TPI1 allelic panel with phosphospecific antibody. B, 3D spheroid growth in Matrigel of isogenic clones of the H358 cell line labeled with a tdTomato fluorescent reporter and expressing Cas9- and TPI1-specific (sgTPI1-3) guide RNA and transgenic expression of guide RNA resistant TPI1 allelic variants. 5,000 cells were seeded into Matrigel and grown for 14 days, and the media were changed every 24 hours. Images were taken on an EVOS fluorescence microscope under 4× magnification and filter to resolve tdTomato signal intensity and brightfield. C, Isotopic tracing results for M+2 isotopologue for G3P at 1 minute. Analysis conducted in H358 isogenic lines (KP: sgNT1.6; KPL: sgLKB1-3.2) with additional expression of sgTPI1 guide RNA and guide RNA resistant TPI1 allelic variants in biological triplicate (n = 3 per genotype) and reported as the mean (± SEM). Statistical significance was determined by a two-tailed paired t test. ns, not significant. D, Subcutaneous tumor growth of human H358 isogenic lines (KP: sgNT1.6; KPL: sgLKB1-3.2) with additional expression of sgTPI1 guide RNA and guide RNA resistant TPI1 allelic variants. Cells were first infected with control or LKB1-targeting guide RNA to produce isogenic KP and KPL, respectively. Derived lines were then infected with lentiviruses encoding TPI1 single-guide RNA with a subsequent lentiviral expression of transgenic guide RNA resistant hTPI1 WT, S21A, S21D, or S21C and measured 30 days following engraftment. Injections in athymic nude mice (n = 5/group).
Figure 7. Tpi1 is required for tumor growth in KP and KPL LUAD models, and humanizing TPi1 regresses tumor growth and burden. A, Cartoon schematic depicting generated conditional genetic mouse models and subsequent derived tumor-derived cell lines. B, C57Bl/6J mice survival following tail-vein injection of the KPCas9 cell line (BS7341) infected with lentiviruses encoding control or targeting sgRNAs (n = 5/group). C, Subcutaneous tumor growth of KP or KPL-derived tumor cell lines (BS7432) infected with lentiviruses encoding control or targeting sgRNAs 30 days following engraftment in C57Bl/6J mice (n = 5/group); paired t test provided above. D, Histogram quantifying tumor lesions per lobe in tail-vein injected KPcas9 (BS7431) Tpi1 allelic variants in C57Bl/6J mice (N = 5/group) and reported as the mean ((± SEM). Statistical significance was determined by a two-tailed paired t test. E, Histogram quantifying tumor lesion diameter in tail-vein–injected KPcas9 (BS7431) Tpi1 allelic variants in C57Bl/6J mice (N = 5/group) and reported as the mean ((± SEM). Statistical significance was determined by a two-tailed paired t test. F, Subcutaneous tumor growth of KPCas9-derived tumor cell line (BS7432) first infected with control or Lkb1-targeting guide RNA to produce isogenic KP and KPL, respectively. Derived lines were then infected with lentiviruses encoding Tpi1 sgRNA with subsequent lentiviral expression of transgenic guide RNA-resistant mTpi1 WT, C21A, or C21S and measured 30 days following engraftment. Paired flank injections in C57Bl/6J mice were conducted (KP/KPL for each transgene) per mouse (n = 5/group). G, KLCas9v2 autochthonous tumor model survival following intratracheal administration of lentiviruses encoding cre-recombinase and control (sgNT) or targeting (sgTpi1) sgRNAs (n = 12/group). Representative lung tumor burden in groups of mice at 8 weeks (sgNT and sgTpi1) and 14.5 weeks (sgTpi1) following intubation; histologic appearance of tumor lesions.
Figure 7.
TPI1 is required for tumor growth in KP and KPL LUAD models, and humanizing TPI1 regresses tumor growth and burden. A, Cartoon schematic depicting generated conditional genetic mouse models and subsequent derived tumor-derived cell lines. B, C57Bl/6J mouse survival following tail-vein injection of the KPCas9 cell line (BS7341) infected with lentiviruses encoding control or targeting sgRNAs (n = 5/group). C, Subcutaneous tumor growth of KP- or KPL-derived tumor cell lines (BS7432) infected with lentiviruses encoding control or targeting sgRNAs 30 days following engraftment in C57Bl/6J mice (n = 5/group); paired t test provided. D, Histogram quantifying tumor lesions per lobe in tail-vein-injected KPCas9 (BS7431) Tpi1 allelic variants in C57Bl/6J mice (n = 5/group) and reported as the mean (± SEM). Statistical significance was determined by a two-tailed paired t test. ns, not significant. E, Histogram quantifying tumor lesion diameter in tail-vein-injected KPCas9 (BS7431) Tpi1 allelic variants in C57Bl/6J mice (n = 5/group) and reported as the mean (± SEM). Statistical significance was determined by a two-tailed paired t test. F, Subcutaneous tumor growth of KPCas9-derived tumor cell line (BS7432) first infected with control or Lkb1-targeting guide RNA to produce isogenic KP and KPL, respectively. Derived lines were then infected with lentiviruses encoding Tpi1 sgRNA with subsequent lentiviral expression of transgenic guide RNA resistant mTpi1 WT, C21A, or C21S and measured 30 days following engraftment. Paired flank injections in C57Bl/6J mice were conducted (KP/KPL for each transgene) per mouse (n = 5/group). G, KLCas9v2 autochthonous tumor model survival following intratracheal administration of lentiviruses encoding Cre-recombinase and control (sgNT) or targeting (sgTpi1) sgRNAs (n = 12/group). Representative lung tumor burden in groups of mice at 8 weeks (sgNT and sgTpi1) and 14.5 weeks (sgTpi1) following intubation; histologic appearance of tumor lesions.

Comment in

  • 2159-8274. doi: 10.1158/2159-8290.CD-13-4-ITI

References

    1. Siegel RL, Miller KD, Jemal A. Cancer statistics, 2020. CA Cancer J Clin 2020;70:7–30. - PubMed
    1. Skoulidis F, Heymach JV. Co-occurring genomic alterations in non-small-cell lung cancer biology and therapy. Nat Rev Cancer 2019;19:495–509. - PMC - PubMed
    1. Rudin CM, Poirier JT, Byers LA, Dive C, Dowlati A, George J, et al. . Molecular subtypes of small cell lung cancer: a synthesis of human and mouse model data. Nat Rev Cancer 2019;19:289–97. - PMC - PubMed
    1. Herbst RS, Heymach JV, Lippman SM. Lung cancer. N Engl J Med 2008;359:1367–80. - PMC - PubMed
    1. Ding L, Getz G, Wheeler DA, Mardis ER, McLellan MD, Cibulskis K, et al. . Somatic mutations affect key pathways in lung adenocarcinoma. Nature 2008;455:1069–75. - PMC - PubMed

Publication types

MeSH terms

Substances