. 2023 Apr 3;13(4):928-949.
doi: 10.1158/2159-8290.CD-22-0796.

Extrachromosomal DNA Amplification Contributes to Small Cell Lung Cancer Heterogeneity and Is Associated with Worse Outcomes

Affiliations

Extrachromosomal DNA Amplification Contributes to Small Cell Lung Cancer Heterogeneity and Is Associated with Worse Outcomes

Lőrinc Sándor Pongor et al. Cancer Discov. .

Abstract

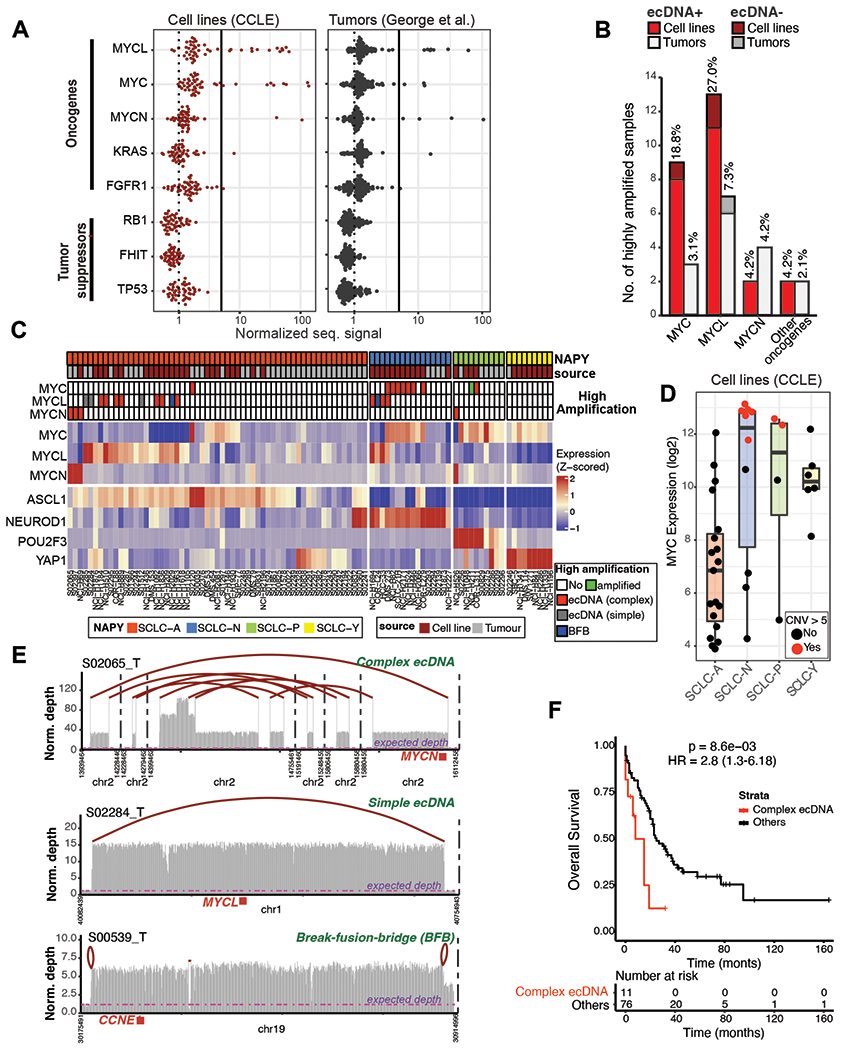
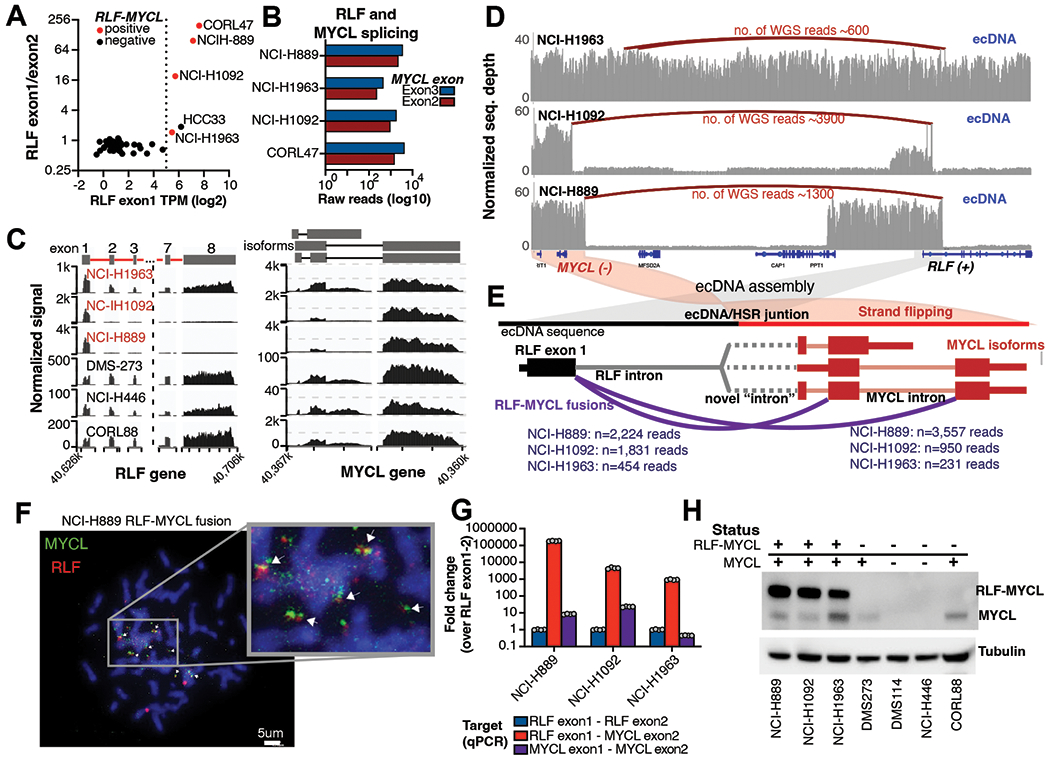
Small-cell lung cancer (SCLC) is an aggressive neuroendocrine lung cancer. Oncogenic MYC amplifications drive SCLC heterogeneity, but the genetic mechanisms of MYC amplification and phenotypic plasticity, characterized by neuroendocrine and nonneuroendocrine cell states, are not known. Here, we integrate whole-genome sequencing, long-range optical mapping, single-cell DNA sequencing, and fluorescence in situ hybridization to find extrachromosomal DNA (ecDNA) as a primary source of SCLC oncogene amplifications and driver fusions. ecDNAs bring to proximity enhancer elements and oncogenes, creating SCLC transcription-amplifying units, driving exceptionally high MYC gene dosage. We demonstrate that cell-free nucleosome profiling can noninvasively detect ecDNA amplifications in plasma, facilitating its genome-wide interrogation in SCLC and other cancers. Altogether, our work provides the first comprehensive map of SCLC ecDNA and describes a new mechanism that governs MYC-driven SCLC heterogeneity. ecDNA-enabled transcriptional flexibility may explain the significantly worse survival outcomes of SCLC harboring complex ecDNA amplifications.

Significance: MYC drives SCLC progression, but the genetic basis of MYC-driven SCLC evolution is unknown. Using SCLC as a paradigm, we report how ecDNA amplifications function as MYC-amplifying units, fostering tumor plasticity and a high degree of tumor heterogeneity. This article is highlighted in the In This Issue feature, p. 799.


Conflict of interest statement

A. Thomas reports grants to the institution from EMD Serono, Astra Zeneca, Immunomedics, Prolynx, Immunomedics, and Tarveda during the conduct of the study.

Figures

Figure 1.
Figure 1.. Gene amplification landscape and transcriptional subtypes of SCLC.
A) Normalized sequencing depth quantified from whole-genome sequencing of highly amplified oncogenes and tumor suppressor genes in SCLC cell lines (left panel) and tumors (right panel). B) Number of samples with high amplification (>5 normalized signal) of MYC and other oncogenes in cell lines (red) and tumors (grey). Fraction of samples in each cohort is shown on top of the bars. ecDNA positive cases are shaded with light red and light grey for cell lines and tumor samples, respectively. C) Expression heatmap of MYC genes and lineage-specific transcription factors differentiating SCLC subtypes. Top bars denote subtypes and sample source (tumor or cell line). Second panel shows samples with high MYC/MYCL/MYCN amplification and classification based on AmpliconArchitect defined as complex ecDNA (red), simple ecDNA (grey), break-fusion-bridge (BFB, blue), highly amplified (green) and no high amplification (white) categories. Lower panel shows the expression patterns of SCLC subtype differentiating genes. D) Expression of MYC in the 4 main SCLC subtypes with focal MYC amplification (red dots) or no focal amplification (black dots). E) Distinct rearrangement patterns at oncogenes in SCLC tumors. Top panel demonstrates a complex ecDNA, with multiple focal amplifications connected at break sites marked with red arches. Expected diploid levels of sequencing depths are marked by purple lines. The MYCN oncogene position is marked with a red box. Middle panel demonstrates a simple ecDNA pattern, where the two break sites of a single focal amplification are assembled. Lower panel demonstrates a genome integrated break-fusion-bridge, where distinct break sites are not connected together, but loop back based on sequencing data. F) Kaplan-Meier plot showing survival differences between patients with or without complex rearrangements in SCLC.
Figure 2.
Figure 2.. ecDNAs in SCLC and their epigenetic regulation.
A) Assembly of ecDNA from whole-genome sequencing of SCLC cell lines NCI-H889 and NCI-H524. Sequencing coverage is shown with grey bars, assembled segments are connected with red arches. The validated assembly (arch) is highlighted in blue for the two cell lines. B) Assembly of ecDNA structure using long read optical mapping. Blue segments represent the reads, the orange segments represent the genome used for mapping, and the light-blue and dark blue segments represent the assembled ecDNA sequence for NCI-H889 and NCI-H524, respectively. C) FISH validation of ecDNA using MYCL probes (green) in NCI-H889 and MYC probes (light blue) in NCI-H524. DMS-114 showed chromosomal amplification of MYC (light blue). D-E) Enhancer interaction landscape in NCI-H889 (D) and NCI-H524 (E). The upper track shows the normalized interaction heatmap derived from Hi-ChIP, with oncogenic enhancer interactions highlighted in blue circles (proximal) and green oval (distal). Sequencing coverage tracks are shown for H3K27ac HiChIP (purple), H3K27ac ChIP-seq (blue), ATAC-seq (yellow, only for NCI-H524) and genome sequencing (dark grey). F) Comparison of interaction strengths of enhancers within the ecDNA, at housekeeping genes (GAPDH, B2M, TOP2A, ACTB and PGK1), and SCLC genes (ASCL1, NEUROD1, INSM1, SYP, NOTCH1, REST and YAP1) and their proximal enhancers.
Figure 3.
Figure 3.. Hijacking the promoter of RLF through the RLF-MYCL fusion.
A) Gene expression analysis of RLF exon 1 and RLF exon1/exon2 ratios identifies 5 cells with elevated RLF exon 1 expression. Cell lines marked in red are positive for RLF-MYCL fusion. B) Summary of read counts that splice from RLF exon 1 to either MYCL exon 2 (red) or MYCL exon 3 (blue) based on RNA-seq data. C) Differential RLF and MYCL exon expression in three fusion-positive (red cell lines) and three fusion-negative cell lines. D) Rearrangement patterns at the RLF-MYCL locus in three fusion-positive cell lines. NCI-H1963 has rearrangements within the ecDNA sequence. NCI-H1092 and NCI-H889 both have amplifications at the RLF exon 1 that rearranges upstream of MYCL. E) RLF-MYCL fusion representation based on rearrangements on ecDNA. Number of supporting reads are shown in purple. F) Validation of the RLF-MYCL fusion using FISH. The RLF probe is colored in red, the MYCL probe in green. G) Validation of the RLF-MYCL fusion RNA using qPCR. H) The RLF-MYCL is translated to protein identified using western blot. Cell lines expressing RLF-MYCL (based on qPCR) and MYCL (based on RNA-seq) are marked with “+” on top of the graph, negative cells are marked as “-”.
Figure 4.
Figure 4.. Heterogeneity of SCLC and ecDNA.
A) Identification of MYC and MYCL positive ecDNA in the DMS-273 cell line using FISH. B) Assembly of MYC and MYCL ecDNAs in DMS-273 from whole-genome sequencing data. Grey bars show normalized sequencing depth, red arches represent assembly paths. C) Single-cell copy-number analysis of targeted amplicons shows differential levels of MYC and MYCL copy numbers based on normalized read depths. The heatmap shows normalized sequencing depths for 5 amplicons covering MYCL and 6 amplicons covering MYC in 2k cells. D) Enhancer-enhancer interaction analysis using HiChIP data reveals little to no interaction between the MYC and MYCL ecDNAs (blue box) in the DMS-273 cell line. E) Selection of suspension (NCI-H524S) and adherent (NCI-H524A) cells from the parental NCI-H524 cell line. F) Microscope images of suspension and adherent NCI-H524 cells. G) Western blot of MYC, NE, and non-NE genes shows non-NE differentiation in adherent NCI-H524 cell line compared to the suspension counterpart. H) MYC FISH analysis identified ecDNA in both suspension and adherent NCI-H524 cells. Quantification of MYC positive ecDNA foci is summarized below. Statistical comparison was performed using the Wilcoxon rank sum test. I) Differential amplification landscape at the MYCL locus in the adherent and suspension NCI-H524 cells. Top track shows H3K27ac HiChIP signal for the parental cell line. Lower tracks show the genomic DNA sequencing for the suspension (H524S) and adherent (H524A) cell. J) The PVT1 promoter adjacent to MYC in the parental and suspension cells is lost from the ecDNA population of adherent H524A cells. Top track shows the H3K27ac HiChIP signal from the parental NCI-H524 cell line. Lower tracks show the genomic DNA sequencing for the suspension (H524S) and adherent (H524A) cells, respectively.
Figure5.
Figure5.. Identification of ecDNA using cell-free ChIP-seq and ecDNA heterogeneity across metastatic sites.
A) Overview of cfChIP-seq experiment and establishment of patient derived cell lines from metastatic sites. B) Examples of ecDNA-like focal amplifications are detectable using cell-free ChIP-seq from patient plasma samples, validated with tumor genome sequencing. C) Comparison of normalized sequencing depth of cell lines and tumor sample (top) and ecDNA assembly, and H3K4me3 signal derived from the cfChIP-seq from plasma samples. Top track shows normalized sequencing depths of all cell lines and tumor WGS samples, with assembly arches shown in purple. Middle track shows H3K4me3 cfChIP signal from the patient. Lower track shows the background sequencing depth from the cfChIP-seq sample. D) Differential copy-number validation of the MYC locus in the cell lines. E) Differential ecDNA and HSR status in the cell lines identified by FISH probing of MYC gene. F) Number of ecDNA or HSR positive cells in the patient derived cell lines. Scale bars in the lower right corner represent 5 μm. G) MYC copy-number analysis using single-cell copy-number analysis demonstrated higher MYC copy-number heterogeneity in the ecDNA positive cell line compared to the HSR positive cell line. H) Enhancer-enhancer interactions at the MYC-PVT1 locus. Highest interactions were observed in the lung tumor-derived cell line. I) Quantified enhancer signal at the MYC and PVT1 promoters. J) Differential ASCL1, NEUROD1 protein expression levels between the ecDNA positive and HSR positive cells.
Figure 6.
Figure 6.
Summary of the study.

References

    1. George J, Lim JS, Jang SJ, Cun Y, Ozretic L, Kong G, et al. Comprehensive genomic profiles of small cell lung cancer. Nature. 2015;524(7563):47–53. - PMC - PubMed
    1. Lissa D, Takahashi N, Desai P, Manukyan I, Schultz CW, Rajapakse V, et al. Heterogeneity of neuroendocrine transcriptional states in metastatic small cell lung cancers and patient-derived models. Nat Commun. 2022;13(1):2023. - PMC - PubMed
    1. Gazdar AF, Carney DN, Nau MM, Minna JD. Characterization of Variant Subclasses of Cell-Lines Derived from Small Cell Lung-Cancer Having Distinctive Biochemical, Morphological, and Growth-Properties. Cancer Res. 1985;45(6):2924–30. - PubMed
    1. Zhang W, Girard L, Zhang YA, Haruki T, Papari-Zareei M, Stastny V, et al. Small cell lung cancer tumors and preclinical models display heterogeneity of neuroendocrine phenotypes. Transl Lung Cancer R. 2018;7(1):32-+. - PMC - PubMed
    1. Calbo J, van Montfort E, Proost N, van Drunen E, Beverloo HB, Meuwissen R, et al. A Functional Role for Tumor Cell Heterogeneity in a Mouse Model of Small Cell Lung Cancer. Cancer Cell. 2011;19(2):244–56. - PubMed

Publication types