. 2023 Jun 13;119(6):1390-1402.
doi: 10.1093/cvr/cvad023.

Heart-gut microbiota communication determines the severity of cardiac injury after myocardial ischaemia/reperfusion

Affiliations

Heart-gut microbiota communication determines the severity of cardiac injury after myocardial ischaemia/reperfusion

Jinxuan Zhao et al. Cardiovasc Res. .

Abstract

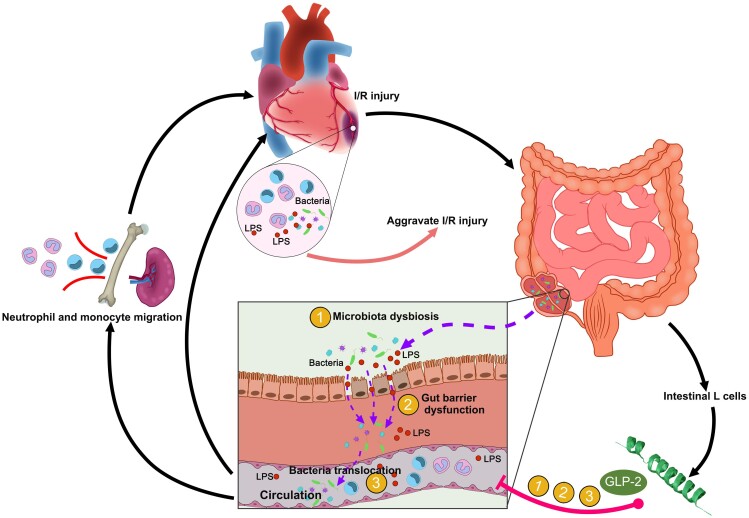
Aims: Recent studies have suggested a key role of intestinal microbiota in pathological progress of multiple organs via immune modulation. However, the interactions between heart and gut microbiota remain to be fully elucidated. The aim of the study is to investigate the role of gut microbiota in the post-ischaemia/reperfusion (I/R) inflammatory microenvironment.

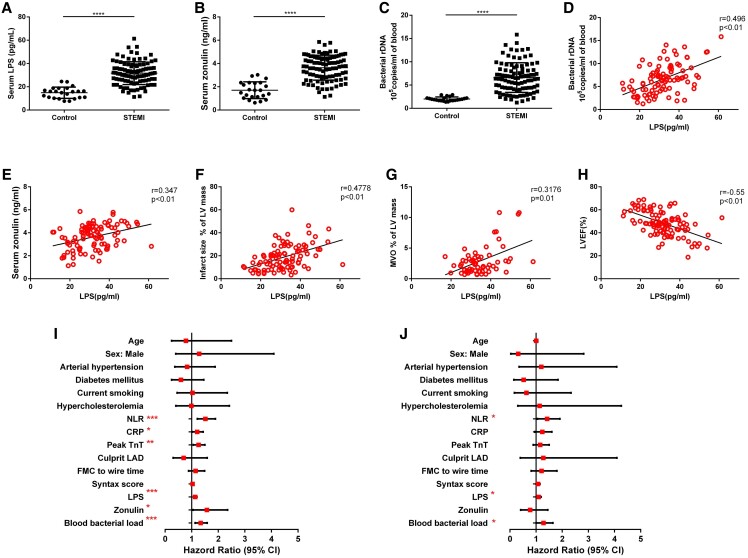
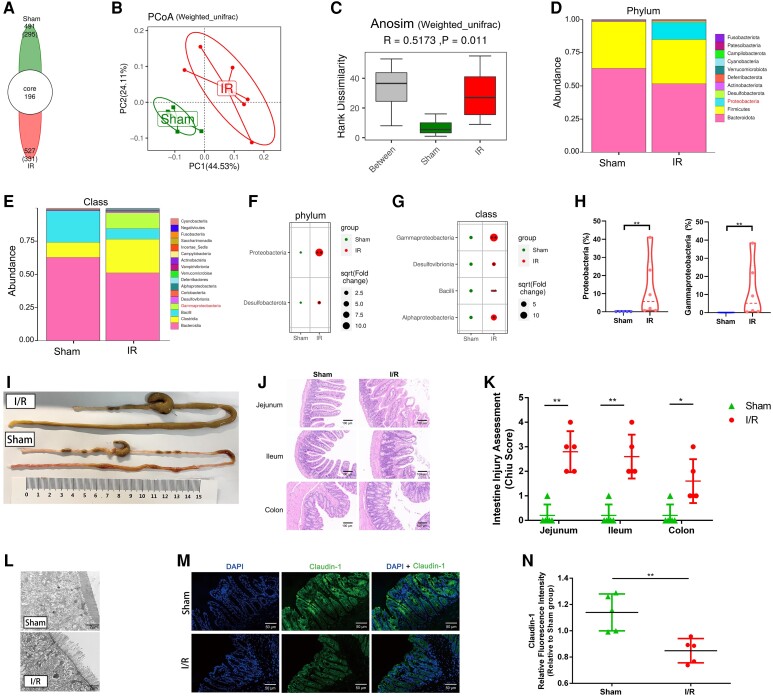
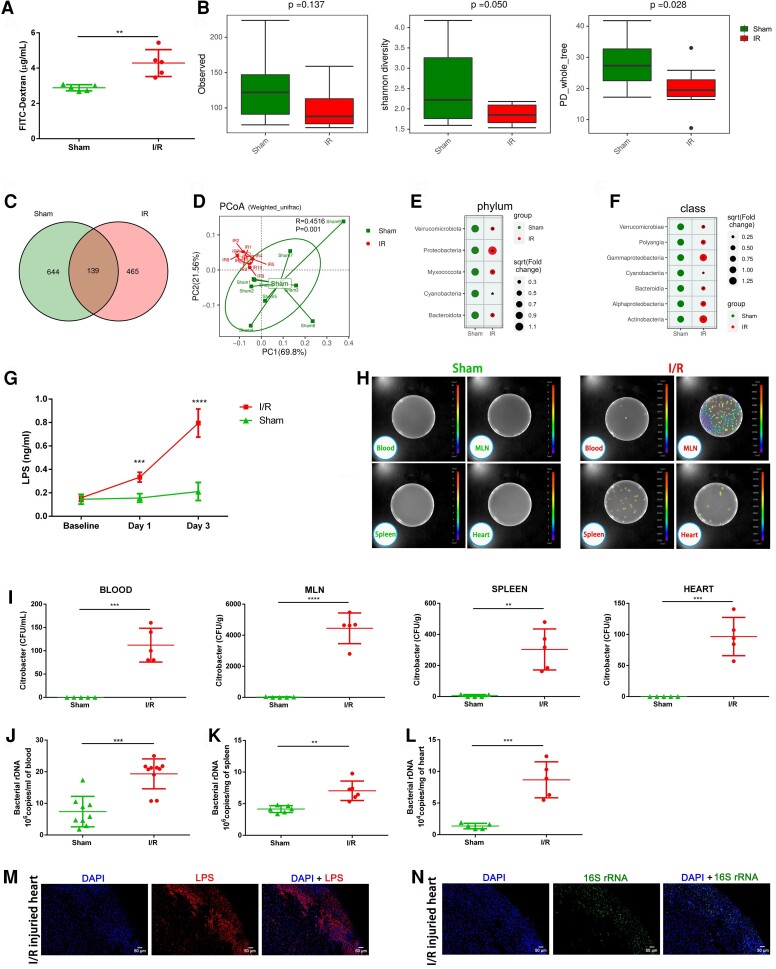
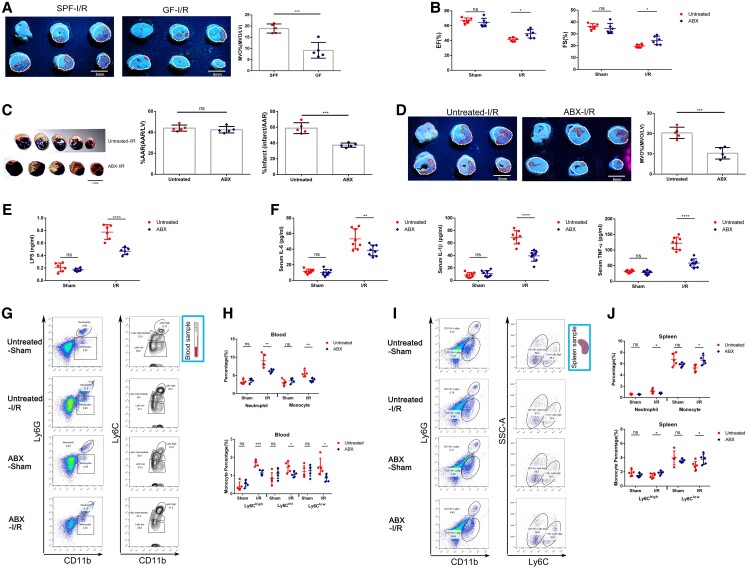
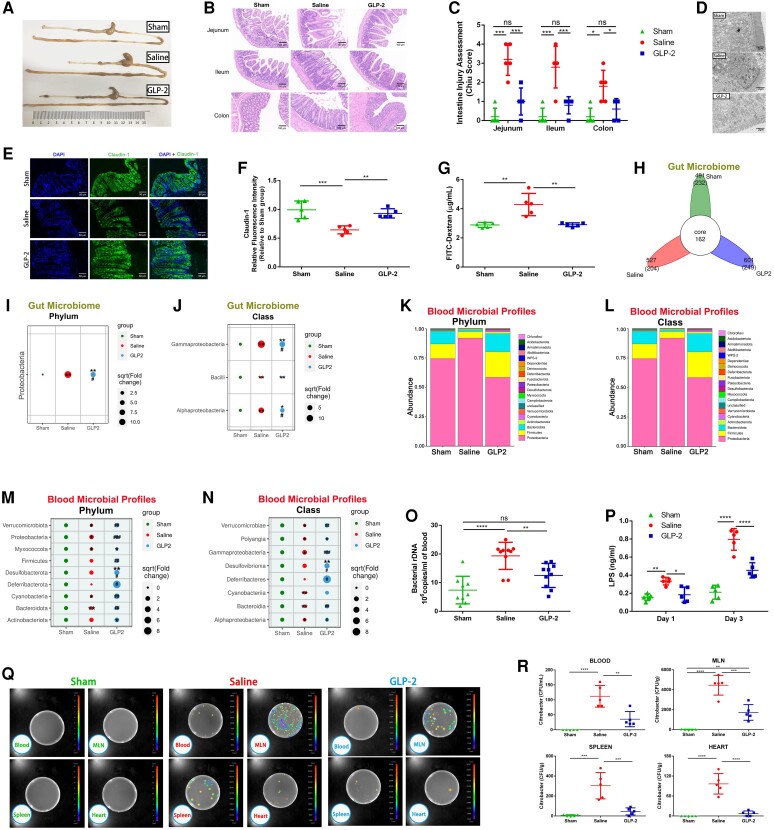
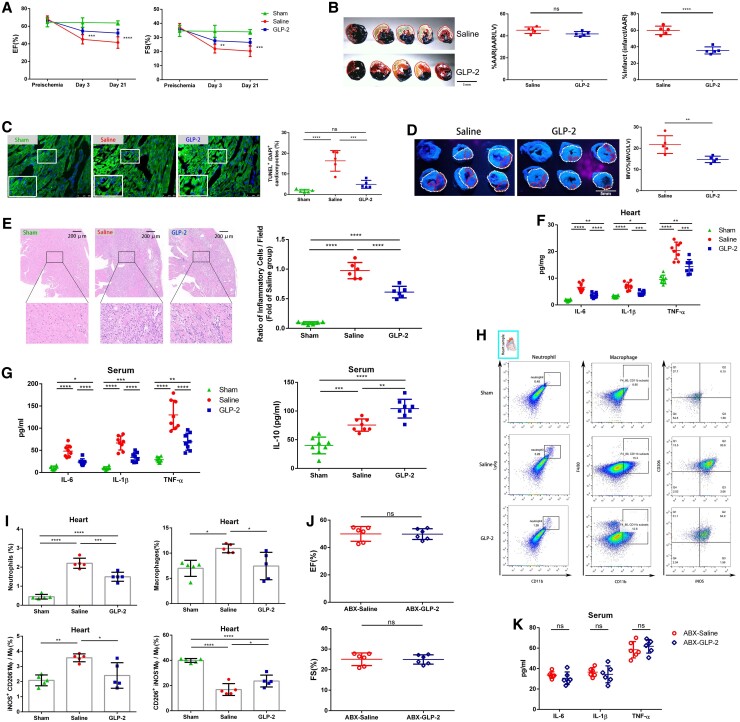
Methods and results: Here, we conducted a case-control study to explore the association of gut bacteria translocation products with inflammation biomarkers and I/R injury severity in ST-elevation myocardial infarction patients. Then, we used a mouse model to determine the effects of myocardial I/R injury on gut microbiota dysbiosis and translocation. Blooming of Proteobacteria was identified as a hallmark of post-I/R dysbiosis, which was associated with gut bacteria translocation. Abrogation of gut bacteria translocation by antibiotic cocktail alleviated myocardial I/R injury via mitigating excessive inflammation and attenuating myeloid cells mobilization, indicating the bidirectional heart-gut-microbiome-immune axis in myocardial I/R injury. Glucagon-like peptide 2 (GLP-2), an endocrine peptide produced by intestinal L-cells, was used in the experimental myocardial I/R model. GLP-2 administration restored gut microbiota disorder and prevented bacteria translocation, eventually attenuated myocardial I/R injury through alleviating systemic inflammation.

Conclusion: Our work identifies a bidirectional communication along the heart-gut-microbiome-immune axis in myocardial I/R injury and demonstrates gut bacteria translocation as a key regulator in amplifying inflammatory injury. Furthermore, our study sheds new light on the application of GLP-2 as a promising therapy targeting gut bacteria translocation in myocardial I/R injury.

Keywords: Bacteria translocation; Glucagon-like peptide 2; Gut microbiota dysbiosis; Inflammation; Myocardial ischaemia/reperfusion injury.


Conflict of interest statement

Conflict of interest: None declared.

Figures

Graphical Abstract
Graphical Abstract
Schematic diagram showing the role of the heart–gut–microbiome–immune axis in myocardial I/R injury. Application of glucagon-like peptide 2 targeting heart–intestine axis might be a potential strategy to alleviate I/R injury.
Figure 1
Figure 1
Increased levels of gut bacterial translocation products are associated with MVO and LV function in patients with STEMI. (A) Serum LPS, (B) serum zonulin, and (C) blood bacterial DNA load in control subjects (n = 23) and STEMI patients (n = 97). Correlation between serum LPS and blood bacterial DNA load (D), zonulin (E) in the peripheral blood of patients with STEMI (n = 97). (F) Correlation between serum LPS and infarct size in patients with STEMI (n = 97). (G) Correlation between serum LPS and MVO size in STEMI patients with MVO (n = 60). (H) Correlation between serum LPS and left ventricular ejection fraction (LVEF%) in patients with STEMI (n = 97). (I) Univariate logistic regression analysis of the risk factors for the presence of MVO in STEMI patients. (J) Multivariate logistic regression of the risk factors for the presence of MVO in STEMI patients. Values are mean ± standard deviation (SD). Statistical significance was determined using Student’s t-test for the two group comparison and the Spearman test or Pearson test for correlation analysis. *P < 0.05, **P < 0.01, ***P < 0.001, ****P < 0.0001.
Figure 2
Figure 2
Myocardial I/R injured mice exhibit rapid gut microbiota dysbiosis and intestinal mucosal injury. (A) The number of common and unique Amplicon Sequence Variants (ASVs) in colon contents of sham (n = 5) and I/R mice (n = 6) 3 days after the operation. (B) PCoA of the intestinal microbiome based on weighted UniFrac distance separate the I/R group (n = 6) from the sham group (n = 5). (C) Anosim similarity analysis based on weighted UniFrac distance rarefaction curves of each sample. Gut microbial composition at the phylum level (D) and class level (E) between sham (n = 5) and I/R groups (n = 6). Bubble chart distributing significantly different taxa at the phylum level (F) and class level (G) between sham (n = 5) and I/R groups (n = 6). (H) Relative abundance of Proteobacteria in the gut microbiome and proportion of subordinate Gammaproteobacteria in Proteobacteria phylum between sham (n = 5) and I/R groups (n = 6). (I) Gross morphology of the gastrointestinal tract from sham-operated mice and I/R injured mice 3 days after the operation. (J) Representative images of intestine Hematoxylin and Eosin (HE) staining of sham and I/R mice 3 days after the operation. (K) Intestine injury assessment of intestine HE staining in (J) presented as Chiu scores (n = 5). (L) Representative transmission electron microscope image of sections from the intestinal epithelium of sham and I/R mice. Scale bar = 2 μm. (M) Representative immunofluorescence images of claudin-1 in the intestine of sham and I/R mice 3 days after the operation. Scale bar = 50 μm. (N) Quantification of fluorescence intensity in (M) (n = 5). Values are mean ± SD. Statistical significance was determined using Student’s t-test or Mann–Whitney U test for the two group comparison. *P < 0.05, **P < 0.01, ***P < 0.001.
Figure 3
Figure 3
Increase in intestinal permeability upon myocardial I/R injury leads to gut microbiota translocation with an elevated level of LPS in circulation. (A) Intestinal permeability was measured by measuring plasma FITC-dextran level after oral administration of FITC-dextran on Day 3 after the operation (n = 5). (B) Comparative analyses of blood microbial α-diversity estimated by Sobs, Shannon’s diversity, and phylogenetic diversity (PD) between sham (n = 9) and I/R groups (n = 10). (C) The number of common and unique ASVs in the circulation of sham (n = 9) and I/R mice (n = 10) 3 days after the operation. (D) PcoA of blood microbial profiles based on weighted UniFrac analysis between sham (n = 9) and I/R groups (n = 10). Bubble chart distributing significantly different taxa of blood microbial profiles at the phylum level (E) and class level (F) between sham (n = 9) and I/R groups (n = 10). (G) Serum LPS concentration on Day 1 and Day 3 following the operation (n = 5). (H) Bacterial colony forming units (CFUs) of sample homogenates obtained from various tissues of sham and I/R mice were visualized under an in vivo imaging system after oral gavage of Bioluminescent C. rodentium on Day 3 after the operation. (I) Quantification of CFU counts in (H) (n = 5). (J) Quantification of blood bacterial load per millilitre based on 16S rDNA content collected from sham (n = 9) and I/R (n = 10) mice 3 days following the operation. (K) Quantification of bacterial load per milligram within spleen tissues 3 days following the operation (n = 6). (L) Quantification of bacterial load per milligram within heart samples collected from sham and I/R mice 3 days after the operation (n = 5). Consecutive slices from I/R injured hearts were stained with anti-LPS antibody (M) or with FISH probes against bacterial 16S rRNA (N). Scale bar = 50 μm. Values are mean ± SD. Statistical significance was determined using Student’s t-test or Mann–Whitney U test for the two group comparison. *P < 0.05, **P < 0.01, ***P < 0.001, ****P < 0.0001.
Figure 4
Figure 4
Pre-depletion of gut microbiota ameliorates myocardial I/R injury and systemic inflammation in mice. (A) Representative thioflavin-S stained images showing MVO regions indicated by the absence of thioflavin-S fluorescence and quantification of MVO percentage in hearts collected from GF and specific pathogen-free (SPF) mice 1 day following myocardial I/R injury (n = 5). Left ventricular area (LV; white dotted line) and MVO size (MVO; red dotted line). Scale bar = 5 mm. (B) ejection fraction (EF%) and fractional shortening (FS%) of a mixture of antibiotics (ABX) treated and untreated mice measured by echocardiography 3 days following myocardial I/R injury (n = 6). (C) Representative images of Evans Blue and TTC-stained hearts and quantification of the percentage Area at risk (AAR) and percentage infarct in ABX and untreated mice 3 days after myocardial I/R injury (n = 5). AAR (red line) and infarct size (IS; white dotted line). Scale bar = 5 mm. (D) Representative thioflavin-S stained images and quantification of MVO percentage in hearts isolated from ABX and untreated mice 1 day following myocardial I/R injury (n = 5). Left ventricular area (LV; white dotted line) and MVO size (MVO; red dotted line). Scale bar = 5 mm. (E) The serum level of LPS in ABX and untreated mice 3 days after myocardial I/R injury (n = 6). (F) Serum IL-6, IL-1β, and TNF-α levels of ABX and untreated mice 3 days after the operation (n = 8). (G) Representative flow cytometry plots showing the gating strategy used to determine total neutrophils (CD11b + Ly6G+), total monocytes (CD11b + Ly6GLy6C+), Ly6Chigh monocytes (CD11b + Ly6GLy6Chigh), Ly6Cint monocytes (CD11b + Ly6GLy6Cintermediate), and Ly6Clow monocytes (CD11b + Ly6GLy6Clow) in peripheral blood 3 days following the operation. (H) Quantification of total neutrophils, total monocytes, Ly6Chigh monocytes, Ly6Cint monocytes, and Ly6Clow monocytes in the peripheral blood of ABX and untreated mice 3 days following myocardial I/R injury (n = 5). (I) The ratio of total neutrophils, total monocytes, Ly6Chigh monocytes, and Ly6Clow monocytes was analysed by fluorescence-activated cell sorter in spleen of ABX and untreated mice at 3 days post-operation. (J) Pooled flow cytometry data from (I) (n = 5–6). Values are mean ± SD. Statistical significance was determined using Student’s t-test for the two group comparison or two-way ANOVA followed by Bonferroni’s multiple comparisons test for comparison between different groups. *P < 0.05, **P < 0.01, ***P < 0.001, ****P < 0.0001, ns = not significant.
Figure 5
Figure 5
GLP-2 ameliorates gut microbiota disorder, suppresses gut barrier dysfunction, and prevents microbiota translocation following myocardial I/R injury. (A) Gross morphology of the gastrointestinal tract from mice 3 days following treatment with saline or GLP-2 3 days after the operation. (B) Representative images of intestine HE staining of mice sacrificed 3 days after myocardial I/R injury. (C) Intestine injury assessment of intestine HE staining in (B) presented as Chiu scores (n = 5). (D) Representative image of intestinal epithelium structure of sham-operated, saline-treated, or GLP-2-treated mice detected by transmission electron microscope. Scale bar = 2 μm. (E) Representative immunofluorescence images of claudin-1 in the intestine of mice 3 days after the operation. Scale bar = 50 μm. (F) Quantification of fluorescence intensity in (E) (n = 5). (G) Intestinal permeability was measured by detecting plasma FITC-dextran level after oral administration of FITC-dextran on Day 3 of myocardial I/R injury (n = 5). (H) The number of common and unique ASVs in colon contents of mice 3 days post-I/R (n = 5–6). Bubble chart distributing significantly different taxa of gut microbiome at the phylum level (I) and class level (J) among groups (n = 5–6). Blood microbial composition at the phylum level (K) and class level (L) among sham-operated (n = 9), saline-treated (n = 10), and GLP-2-treated (n = 10) groups. Bubble chart distributing significantly different taxa of blood microbial profiles at the phylum level (M) and class level (N) among groups. (O) Quantification of blood bacterial load per millilitre based on 16S rDNA content 3 days following the operation (n = 9–10). (P) Concentration of LPS in serum on Day 1 and Day 3 of myocardial I/R injury (n = 5). (Q) Bacterial CFUs of sample homogenates isolated from various tissues of sham-operated, saline-treated, and GLP-2-treated mice were visualized under an in vivo imaging system after oral gavage of Bioluminescent C. rodentium on Day 3 after the operation. (R) Quantification of CFU counts in (Q) (n = 5). Values are mean ± SD. Statistical significance was determined using one-way ANOVA followed by Tukey’s multiple comparisons test for multiple group comparisons. *P < 0.05, **P < 0.01, ***P < 0.001, ****P < 0.0001, ns = not significant. #P < 0.05, ##P < 0.01, ###P < 0.001 compared with the I/R group.
Figure 6
Figure 6
Inhibiting intestinal microbiota translocation by administrating GLP-2 attenuates myocardial I/R injury and alleviates cardiac inflammation in mice. (A) Quantitative analysis of EF% and FS% of mice treated with saline or GLP-2 measured by echocardiography 3 days and 3 weeks following myocardial I/R injury (n = 9). (B) Representative images of Evans Blue and TTC-stained hearts and quantification of the percentage AAR and percentage infarct in myocardial I/R injured mice 3 days following treatment with saline or GLP-2. AAR (red line) and infarct size (IS; white dotted line). Scale bar = 5 mm. (C) Representative images of TUNEL-stained heart tissues and quantification of the percentage of TUNEL+ cardiomyocytes within the infarct zones of saline- or GLP-2-treated mice 24 h post-I/R (n = 5). Scale bar = 100 μm. (D) Representative thioflavin-S stained images and quantification of MVO percentage in hearts isolated from saline- or GLP-2-treated mice 1 day following myocardial I/R injury (n = 5). Left ventricular area (LV; white dotted line) and MVO size (MVO; red line). Scale bar = 5 mm. (E) Representative images of HE staining and quantification of inflammatory cell infiltration (%) within the ischaemic heart of saline- and GLP-2 treated mice 3 days following the operation (n = 6). Scale bar = 200 μm. (F) Cytokine expression of IL-6, IL-1β, and TNF-α in the hearts of mice treated with saline or GLP-2 3 days post-I/R (n = 8). (G) Serum IL-6, IL-1β, TNF-α, and IL-10 levels of mice treated with saline or GLP-2 3 days after the operation (n = 8). (H) Representative flow cytometry plots for cardiac tissue in sham-operated, saline-treated, or GLP-2-treated I/R injured mice 3 days post-operation. Live cells were gated with CD11b and Ly6G positive (CD11b + Ly6G+) population to identify neutrophils, CD11b, and F4/80 positive (CD11b + F4/80+) population to identify macrophages. Macrophages were then gated into iNOS + CD206 population and iNOSCD206+ population. (I) Pooled flow cytometry data in H (n = 5). (J) EF% and FS% of ABX-saline and ABX-GLP-2 mice measured by echocardiography 3 days following myocardial I/R injury (n = 6). (K) Serum IL-6, IL-1β, and TNF-α levels of ABX-saline and ABX-GLP-2 mice 3 days after the operation (n = 6). Values are mean ± SD. Statistical significance was determined using Student’s t-test for the two group comparison (Figure 6B, D, J, and K), one-way ANOVA followed by Tukey’s multiple comparisons test for multiple group comparisons (Figure 6C, E–G, and I), and two-way ANOVA followed by Bonferroni’s multiple comparison test for comparison between different groups over time (Figure 6A). *P < 0.05, **P < 0.01, ***P < 0.001, ****P < 0.0001, ns, not significant.

References

    1. Heusch G. Myocardial ischaemia–reperfusion injury and cardioprotection in perspective. Nat Rev Cardiol 2020;17:773–789. - PubMed
    1. Bekkers SCAM, Yazdani SK, Virmani R, Waltenberger J. Microvascular obstruction: underlying pathophysiology and clinical diagnosis. J Am Coll Cardiol 2010;55:1649–1660. - PubMed
    1. Heusch G. Coronary microvascular obstruction: the new frontier in cardioprotection. Basic Res Cardiol 2019;114:45. - PubMed
    1. Gomes AC, Hoffmann C, Mota JF. The human gut microbiota: metabolism and perspective in obesity. Gut Microbes 2018;9:308–325. - PMC - PubMed
    1. Matson V, Chervin CS, Gajewski TF. Cancer and the microbiome-influence of the commensal microbiota on cancer, immune responses, and immunotherapy. Gastroenterology 2021;160:600–613. - PMC - PubMed

Publication types