. 2023 Jan 30:12:e83138.
doi: 10.7554/eLife.83138.

Differential chondrogenic differentiation between iPSC derived from healthy and OA cartilage is associated with changes in epigenetic regulation and metabolic transcriptomic signatures

Affiliations

Differential chondrogenic differentiation between iPSC derived from healthy and OA cartilage is associated with changes in epigenetic regulation and metabolic transcriptomic signatures

Nazir M Khan et al. Elife. .

Abstract

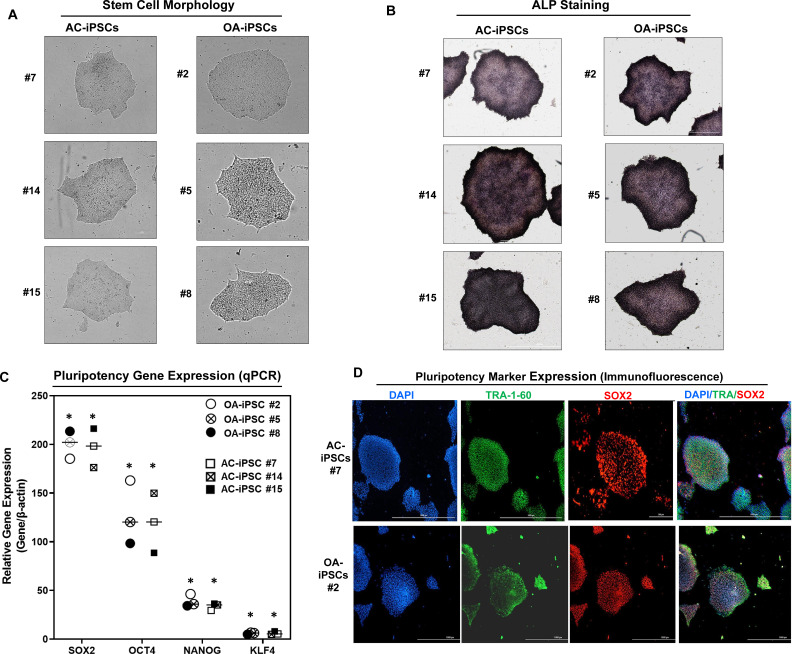
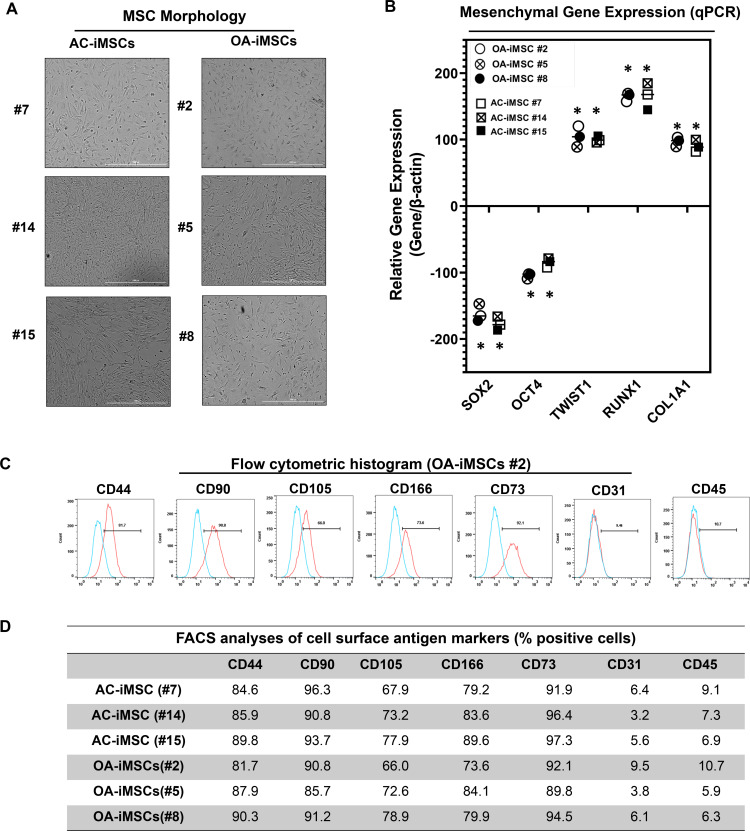
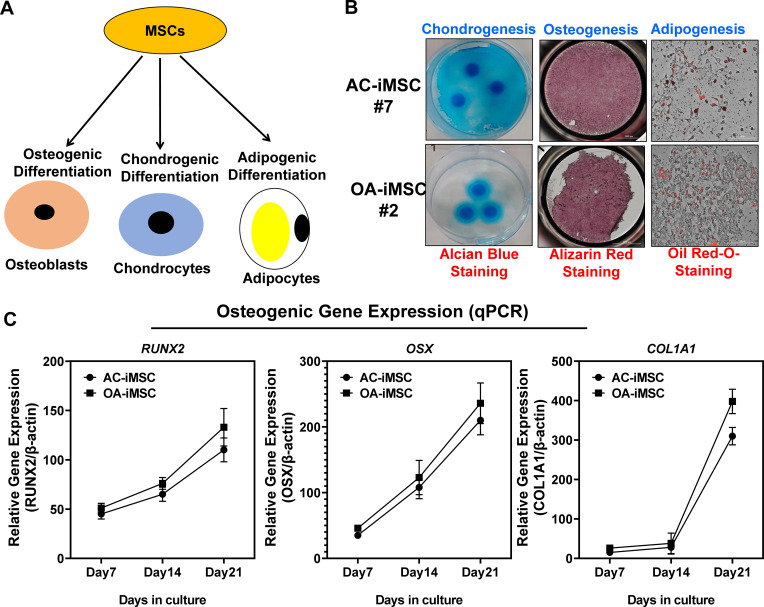
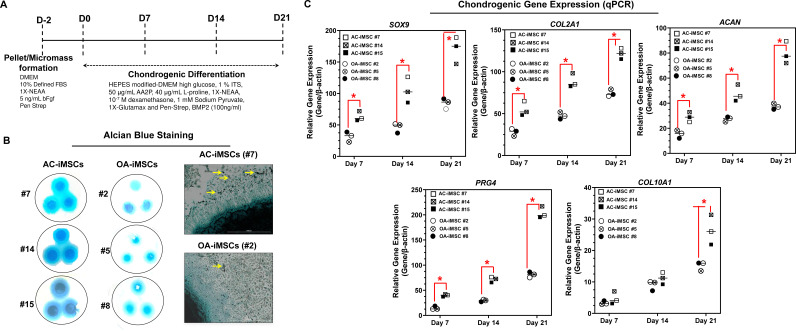
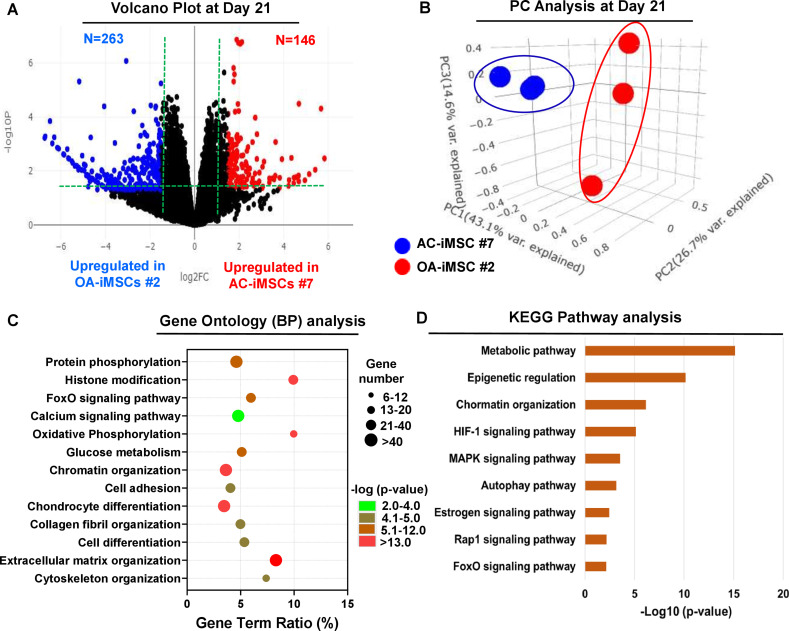
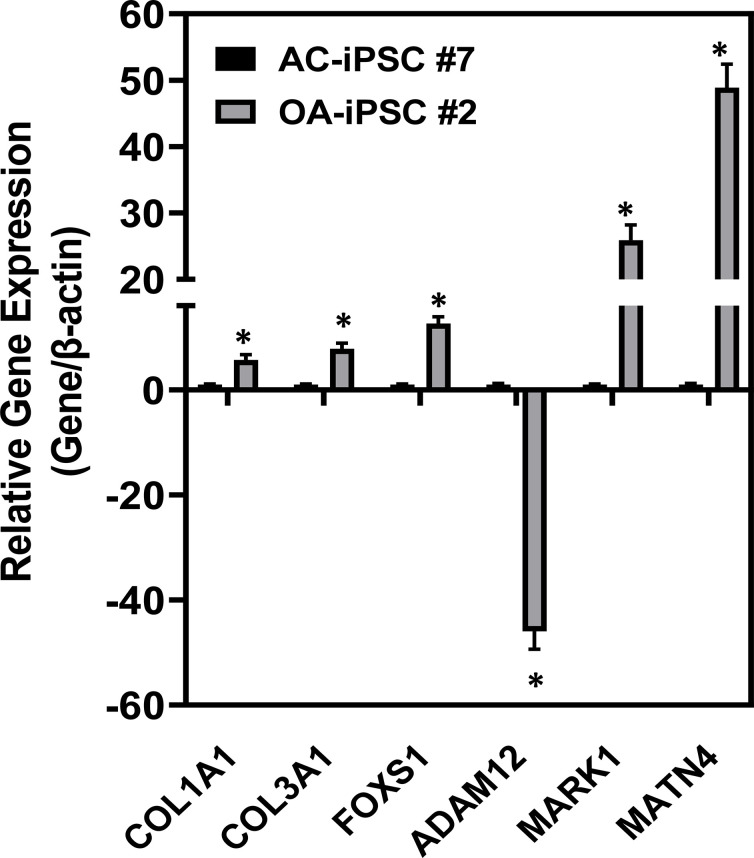
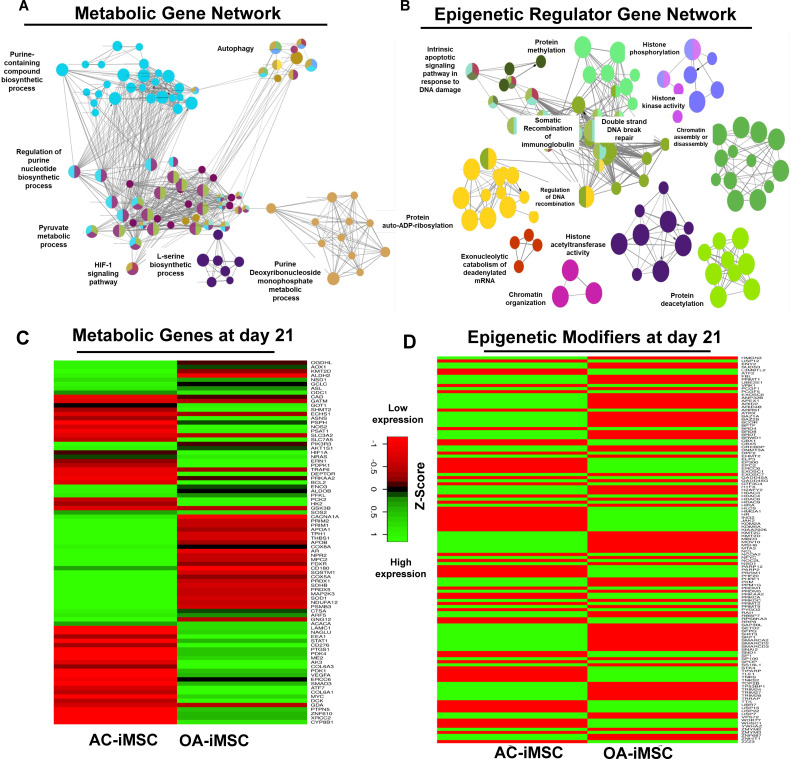
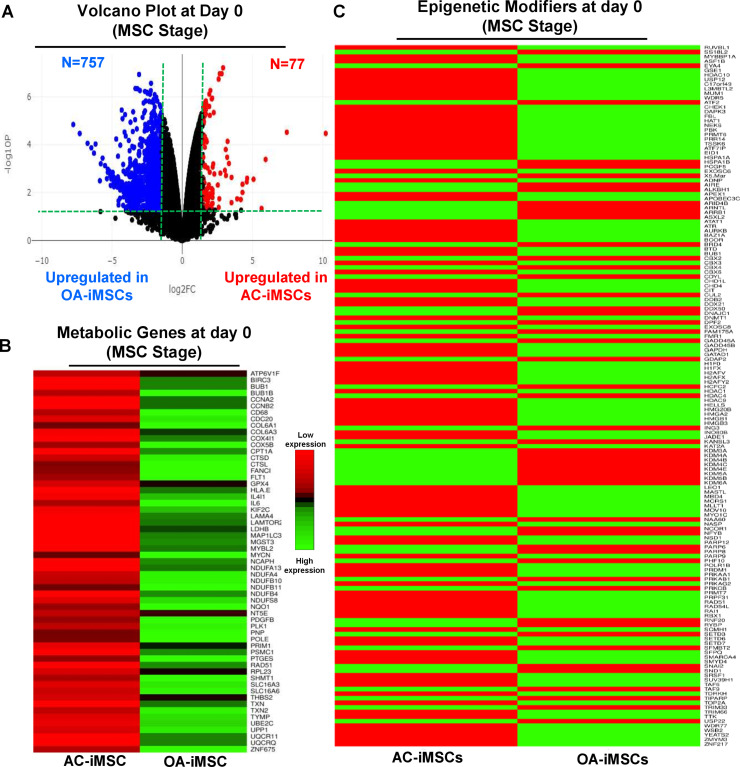
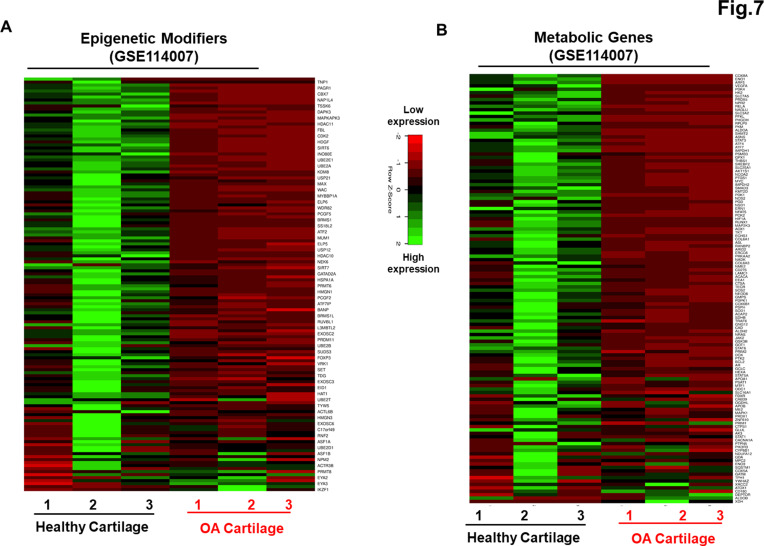
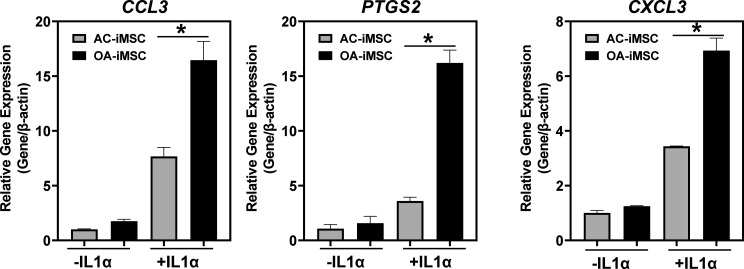
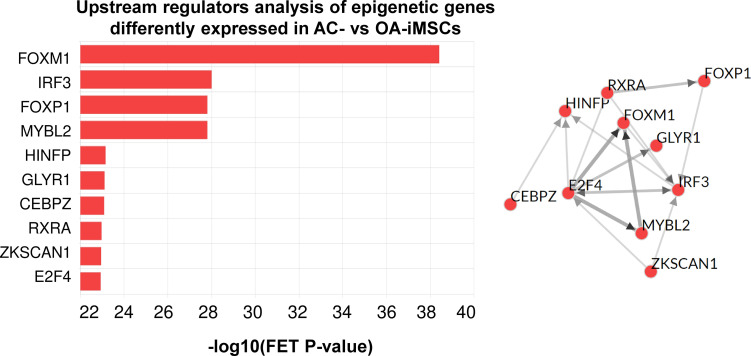
Induced pluripotent stem cells (iPSCs) are potential cell sources for regenerative medicine. The iPSCs exhibit a preference for lineage differentiation to the donor cell type indicating the existence of memory of origin. Although the intrinsic effect of the donor cell type on differentiation of iPSCs is well recognized, whether disease-specific factors of donor cells influence the differentiation capacity of iPSC remains unknown. Using viral based reprogramming, we demonstrated the generation of iPSCs from chondrocytes isolated from healthy (AC-iPSCs) and osteoarthritis cartilage (OA-iPSCs). These reprogrammed cells acquired markers of pluripotency and differentiated into uncommitted mesenchymal-like progenitors. Interestingly, AC-iPSCs exhibited enhanced chondrogenic potential as compared OA-iPSCs and showed increased expression of chondrogenic genes. Pan-transcriptome analysis showed that chondrocytes derived from AC-iPSCs were enriched in molecular pathways related to energy metabolism and epigenetic regulation, together with distinct expression signature that distinguishes them from OA-iPSCs. Our molecular tracing data demonstrated that dysregulation of epigenetic and metabolic factors seen in OA chondrocytes relative to healthy chondrocytes persisted following iPSC reprogramming and differentiation toward mesenchymal progenitors. Our results suggest that the epigenetic and metabolic memory of disease may predispose OA-iPSCs for their reduced chondrogenic differentiation and thus regulation at epigenetic and metabolic level may be an effective strategy for controlling the chondrogenic potential of iPSCs.

Keywords: cell biology; chondrocytes; human; mouse; regenerative medicine; stem cells; transcriptomics.


Conflict of interest statement

NK, MD, SC, PP, PB, LM, RG, HD No competing interests declared

Figures

Figure 1.
Figure 1.. Characterization of induced pluripotent stem cells (iPSCs) generated from healthy and osteoarthritis (OA) articular chondrocytes.
(A) Morphology of the AC-iPSC (#7, #14, and #15) and OA-iPSC (#2, #5, and #8) colonies in monolayer culture on a 0.1% Geltrex-coated plate. Image displays representative experiment (n = 3). (B) Alkaline phosphatase (ALP) staining of iPSC colonies showing undifferentiated pluripotent stage. Image displays representative experiment (n = 3). (C) Pluripotency for iPSC colonies showing expression of stemness genes. RT-qPCR (Real time-quantitative PCR) analyses showed induced expression of canonical stemness genes SOX2, OCT4, NANOG, and KLF4 in AC- and OA-iPSC colonies. β-Actin served as the housekeeping gene and internal control. Results from one representative experiment (n = 3). Represented gene expression data are relative to mesenchymal stem-like cells (MSCs) derived from respective iPSC cells. *p ≤ 0.01, as compared to their respective MSCs. (D) Immunofluorescence staining of pluripotency markers in AC-iPSCs (#7) and OA-iPSCs (#2) showed expression of surface TRA-1–60 and SSEA-4 antigens in these colonies. DAPI (4′,6-diamidino-2-phenylindole) is used as nuclear counterstain showing blue nuclei. Scale bar, 100 μm. Image displays representative experiment (n = 3).
Figure 2.
Figure 2.. Derivation of induced pluripotent stem cell (iPSC)-MSCs (iMSCs) like cells from AC- and OA-iPSCs and characterization of their mesenchymal feature.
(A) The morphology of the iMSC-like cells (iPSC–MSC) derived from AC- and OA-iPSC showing elongated spindle-shaped cells. Representative images are shown for iMSCs at passages 5–8. Scale bar, 100 μm. Image displays representative experiment (n = 3). (B) Gene expression analyses by qPCR showing significant suppression of pluripotent markers OCT4 and SOX2, and induction of mesenchymal genes TWIST1, COL1A1, and RUNX1 in the AC- and OA-iMSCs relative to their parental iPSCs. β-Actin served as the housekeeping gene and internal control. Results from one representative experiment (n = 3). Expression data are represented as fold change relative to respective parental iPSCs. *p ≤ 0.01, as compared to their respective iPSCs. (C) Expression of surface antigens in AC- and OA-iMSCs by flow analysis. Representative flow cytometric histogram showing OA-iMSCs (#2) express markers associated with the mesenchymal phenotype (positive for CD44, CD73, CD90, CD105, and CD166; negative for CD31 and CD45) (n = 3). Red histogram shows antibody-stained population; blue profile shows negative isotype-stained population. (D) Comparative flow cytometry analyses of AC-iMSCs (#7, #14, and #15) and the OA-iMSCs (#2, #5, and #8) showing similar cell surface expression profiles. Results from one representative experiment (n = 3).
Figure 2—figure supplement 1.
Figure 2—figure supplement 1.. Trilineage differentiation of AC- and OA-iMSCs into osteoblasts, chondrocytes and adipocytes.
(A) Trilineage differentiation of these AC- and OA-iMSCs using in vitro adipogenic, osteogenic, and chondrogenic differentiation assays. (B) Chondrocyte differentiation of AC- and OA-iMSCs was shown by Alcian blue staining of micromass cultures. Osteoblast differentiation was shown by Alizarin red staining and Adipogenic differentiation was visualized using Oil Red O staining at day 21 culture. Scale bar, 100 µm. Image displays representative experiment (n = 3). (C) qPCR analyses of the relative transcript levels of osteogenic genes RUNX2, OSX, and COL1A1 in days 7, 14, and 21 pellet culture of AC- and OA-iMSCs. β-Actin served as the housekeeping gene and internal control. Values represent fold induction (mean ± standard deviation [SD]) relative to control iMSCs (day 0) from three replicate. Results from one representative experiment (n = 3).
Figure 3.
Figure 3.. AC-iMSCs exhibit superior chondrogenic potential in vitro.
(A) Schematic showing treatment conditions for in vitro chondrogenic differentiation of AC- and OA-iMSCs using pellet and micromass method. (B) Chondrocyte differentiation was shown by Alcian blue staining of micromass cultures in serum-free chondrogenic media for 21 days with 100 ng/ml BMP2. Alcian blue staining revealed accumulation of sulfated proteoglycans indicating enhanced secretion of matrix in AC-iMSC as compared to OA-iMSCs micromass culture. High-magnification images further demonstrated enhanced cellular compaction (yellow arrow) in AC-iMSCs micromass indicating the development of cartilaginous nodules. Scale bar, 100 µm. Image displays representative experiment (n = 3). (C) Quantitative PCR analyses of the relative transcript levels of chondrogenic genes SOX9, COL2A1, ACAN and hypertrophic gene COL10A1 in days 7, 14, and 21 pellet culture of all three clones of AC- and OA-iMSCs. β-Actin served as the housekeeping gene and internal control. Values represent fold induction (mean ± standard deviation [SD]) relative to control iMSCs (day 0) from three replicate. *p ≤ 0.01 indicate values are statistically different in OA-iMSCs as compared to their AC-iMSCs at each time point. Results from one representative experiment (n = 4).
Figure 4.
Figure 4.. AC-iMSCs during chondrogenic differentiation exhibit distinct transcriptome signature.
Bulk RNA-sequencing was performed during chondrogenic differentiation of AC- vs. OA-iMSCs and differential gene expression analyses revealing distinct transcriptomic signature. (A) Genes with differential expression levels greater than twofold (false discovery rate [FDR] p value <0.05) were visualized as volcano plot showing differential expression of 406 genes. (B) Principal component analysis (PCA) using differentially expressed genes (DEGs) showing segregation of AC- vs. OA-iChondrocytes generated during day 21 chondrogenic differentiation using pellet culture. (C) Functional annotation clustering using GO analysis for biological process (BP) using DEGs at day 21 chondrogenic differentiation of AC- vs. OA-iMSCs. Y-axis label represents pathway, and X-axis label represents gene term ratio (gene term ratio = gene numbers annotated in this pathway term/all gene numbers annotated in this pathway term). Size of the bubble represents the number of genes enriched in the GO terms, and color showed the FDR p value of GO terms. (D) KEGG (Kyoto Encyclopedia of Genes and Genomes) pathway analysis showing enrichment of molecular pathways contributing to differential chondrogenic potential of AC- vs. OA-iMSCs.
Figure 4—figure supplement 1.
Figure 4—figure supplement 1.. Validation of RNA-seq results by quantitative PCR.
Select genes were chosen for further analysis and validation of the RNA-seq results. RNAs were isolated from day 21 chondrogenic differentiation of AC- and OA-iMSCs. Results from one representative experiment (n = 3). Values represent fold induction (mean ± standard deviation [SD]) relative to control AC-iPSCs from three replicate. *p ≤ 0.01 indicate values are statistically different in OA-iPSCs as compared to their AC-iPSCs.
Figure 5.
Figure 5.. Enrichment of metabolic and epigenetic regulators interaction networks during chondrogenic differentiation of AC-iMSCs.
(A, B) Interaction network analysis using differentially expressed genes (DEGs) at day 21 chondrogenic differentiation of AC- and OA-iMSCs. PPI network of DEGs in AC-iChondrocytes was constructed using STRING database and visualized by Cytoscape. Pathway enrichment analysis in the interaction network was performed using ClueGO analysis which showed enrichment of pathways related to (A) metabolic genes and (B) epigenetic modifiers. Multiple nodes of metabolic and epigenetic regulators were enriched in these interaction networks suggesting the role of these pathways in differential chondrogenic potential. (C, D) Differential expression analyses of the genes involved in these enriched pathways related to energy metabolism and epigenetic regulators. The gene expression was visualized using heatmap analysis for DEGs related to (C) energy metabolism and (D) epigenetic regulators. Expression values for each gene (row) were normalized across all samples (columns) by Z-score. Color key indicates the intensity associated with normalized expression values. Green shades indicate higher expression and red shades indicate lower expression.
Figure 6.
Figure 6.. AC-iMSCs at undifferentiated state showed distinct expression of genes involved in metabolic and epigenetic regulators.
(A) Differential gene expression analyses of AC- and OA-iMSCs at day 0 (start of chondrogenic differentiation) showing distinct transcriptomic signature. Genes with differential expression levels greater than twofold (false discovery rate [FDR] p value <0.05) were visualized as volcano plot showing differential expression of 834 genes. (B, C) Pathway analysis was performed in 834 differentially expressed genes (DEGs) to show the enrichment of pathways related to metabolism and epigenetic modifiers. Heatmap was used to show expression of the genes related to (B) energy metabolism and (C) epigenetic regulators. Expression values for each gene (row) were normalized across all samples (columns) by Z-score. Color key indicates the intensity associated with normalized expression values. Green shades indicate higher expression and red shades indicate lower expression.
Figure 7.
Figure 7.. Genetically distinct characteristic of AC- and osteoarthritis (OA)-iMSCs was imprint of original cell sources from healthy and OA chondrocytes.
The expression of genes involved in energy metabolism and epigenetic modifiers was performed by analysis of publicly available RNA-seq data performed on healthy and OA cartilage tissues (GSE114007). Gene expression was visualized by heatmap analysis for (A) epigenetic modifiers and (B) metabolic genes. Expression values for each gene (row) were normalized across all samples (columns) by Z-score. Color key indicates the intensity associated with normalized expression values. Green shades indicate higher expression and red shades indicate lower expression.
Figure 7—figure supplement 1.
Figure 7—figure supplement 1.. Inflammatory response of AC- and OA-iMSCs in response to stimulation of IL1α (10 ng/ml).
qPCR analyses of the relative transcript levels of inflammatory genes CCL3, PTGS2, and CXCL3 after 24-hr stimulation of IL1α of AC- and OA-iMSCs. β-Actin served as the housekeeping gene and internal control. Values represent fold induction (mean ± standard deviation [SD]) relative to AC-iMSCs from three replicate. Results from one representative experiment (n = 3). Results from one representative experiment (n = 3). Values represent fold induction (mean ± SD) relative to AC-iMSCs from three replicate. *p ≤ 0.01 indicate values are statistically different in OA-iMSCs as compared to their AC-iPSCs.
Figure 7—figure supplement 2.
Figure 7—figure supplement 2.. Upstream transcription factor analysis among the epigenetic modifiers between AC- and osteoarthritis (OA)-iMSCs identified the enrichment of several transcription factors including FOXM1 which is predicted to regulate the response of iMSCs in inflammatory environment.

Similar articles

Cited by

References

    1. Bar-Nur O, Russ HA, Efrat S, Benvenisty N. Epigenetic memory and preferential lineage-specific differentiation in induced pluripotent stem cells derived from human pancreatic islet beta cells. Cell Stem Cell. 2011;9:17–23. doi: 10.1016/j.stem.2011.06.007. - DOI - PubMed
    1. Bindea G, Mlecnik B, Hackl H, Charoentong P, Tosolini M, Kirilovsky A, Fridman WH, Pagès F, Trajanoski Z, Galon J. ClueGO: a cytoscape plug-in to decipher functionally grouped gene ontology and pathway annotation networks. Bioinformatics. 2009;25:1091–1093. doi: 10.1093/bioinformatics/btp101. - DOI - PMC - PubMed
    1. Choompoo N, Bartley OJM, Precious SV, Vinh N-N, Schnell C, Garcia A, Roberton VH, Williams NM, Kemp PJ, Kelly CM, Rosser AE. Induced pluripotent stem cells derived from the developing striatum as a potential donor source for cell replacement therapy for Huntington disease. Cytotherapy. 2021;23:111–118. doi: 10.1016/j.jcyt.2020.06.001. - DOI - PMC - PubMed
    1. Daniels K, Reiter R, Solursh M. Micromass cultures of limb and other mesenchyme. Methods in Cell Biology. 1996;51:237–247. doi: 10.1016/s0091-679x(08)60631-7. - DOI - PubMed
    1. Diaz-Hernandez ME, Khan NM, Trochez CM, Yoon T, Maye P, Presciutti SM, Gibson G, Drissi H. Derivation of notochordal cells from human embryonic stem cells reveals unique regulatory networks by single cell-transcriptomics. Journal of Cellular Physiology. 2020;235:5241–5255. doi: 10.1002/jcp.29411. - DOI - PMC - PubMed

Publication types

Associated data