. 2023 Feb 8;145(5):3075-3083.
doi: 10.1021/jacs.2c11969. Epub 2023 Jan 30.

Exchangeable HaloTag Ligands for Super-Resolution Fluorescence Microscopy

Affiliations

Exchangeable HaloTag Ligands for Super-Resolution Fluorescence Microscopy

Julian Kompa et al. J Am Chem Soc. .

Abstract

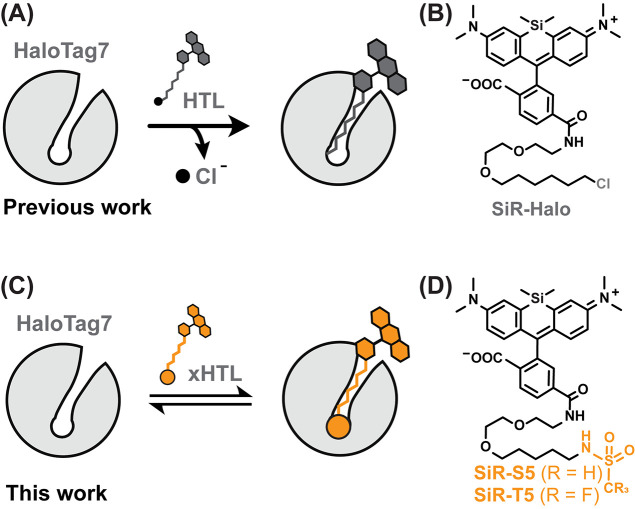
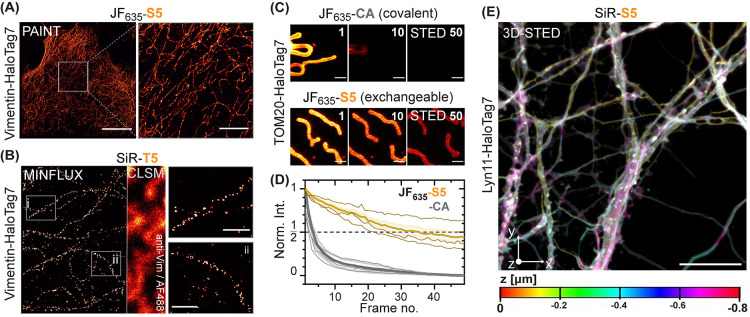
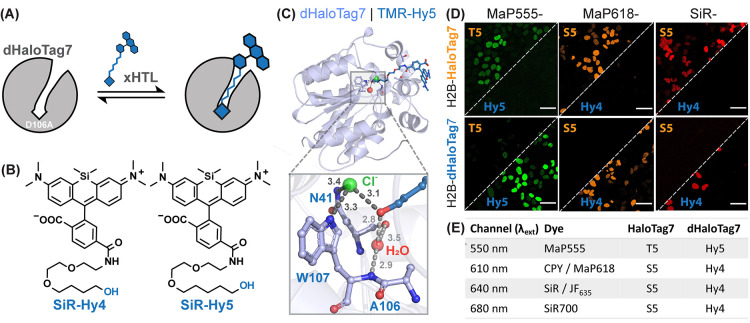
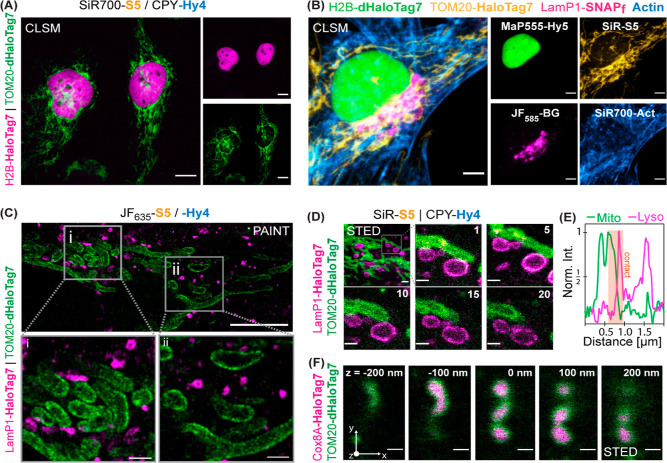
The specific and covalent labeling of the protein HaloTag with fluorescent probes in living cells makes it a powerful tool for bioimaging. However, the irreversible attachment of the probe to HaloTag precludes imaging applications that require transient binding of the probe and comes with the risk of irreversible photobleaching. Here, we introduce exchangeable ligands for fluorescence labeling of HaloTag (xHTLs) that reversibly bind to HaloTag and that can be coupled to rhodamines of different colors. In stimulated emission depletion (STED) microscopy, probe exchange of xHTLs allows imaging with reduced photobleaching as compared to covalent HaloTag labeling. Transient binding of fluorogenic xHTLs to HaloTag fusion proteins enables points accumulation for imaging in nanoscale topography (PAINT) and MINFLUX microscopy. We furthermore introduce pairs of xHTLs and HaloTag mutants for dual-color PAINT and STED microscopy. xHTLs thus open up new possibilities in imaging across microscopy platforms for a widely used labeling approach.


Conflict of interest statement

The authors declare the following competing financial interest(s): JK, JH and KJ are listed as inventors on a patent application related to the present work and filed by the Max Planck Society.

Figures

Figure 1
Figure 1
(A) Scheme of covalent HaloTag7 labeling with a fluorescent ligand. (B) Structure of silicon rhodamine (SiR) modified with chloroalkane (SiR-CA = SiR-Halo). (C) Scheme of non-covalent HaloTag7 labeling with a fluorescent exchangeable HaloTag Ligand (xHTL). (D) Structure of SiR-xHTLs consisting of methylsulfonamide (S5) or trifluoromethylsulfonamide (T5) ligands attached to the rhodamine.
Figure 2
Figure 2
(A) HaloTag7 covalent labeling experiments. SDS-PAGE followed by in-gel fluorescence scanning and Coomassie-staining after incubating SiR-(x)HTL probes with HaloTag7. MwM—Molecular weight marker. (B) Structural comparison of the TMR-S5/HaloTag7 complex docking and X-ray structure (PDB-ID: 7ZJ0, 1.5 Å resolution). (C) Magnification on the binding pocket of the TMR-S5/HaloTag7 complex docking. Binding energy was reduced compared to redocking for TMR-CA (ΔΔGbind = −4.2 kcal/mol). (D) Binding pockets of the TMR-S5/HaloTag7 and (E) TMR-T5/HaloTag7 (PDB-ID: 7ZJY, 1.5 Å resolution) complex crystal structures. Polar interactions are highlighted with dashed lines. Distances in Å. (F) Structural comparison between the binding pockets of the TMR-S5 and TMR-T5/HaloTag7 complex crystal structures.
Figure 3
Figure 3
Fluorescence emission spectra of free (dashed lines) and HaloTag7-bound (plain line) SiR- or JF635-(x)HTLs. Quantum yields (Φ) in the presence of HaloTag7 are indicated below.
Figure 4
Figure 4
(A) Live-cell confocal images of different fluorescent xHTL probes covering the visible spectrum. Histone2B-HaloTag7 (H2B-HaloTag7) expressing U2OS cells stained with 500 nM xHTLs. Sum projections. Scale bars: 10 μm. Signal-over-background ratios (S/B) are indicated in the bottom left corner (n ≥ 50 cells, mean ± standard error of the mean). (B) Reversible cellular staining using xHTLs. Live-cell confocal images of U2OS expressing HaloTag7-SNAPNLS (nuclear localization signal) covalently labeled with MaP555-BG and iteratively stained with 500 nM SiR-S5 or washed with an imaging medium (10 min cycles). Sum projections. Scale bar: 2 μm. Images recorded every 30 s. (C) Intensity-time-trace given of the experiments shown in B. Fluorescence intensity ratio is FISiR/FIMaP555. (D) Flow cytometry profiles of cells stained with SiR-Halo or SiR-T5 (500 nM). U2OS expressing no HaloTag7 or Histone2B-HaloTag7 fusions. Sideward scatter (SSC) vs. SiR fluorescence intensity (SiR FI) are presented. (E) Confocal microscopy images of Histone2B-HaloTag7 16 h after cell sorting with SiR-Halo or -T5 (500 nM). Restaining using Hoechst (1 μg/mL) and MaP555-CA (500 nM).
Figure 5
Figure 5
(A) HaloTag-PAINT image of a fixed U2OS cell endogenously expressing vimentin-HaloTag7 labeled with JF635-S5 (5 nM). Scale bar: 10 μm (overview) and 2 μm (magnified region). (B) 2D-MINFLUX microscopy image of fixed U2OS cells expressing vimentin-HaloTag7 labeled with SiR-T5 (2 nM). Vimentin immunostaining (AF488) and confocal laser-scanning microscopy (CLSM) imaging was used as a reference. Magnification reveals vimentin-HaloTag7 molecules with a localization precision of ∼3.9 nm. Intensities are represented in arbitrary units from 0 to 3 (overview) or 0 to 12 (magnified region). Scale bars: 0.2 μm. (C) Multiframe STED images of U2OS mitochondria outer membrane (TOM20-HaloTag7) labeled with JF635-CA or JF635-S5. Frame numbers indicated in the top right corner. Scale bar: 1 μm. (D) Bleaching curves (thick lines: mean value and S.D., thin lines: individual experiments) from similar experiment as shown in C. (E) 3D-STED image of Lyn11-HaloTag7 (plasma membrane) from live cultured rat hippocampal neurons labeled with SiR-S5. An area of 40 × 40 μm (xy, 80 nm pixel-size) was recorded in 20 nm z-stacks over 40 times (0.8 μm z-depth). Max. projection and depth color-coding. Scale bar: 10 μm.
Figure 6
Figure 6
(A) Scheme of non-covalent dHaloTag7 labeling with a fluorescent xHTL. (B) Structure of SiR-xHTLs consisting of alkane-hydroxy (Hy4 and Hy5) ligands attached to rhodamines. (C) Structural analysis of the TMR-Hy5/dHaloTag7 complex (PDB-ID: 7ZIZ, 1.5 Å resolution). Magnification on the binding pocket (distances in Å). (D) Representative confocal images of live U2OS cells expressing H2B-HaloTag7 or H2B-dHaloTag7 labeled with annotated xHTLs. Scale bars: 10 μm. (E) Summarizing table of xHTL combinations for two-color live-cell fluorescence microscopy.
Figure 7
Figure 7
(A) Dual-color live-cell confocal images using combinable xHTLs. U2OS cells expressing H2B-HaloTag7 and TOM20-dHaloTag7 labeled with SiR700-S5 and CPY-Hy4 (500 nM). Scale: 10 μm. (B) Four-color confocal image of a U2OS cell live stained using orthogonal xHTLs, SNAP-tag. and a SiR700-actin probe (c). MaP555-Hy5, SiR-S5, and JF585-BG were used to label H2B-dHaloTag7 (nucleus), TOM20-HaloTag7 (mitochondria surface), and LamP1-SNAP-tag (lysosome), respectively. Scale: 5 μm. (C) Dual-target Exchange-PAINT image of mitochondria and lysosomes of fixed U2OS cells using combinable xHTLs. Cells expressing TOM20-HaloTag7 and LamP1-dHaloTag7 via T2A fusion. Sequential labeling and imaging using JF635-S5 (5 nM, magenta) and JF635–Hy4 (3 nM, green). Scale bars: 10 μm (overview) or 1 μm (magnified region). (D) Dual-color time-lapse STED images of mitochondria-lysosome dynamics in live U2OS cells. Cells labeled with 500 nM xHTLs. Imaging over 20 consecutive frames, 2 frames/minute, 10 μm2 area. Frame numbers indicated in the top right corner. SiR- and CPY-xHTLs were chosen for their higher brightness in STED imaging. Scale bars: 2 μm (overview) or 0.5 μm (magnified region). (E) Line-scan profile across a lysosomal vesicle mitochondria contact site. (F) 3D-STED images of xHTL-stained U2OS mitochondria. Cells express Cox8A-HaloTag7 (inner membrane) and TOM20-dHaloTag7 (outer membrane) via T2A fusion and were labeled with SiR-S5 and CPY-Hy4 (500 nM). An area of 2.44 × 3.20 μm (xy) was recorded in 50 nm z-stacks over 40 times; z-plains are indicated in the top right corner. Scale bar: 0.5 μm.

References

    1. Schermelleh L.; Ferrand A.; Huser T.; et al. Super-resolution microscopy demystified. Nat. Cell Biol. 2019, 21, 72–84. 10.1038/s41556-018-0251-8. - DOI - PubMed
    1. Keppler A.; Gendreizig S.; Gronemeyer T.; et al. A general method for the covalent labeling of fusion proteins with small molecules in vivo. Nat. Biotechnol. 2003, 21, 86–89. 10.1038/nbt765. - DOI - PubMed
    1. Gautier A.; Juillerat A.; Heinis C.; et al. An engineered protein tag for multiprotein labeling in living cells. Chem. Biol. 2008, 15, 128–136. 10.1016/j.chembiol.2008.01.007. - DOI - PubMed
    1. Los G. V.; Encell L. P.; McDougall M. G.; et al. HaloTag: a novel protein labeling technology for cell imaging and protein analysis. ACS Chem. Biol. 2008, 3, 373–382. 10.1021/cb800025k. - DOI - PubMed
    1. Ohana R. F.; Encell L. P.; Zhao K.; et al. HaloTag7: a genetically engineered tag that enhances bacterial expression of soluble proteins and improves protein purification. Protein Expression Purif. 2009, 68, 110–120. 10.1016/j.pep.2009.05.010. - DOI - PubMed

Publication types