. 2023 Feb 8;145(5):3016-3030.
doi: 10.1021/jacs.2c11540. Epub 2023 Jan 30.

Shape-Dependent CO2 Hydrogenation to Methanol over Cu2O Nanocubes Supported on ZnO

Affiliations

Shape-Dependent CO2 Hydrogenation to Methanol over Cu2O Nanocubes Supported on ZnO

David Kordus et al. J Am Chem Soc. .

Abstract

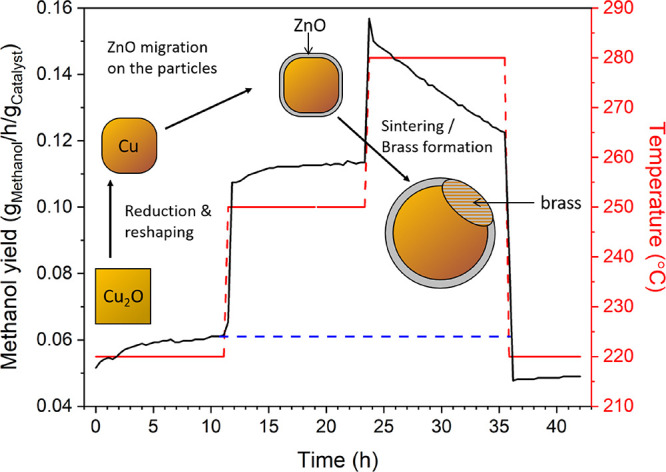
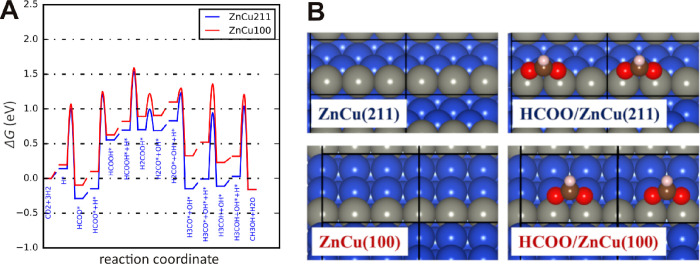
The hydrogenation of CO2 to methanol over Cu/ZnO-based catalysts is highly sensitive to the surface composition and catalyst structure. Thus, its optimization requires a deep understanding of the influence of the pre-catalyst structure on its evolution under realistic reaction conditions, including the formation and stabilization of the most active sites. Here, the role of the pre-catalyst shape (cubic vs spherical) in the activity and selectivity of ZnO-supported Cu nanoparticles was investigated during methanol synthesis. A combination of ex situ, in situ, and operando microscopy, spectroscopy, and diffraction methods revealed drastic changes in the morphology and composition of the shaped pre-catalysts under reaction conditions. In particular, the rounding of the cubes and partial loss of the (100) facets were observed, although such motifs remained in smaller domains. Nonetheless, the initial pre-catalyst structure was found to strongly affect its subsequent transformation in the course of the CO2 hydrogenation reaction and activity/selectivity trends. In particular, the cubic Cu particles displayed an increased activity for methanol production, although at the cost of a slightly reduced selectivity when compared to similarly sized spherical particles. These findings were rationalized with the help of density functional theory calculations.


Conflict of interest statement

The authors declare no competing financial interest.

Figures

Figure 1
Figure 1
STEM images and corresponding EDX maps of cubic Cu2O NPs supported on nanocrystalline ZnO: (A, B) as prepared Cu2O, (C, D) after reduction in H2 at 170 °C for 2 h, and after the CO2 hydrogenation reaction at 170 °C for (E, F) 10 min and (G, H) over 100 h. The green color in the EDX maps corresponds to Zn, the red to Cu.
Figure 2
Figure 2
In situ XRD measurements of Cu2O cubes supported on ZnO. (A) Diffractogram acquired during the reduction with 10% H2 balanced in He between 140 and 180 °C and (B) under reaction conditions (75% H2 + 25% CO2, p = 10 bar) at the indicated temperatures. (C) Evolution of the concentration of the oxidized and metallic copper species during the reduction. One step at each of the indicated temperatures lasted approximately 12 min. (D) Cu crystallite size extracted by Rietveld fitting analysis for the catalyst under reaction conditions. During the reduction, scans were started immediately after the desired temperature was reached. All scans in the reaction mixture were started once the desired temperature was reached and was stable for 30 min, except the scan labeled as 250*, which was performed after 2 h in the reaction mixture at 250 °C.
Figure 3
Figure 3
Operando (A, B) Cu K-edge XANES and (C) Fourier-transformed EXAFS (k-weight = 2) spectra of the NCs on ZnO catalyst during and between the different treatments as indicated inthe figure. Spectra labeled “after reaction/reduction” were acquired in a He atmosphere at room temperature. Additionally, reference spectra of bulk Cu2O and Cu are displayed. (D) Results of the linear combination fitting of the Cu K-edge XANES spectra collected during the different pre-treatment and reaction steps.
Figure 4
Figure 4
(A) Methanol yield and (B) selectivity of Cu2O nanocubes (NC) on ZnO, spherical Cu NPs on ZnO (NP), and the commercial reference catalyst (CR). The lines in the plots are just guides for the eye. All experiments were done with one sample of each catalyst used subsequently for each parameter variation.
Figure 5
Figure 5
Methanol production (normalized by the weight of the catalyst) of the Cu2O NC catalyst at 20 bar acquired at different temperatures. The dashed blue line serves as a guide for the eye to compare activity at 220 °C before and after the 280 °C reaction step. The inserted drawings illustrate the changes happening to the NC catalyst during the reduction treatment and also in the course of the reaction, including the formation of a ZnO overlayer and the sintering and possible brass formation at high temperature leading to the deactivation.
Figure 6
Figure 6
(A) Calculated Gibbs free energy diagram for CO2 hydrogenation to methanol (T = 227 °C (500 K), p(H2) = 40 bar, p(CO2) = 10 bar, and p(CH3OH) = 1 bar) over Cu(100) (red) and Cu(211) (blue) surfaces. (B) Structures of ZnCu(211) and ZnCu(100) surfaces used in the calculations and optimized structure of adsorbed formate. Blue = Cu, gray = Zn, red = O, brown = C and white = H.
Figure 7
Figure 7
Calculated difference between energies of the transition state of H2COOH and adsorbed formate on the surface for ZnCu(100) compared to the employed models for ZnO/Cu(111) and ZnO/Cu(100). Structure of the optimized transition state of H2COOH formation for the three surfaces. Color code is the same as in Figure 6.
Figure 8
Figure 8
Comparison of the DRIFT spectra of Cu NCs and Cu NPs supported on ZnO in the presence of 1 mbar CO at −187 °C.
Figure 9
Figure 9
In situ Raman spectroscopy on the Cu NCs (A, B) and spherical NPs (C, D), both supported on ZnO. (A, C) Spectra acquired during the reduction in H2 with increasing temperature and under reaction conditions at 250 °C. The lines correspond to Cu2+ (626 cm–1), Cu+ (510 cm–1, 613 cm–1), and ZnO (426 cm–1, 560 cm–1). (B, D) Raman spectra of the formate region at the end of the reduction (10% H2 in He) and under reaction conditions (60% H2 + 20% CO2 + 20% He, 15 bar) at multiple temperatures showing the increasing formate band with temperature. The inset shows the spectra for the cubic and spherical pre-catalysts compared directly under reaction conditions. The peak position of the NP catalyst is shifted to slightly lower wavenumbers.

References

    1. Schimpf S.; Muhler M.Methanol Catalysts. In Synthesis of Solid Catalysts; De Jong K. P., Ed.; Wiley-VCH Verlag, 2009, 329–351.
    1. Sehested J. Industrial and Scientific Directions of Methanol Catalyst Development. J. Catal. 2019, 371, 368–375. 10.1016/j.jcat.2019.02.002. - DOI
    1. Olah G. A. Beyond Oil and Gas: The Methanol Economy. Angew. Chem., Int. Ed. 2005, 44, 2636–2639. 10.1002/anie.200462121. - DOI - PubMed
    1. Roy S.; Cherevotan A.; Peter S. C. Thermochemical CO2 Hydrogenation to Single Carbon Products: Scientific and Technological Challenges. ACS Energy Lett. 2018, 3, 1938–1966. 10.1021/acsenergylett.8b00740. - DOI
    1. Li M. M. J.; Tsang S. C. E. Bimetallic Catalysts for Green Methanol Production via CO2 and Renewable Hydrogen: A Mini-Review and Prospects. Catal. Sci. Technol. 2018, 8, 3450–3464. 10.1039/C8CY00304A. - DOI