

An intelligent health monitoring and diagnosis system based on the internet of things and fuzzy logic for cardiac arrhythmia COVID-19 patients
- PMID: 36716687
- PMCID: PMC9883984
- DOI: 10.1016/j.compbiomed.2023.106583
An intelligent health monitoring and diagnosis system based on the internet of things and fuzzy logic for cardiac arrhythmia COVID-19 patients
Abstract
Background: During the COVID-19 pandemic, there is a global demand for intelligent health surveillance and diagnosis systems for patients with critical conditions, particularly those with severe heart diseases. Sophisticated measurement tools are used in hospitals worldwide to identify serious heart conditions. However, these tools need the face-to-face involvement of healthcare experts to identify cardiac problems.
Objective: To design and implement an intelligent health monitoring and diagnosis system for critical cardiac arrhythmia COVID-19 patients.
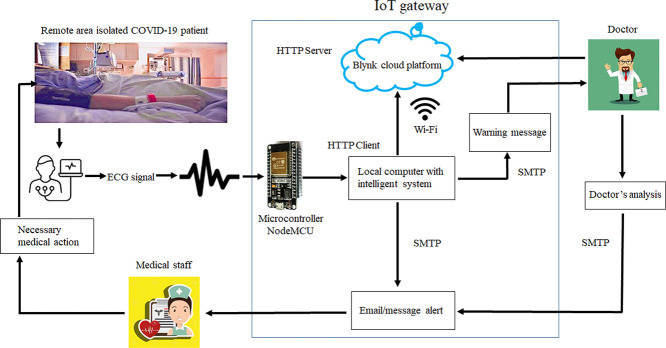
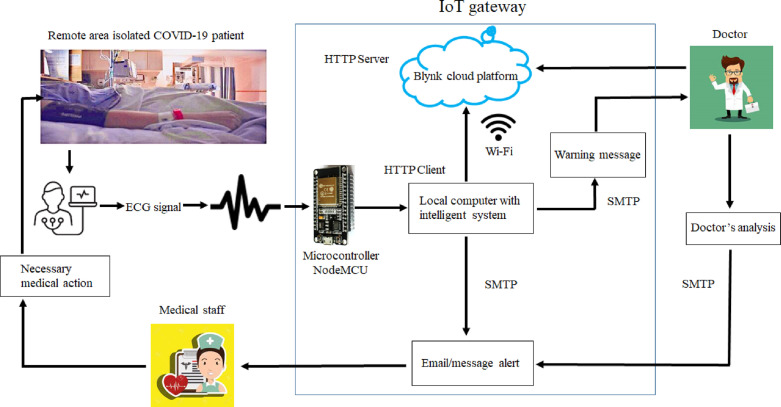
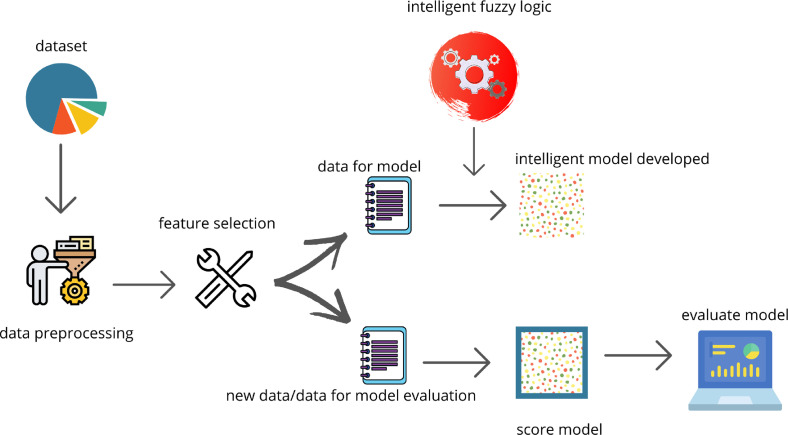
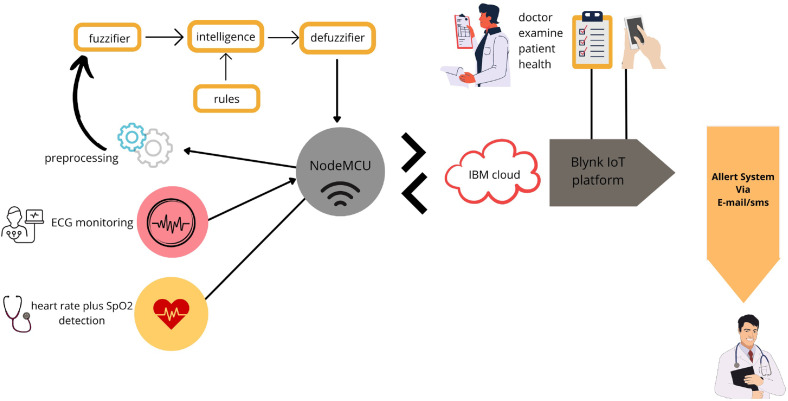
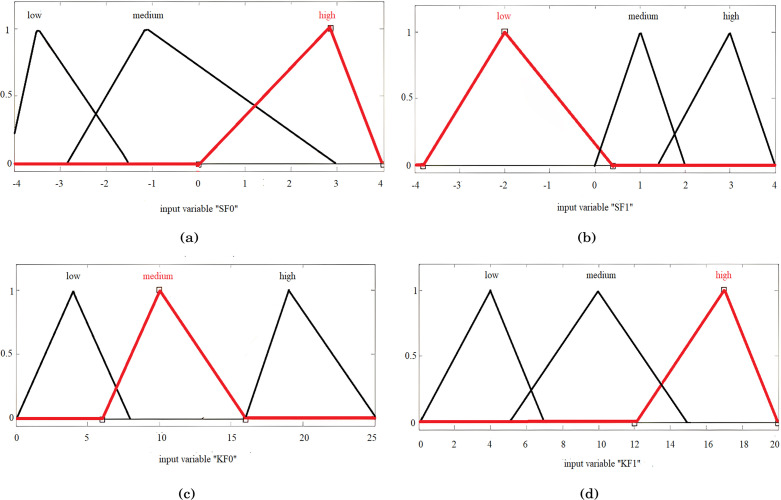
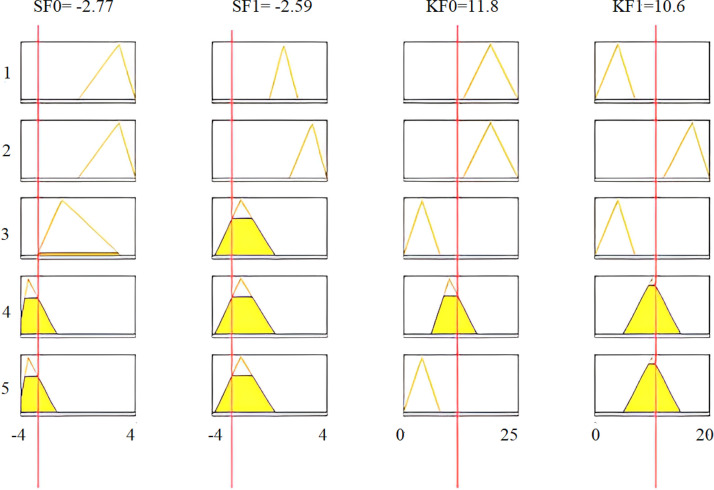
Methodology: We use artificial intelligence tools divided into two parts: (i) IoT-based health monitoring; and (ii) fuzzy logic-based medical diagnosis. The intelligent diagnosis of heart conditions and IoT-based health surveillance by doctors is offered to critical COVID-19 patients or isolated in remote locations. Sensors, cloud storage, as well as a global system for mobile texts and emails for communication with doctors in case of emergency are employed in our proposal.
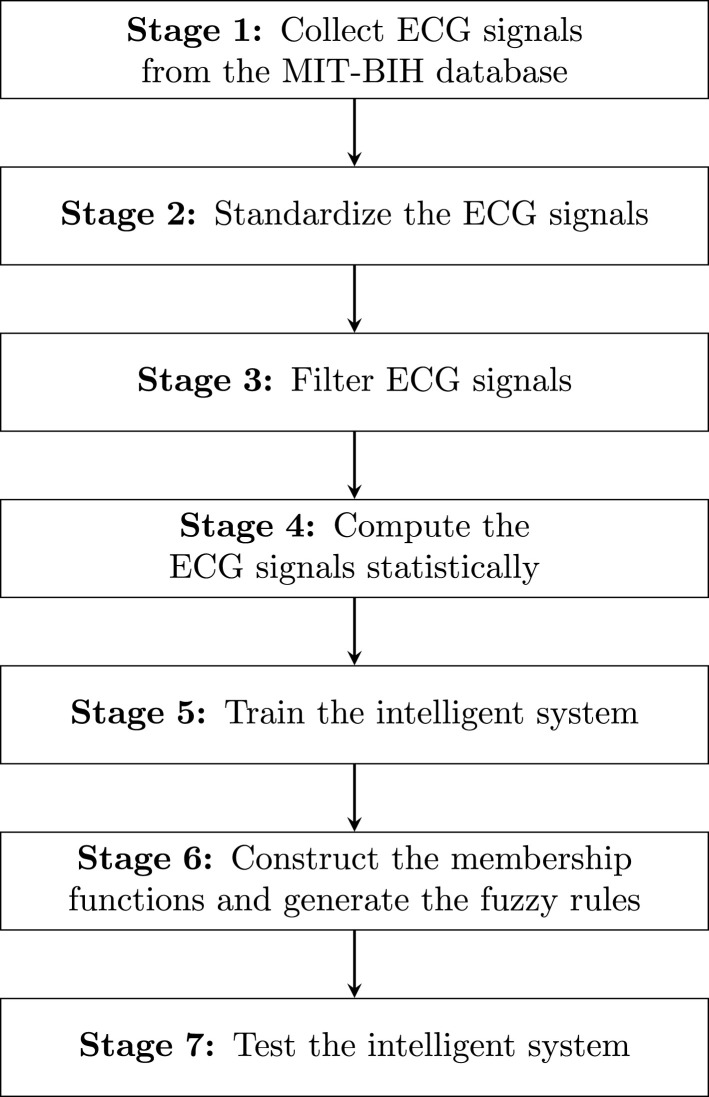
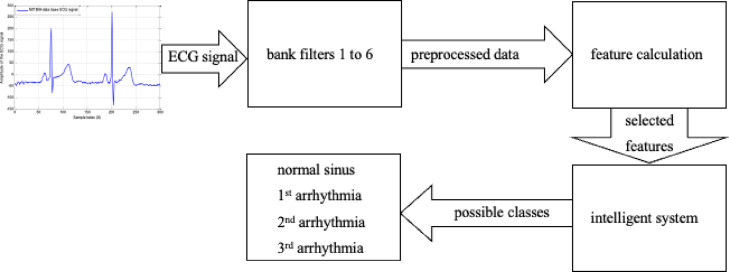
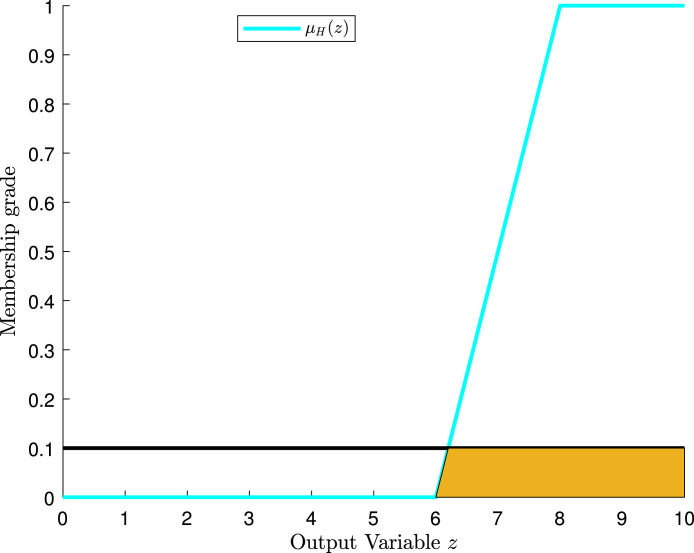
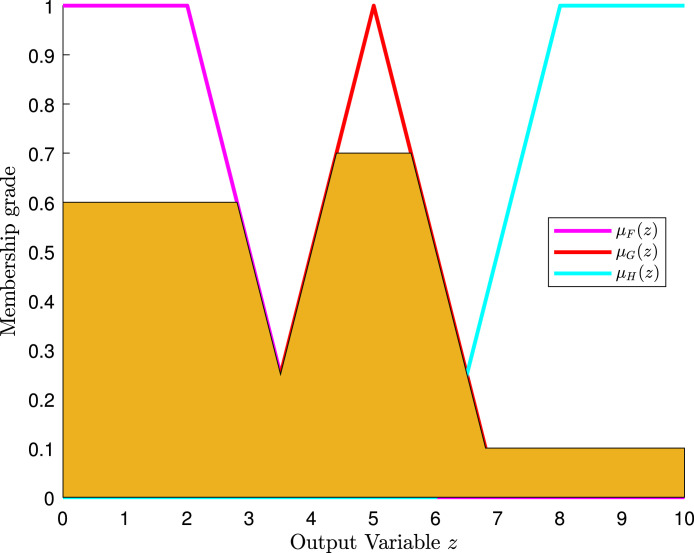
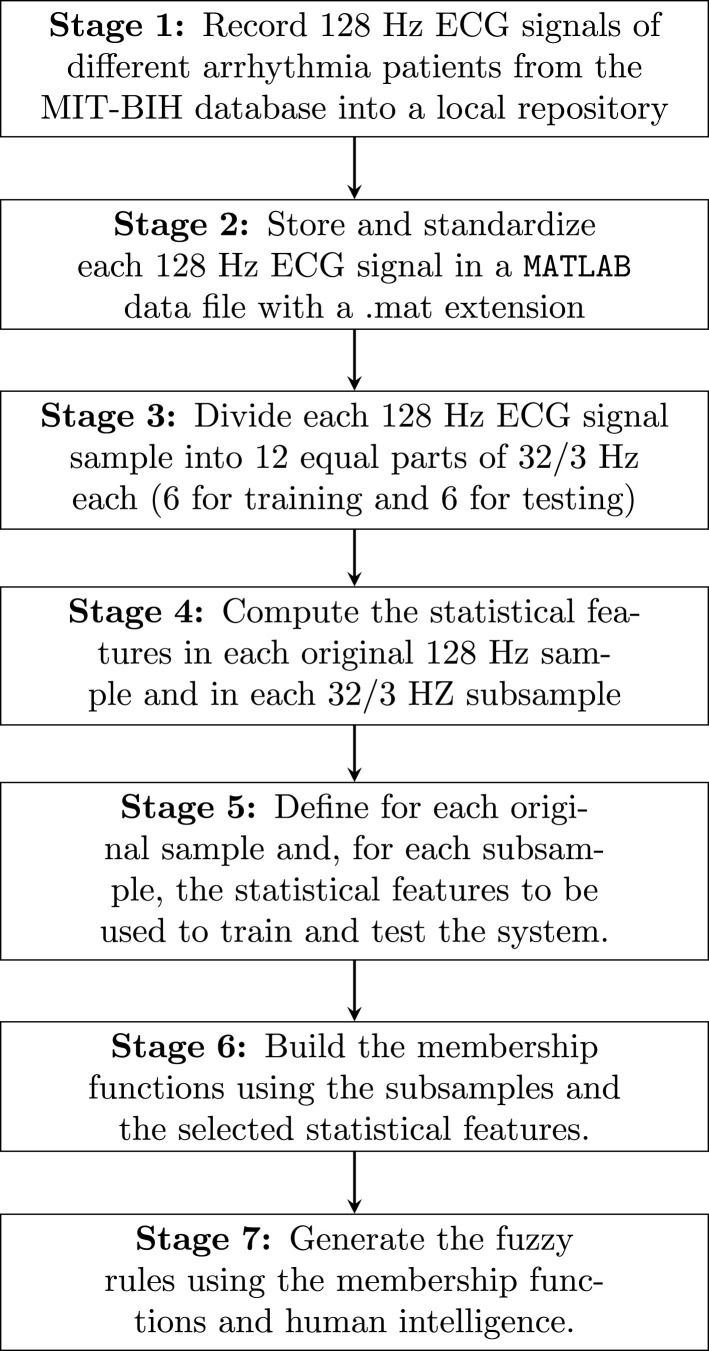
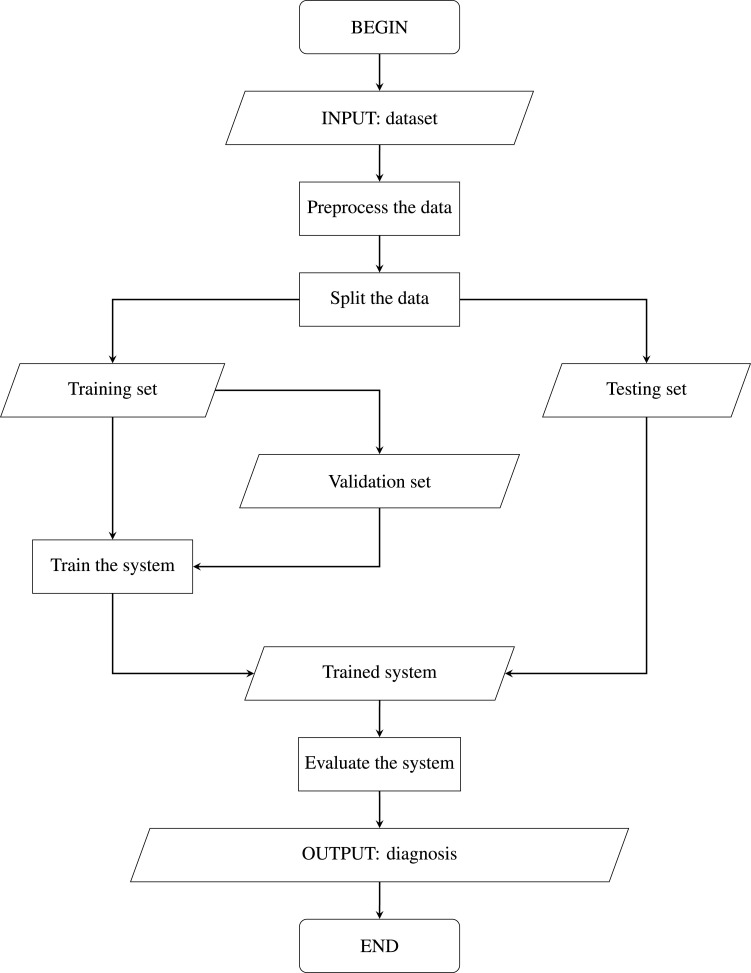
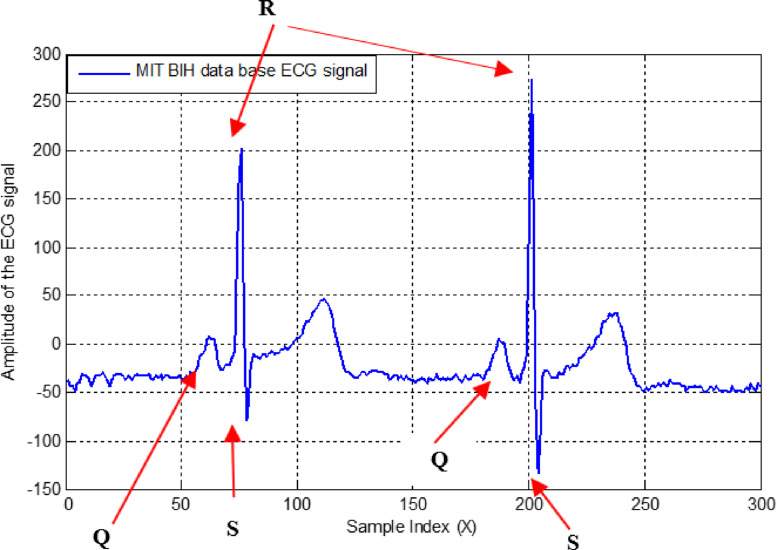
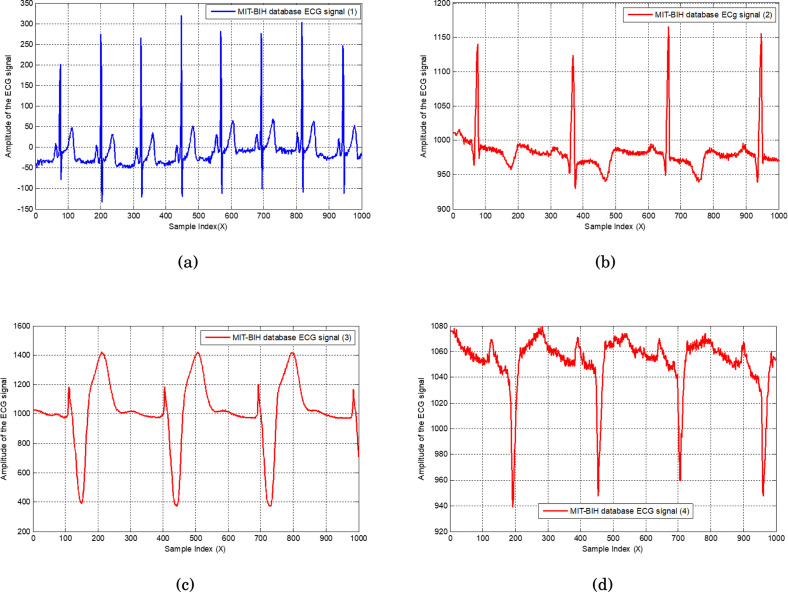
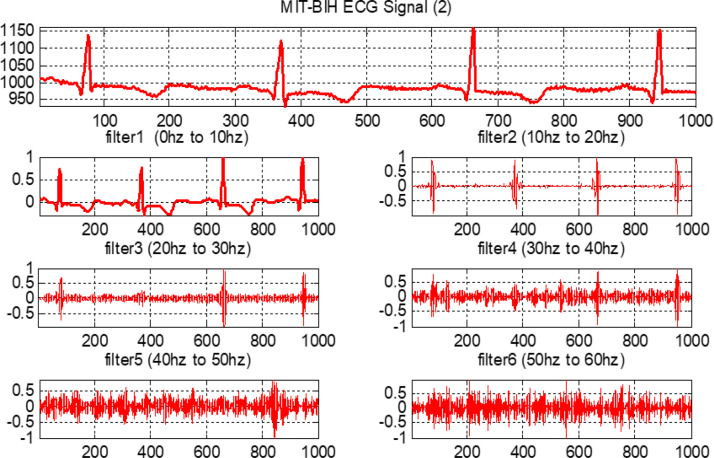
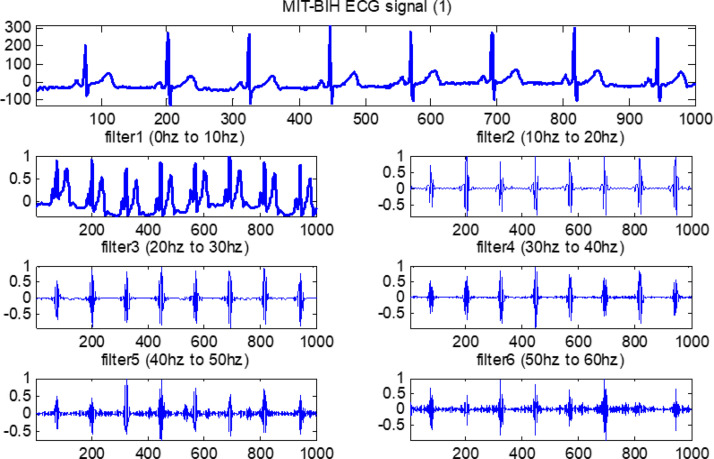
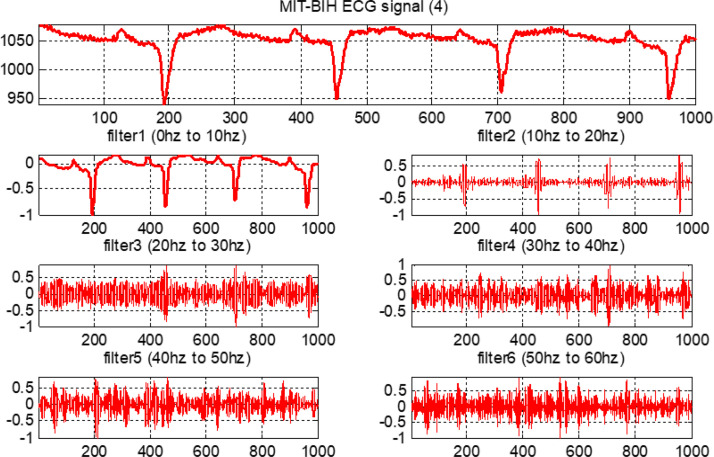
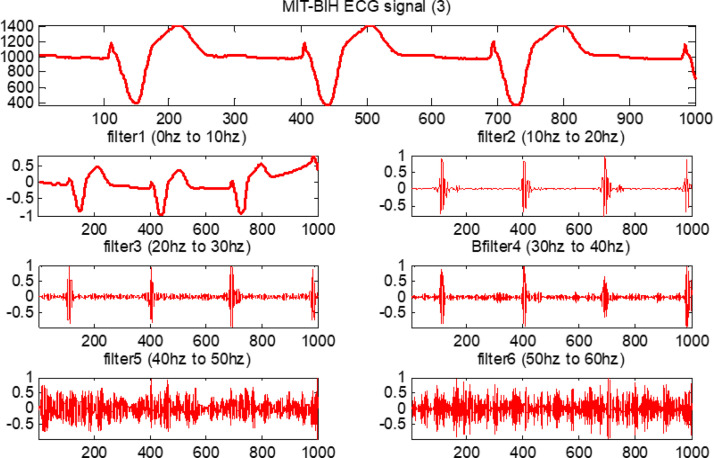
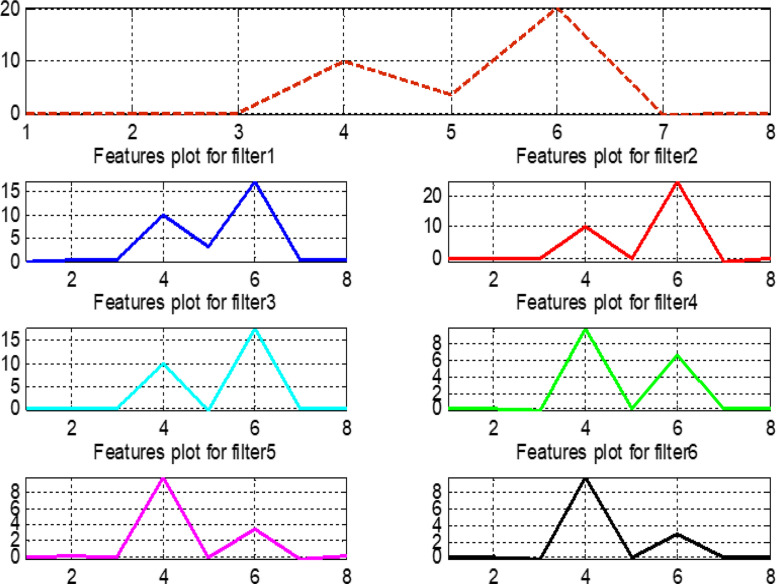
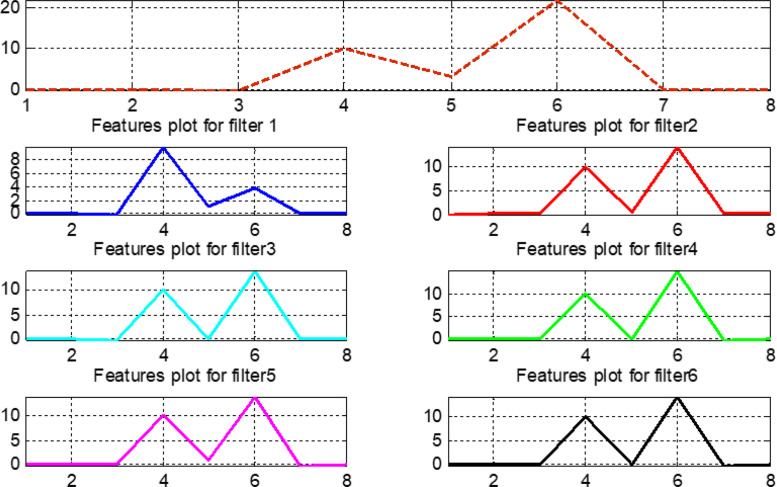
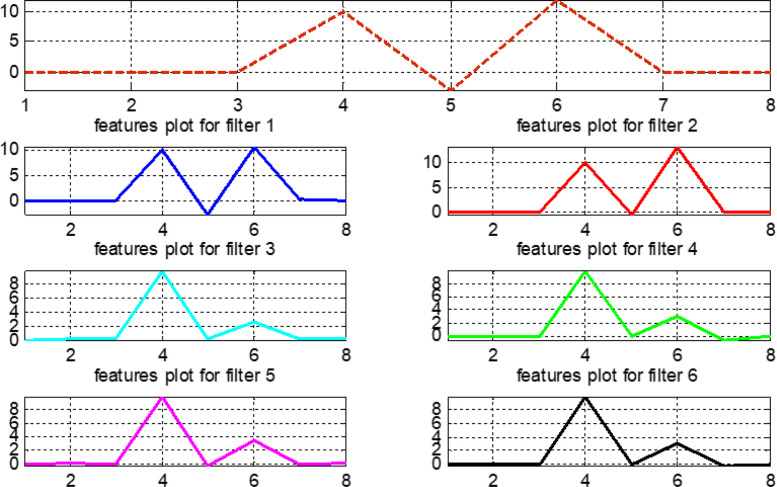
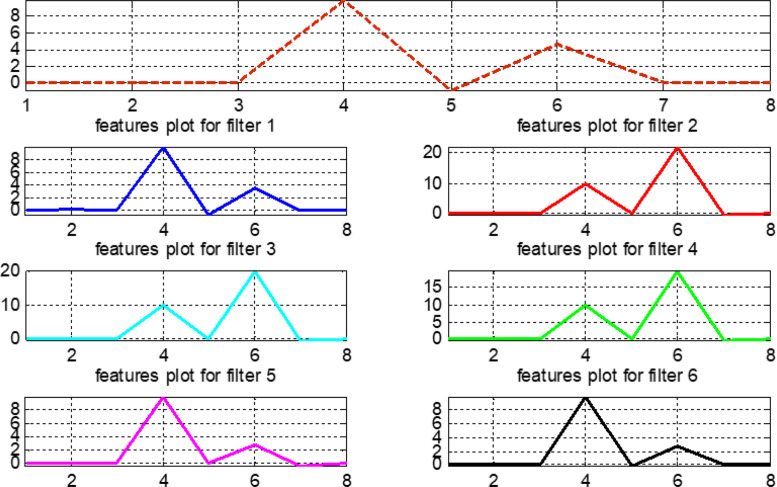
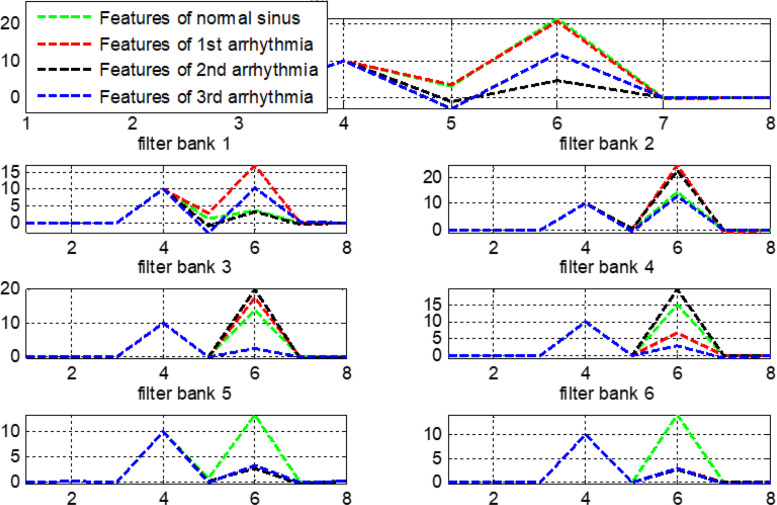
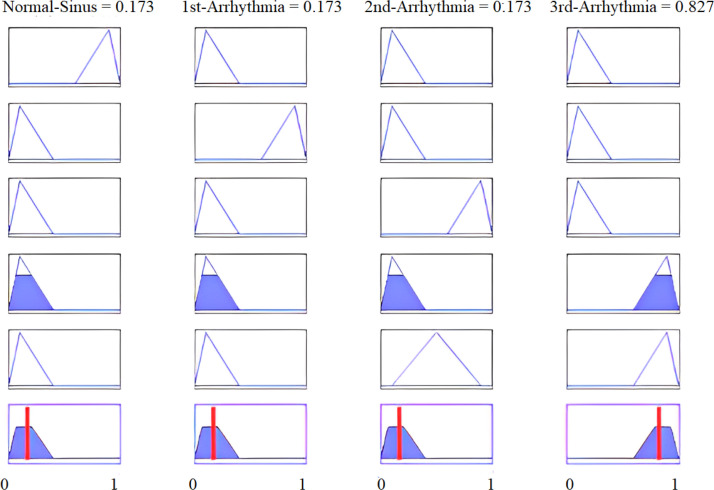
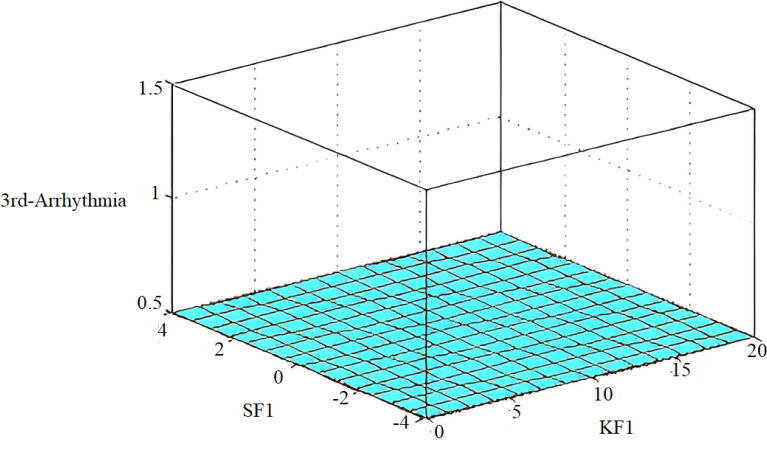
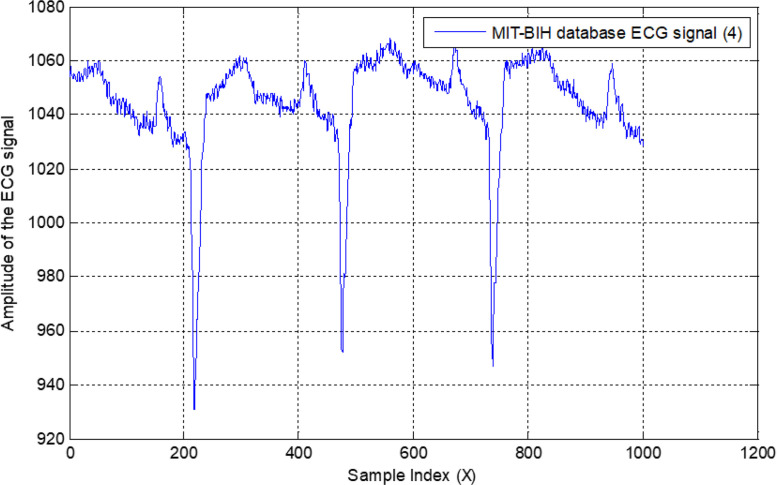
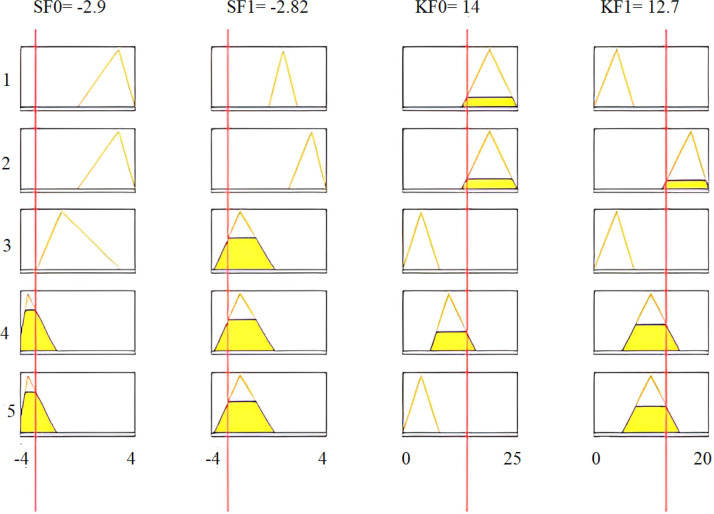
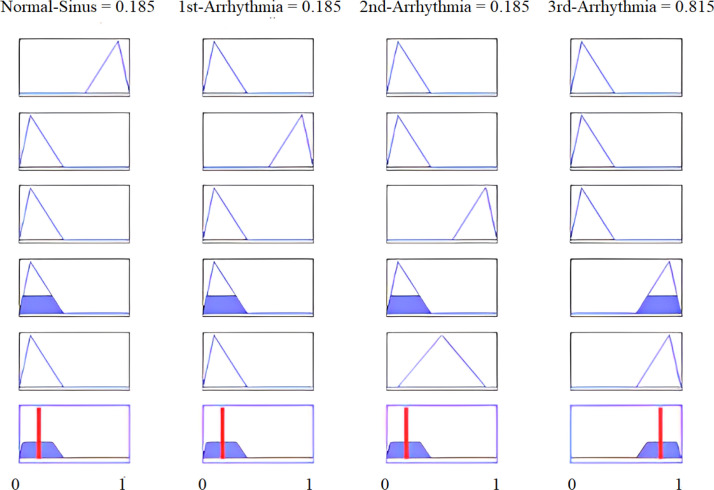
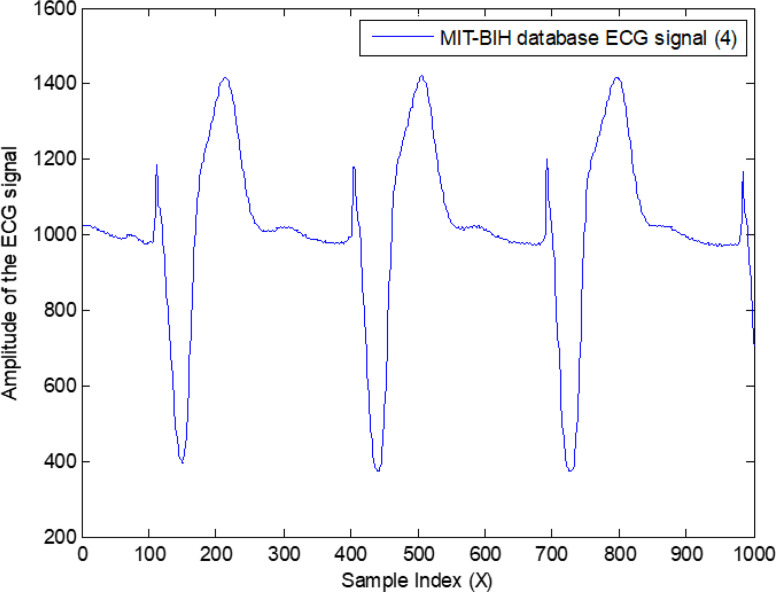
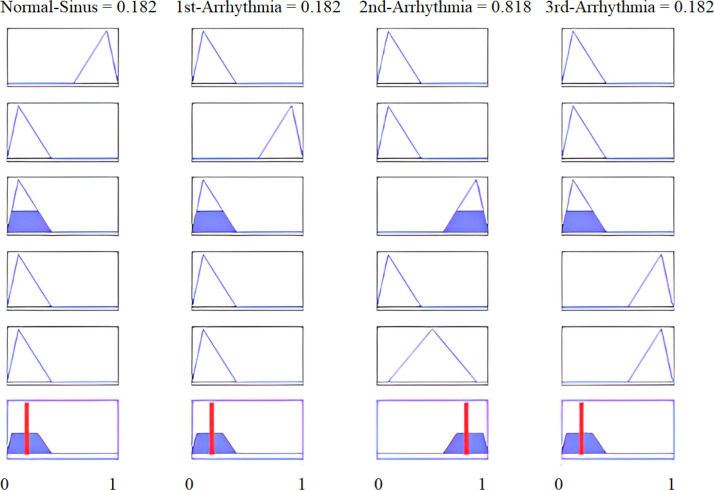
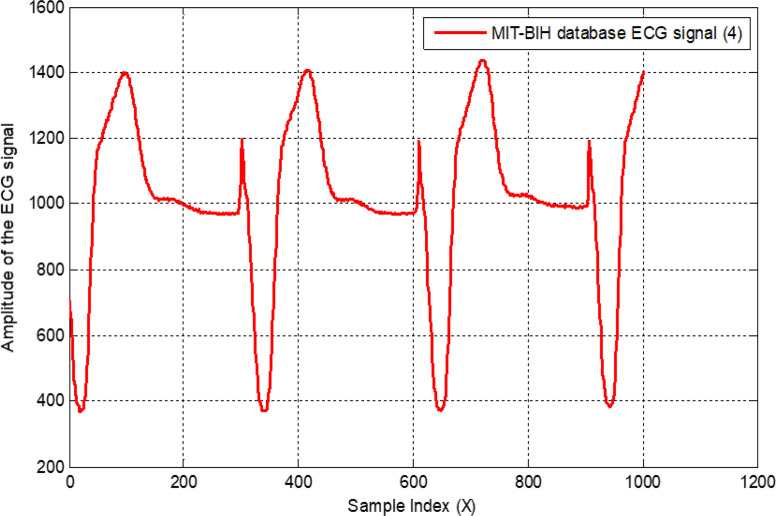
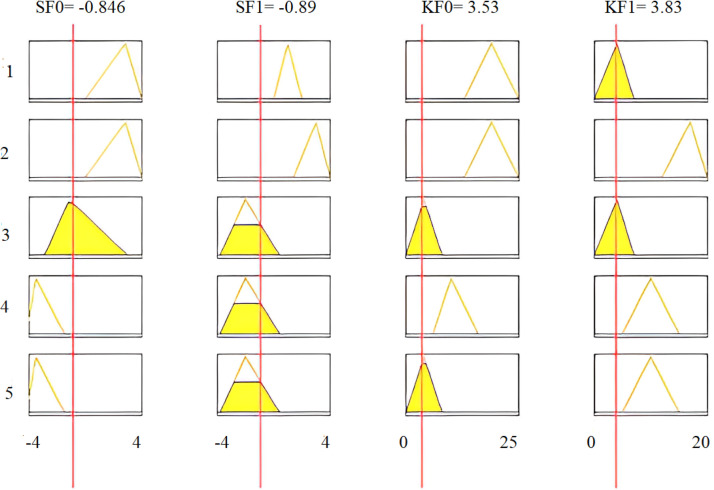
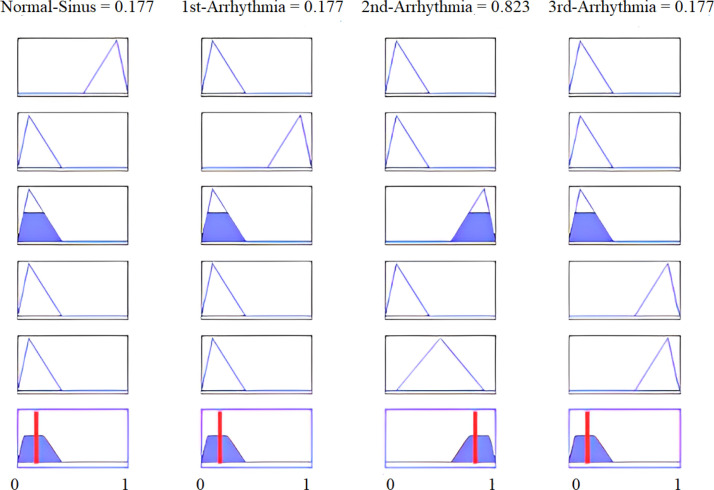
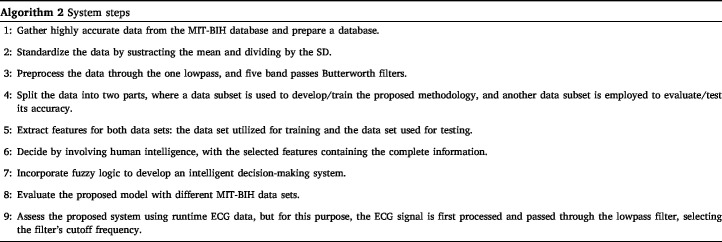
Results: Our implemented system favors remote areas and isolated critical patients. This system utilizes an intelligent algorithm that employs an ECG signal pre-processed by moving through six digital filters. Then, based on the processed results, features are computed and assessed. The intelligent fuzzy system can make an autonomous diagnosis and has enough information to avoid human intervention. The algorithm is trained using ECG data from the MIT-BIH database and achieves high accuracy. In real-time validation, the fuzzy algorithm obtained almost 100% accuracy for all experiments.
Conclusion: Our intelligent system can be helpful in many situations, but it is particularly beneficial for isolated COVID-19 patients who have critical heart arrhythmia and must receive intensive care.
Keywords: Artificial intelligence; Defuzzification; Features extraction; Finite impulse response; Fuzzy membership and rules; Global system for mobile communication; Internet of things; MIT-BIH database; QRS peaks; SARS-CoV-2.
Copyright © 2023 Elsevier Ltd. All rights reserved.
Conflict of interest statement
Declaration of Competing Interest The authors declare that they have no known competing financial interests or personal relationships that could have appeared to influence the work reported in this paper.
Figures


References
-
- Hu R., Chen J., Zhou L. A transformer-based deep neural network for arrhythmia detection using continuous ECG signals. Comput. Biol. Med. 2022;144 - PubMed
-
- P.S. Hamilton, W.J. Tompkins, Adaptive matched filtering for QRS detection, in: Proceedings of the 10th Annual International Conference of the IEEE in Medicine and Biology Society, 1988, pp. 147–148.
-
- Singh J.P., Larson M.G., O’Donnell C.J., Wilson P.F., Tsuji H., Lloyd-Jones D.M., Levy D. Association of hyperglycemia with reduced heart rate variability (The Framingham Heart Study) Am. J. Cardiol. 2000;86:309–312. - PubMed
-
- Forsström J., Forsström J., Heinonen E., Välimäki I., Antila K. Effects of haemodialysis on heart rate variability in chronic renal failure. Scand. J. Clin. Lab. Invest. 1986;46:665–670. - PubMed
-
- Holsinger W.P., Kempner K.M., Miller M.H. A QRS preprocessor based on digital differentiation. IEEE Trans. Biomed. Eng. 1971;3:212–217.
Publication types
MeSH terms
LinkOut - more resources
Full Text Sources
Medical
Miscellaneous
