. 2023 Jun;22(3):e12839.
doi: 10.1111/gbb.12839. Epub 2023 Jan 30.

Morphological and sensorimotor phenotypes in a zebrafish CHARGE syndrome model are domain-dependent

Affiliations

Morphological and sensorimotor phenotypes in a zebrafish CHARGE syndrome model are domain-dependent

Dana R Hodorovich et al. Genes Brain Behav. 2023 Jun.

Abstract

CHARGE syndrome is a heterogeneous disorder characterized by a spectrum of defects affecting multiple tissues and behavioral difficulties such as autism, attention-deficit/hyperactivity disorder, obsessive-compulsive disorder, anxiety, and sensory deficits. Most CHARGE cases arise from de novo, loss-of-function mutations in chromodomain-helicase-DNA-binding-protein-7 (CHD7). CHD7 is required for processes such as neuronal differentiation and neural crest cell migration, but how CHD7 affects neural circuit function to regulate behavior is unclear. To investigate the pathophysiology of behavioral symptoms in CHARGE, we established a mutant chd7 zebrafish line that recapitulates multiple CHARGE phenotypes including ear, cardiac, and craniofacial defects. Using a panel of behavioral assays, we found that chd7 mutants have specific auditory and visual behavior deficits that are independent of defects in sensory structures. Mauthner cell-dependent short-latency acoustic startle responses are normal in chd7 mutants, while Mauthner-independent long-latency responses are reduced. Responses to sudden decreases in light are also reduced in mutants, while responses to sudden increases in light are normal, suggesting that the retinal OFF pathway may be affected. Furthermore, by analyzing multiple chd7 alleles we observed that the penetrance of morphological and behavioral phenotypes is influenced by genetic background but that it also depends on the mutation location, with a chromodomain mutation causing the highest penetrance. This pattern is consistent with analysis of a CHARGE patient dataset in which symptom penetrance was highest in subjects with mutations in the CHD7 chromodomains. These results provide new insight into the heterogeneity of CHARGE and will inform future work to define CHD7-dependent neurobehavioral mechanisms.

Keywords: CHARGE syndrome; CRISPR/Cas9; behavior; chd7; zebrafish.


Conflict of interest statement

The authors declare no competing or financial interests.

Figures
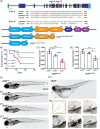
FIGURE 1
FIGURE 1
CRISPR/Cas9 generated chd7 mutants recapitulate CHARGE syndrome related phenotypes. (A) Exon‐intron structure of zebrafish chd7 with CRISPR exon 9 and exon 16 targeted regions noted; amino acid alignment and conservation of Exon 9, 2nd chromodomain target across species, identified 7 bp deletion from mutagenesis; amino acid alignment of Exon 16, ATP‐helicase domain target, and identified 1 bp deletion from mutagenesis; predicted Chd7 protein domains in wild‐type (top), ATP‐helicase domain 1 bp deletion allele (chd7 rdu1002/rdu1002 ), and chromodomain 7 bp deletion allele (chd7 ncu101/ncu101 ), additional target regions from sgRNAs noted. (B) Survival rate (%) of chd7 +/+ (n = 19), chd7 ncu101/+ (n = 54), and chd7 ncu101/ncu101 (n = 25) siblings during a 30‐day period. (C) qPCR analysis of chd7 mRNA in 5 dpf larvae (chd7 ncu101/, chromodomain allele), normalized to wild‐type siblings. Each point represents a biological replicate of pooled larvae (per pool, chd7 +/+ n ~ 12–13; chd7 ncu101/+ n ~ 20–21; chd7 ncu101/ncu101 n ~ 13–14). (D) qPCR analysis of chd7 mRNA in 5 dpf larvae (chd7 rdu1002/, ATP‐helicase domain allele), normalized to wild‐type siblings. Each point represents a biological replicate of pooled larvae (per pool, chd7 +/+ n ~ 13–14; chd7 rdu1002/− n ~ 22–23; chd7 rdu1002/rdu1002 n ~ 11–12) (mean ± SD, Ordinary one‐way ANOVA with Tukey's multiple comparisons, *p < 0.05, **p < 0.01, ***p < 0.001,****p < 0.0001). (E) Bright‐field images of 5 dpf larvae (chd7 +/+, chd7 ncu101/+, chd7 ncu101/ncu101 ) with examples of morphological phenotypes including uninflated swim bladder (asterisk), pericardial edema (triangle), and craniofacial defects (solid triangle). (F) Examples of varying otolith defects in chd7 ncu101/, dashed orange lines represent morphology of the otic vesicle, and anterior and posterior otoliths.
FIGURE 2
FIGURE 2
Loss of chd7 induces a context‐dependent LLC phenotype in auditory driven behaviors. (A) Acoustic startle responses, average short‐latency c‐bend (SLC) frequency as acoustic stimulus intensity increases (chd7 +/+ n = 64, chd7 ncu101/+ n = 127, chd7 ncu101/ncu101 n = 61) (mean ± SEM). (B) Short‐latency c‐bend sensitivity index, calculated by the area under the SLC frequency curves for individual larvae (mean ± SD, Ordinary one‐way ANOVA with Tukey's multiple comparison). (C) Long‐latency c‐bend (LLC) frequency as acoustic stimulus intensity increases (mean ± SEM). (D) Long‐latency c‐bend sensitivity index calculated by the area under the LLC frequency curves for individual larvae (mean ± SD, Kruskal‐Wallis with Dunn's multiple comparisons). (E) Short‐term habituation, average SLC frequency during 30 acoustic stimuli at highest intensity (chd7 +/+ n = 40, chd7 ncu101/+ n = 82, chd7 ncu101/ncu101 n = 47) (mean ± SEM). (F) SLC half‐life calculated by nonlinear regression (one‐phase exponential decay) of SLC frequency curves for individual larvae (mean ± SD, Kruskal‐Wallis with Dunn's multiple comparisons). (G) Average LLC frequency during 30 acoustic stimuli at highest intensity (mean ± SEM). (H) LLC sensitivity index calculated by the area under the LLC frequency curves for individual larvae (mean ± SD, Kruskal‐Wallis with Dunn's multiple comparisons, *p < 0.05, **p < 0.01, ***p < 0.001,****p < 0.0001).
FIGURE 3
FIGURE 3
LLC deficit is independent of otolith morphology in chd7 chromodomain mutants. (A) Acoustic startle responses, average short‐latency c‐bend (SLC) frequency comparing chd7 ncu101/+ and chd7 ncu101/ncu101 with or without otolith defects (chd7 +/+ n = 11, chd7 ncu101/+ w/o otolith defect n = 22, chd7 ncu101/+ with otolith defect n = 17, chd7 ncu101/ncu101 w/o otolith defect n = 8, chd7 ncu101/ncu101 with otolith defect n = 11) (mean ± SEM). (B) Short‐latency c‐bend sensitivity index, calculated by the area under the SLC frequency curves for individual larvae (mean ± SD, Ordinary one‐way ANOVA with Tukey's multiple comparison). (C) Long‐latency c‐bend (LLC) frequency as acoustic stimulus intensity increases (mean ± SEM). (D) Long‐latency c‐bend sensitivity index calculated by the area under the LLC frequency curves for individual larvae (mean ± SD, Ordinary one‐way ANOVA with Tukey's multiple comparison, **p < 0.01, ****p < 0.0001).
FIGURE 4
FIGURE 4
Hypo‐ and hyper‐activity phenotypes in chromodomain and ATP‐helicase domain mutants. (A) Chromodomain larval dark‐flash and (B) light‐flash response frequencies (chd7 +/+ n = 37, chd7 ncu101/+ n = 69, chd7 ncu101/ncu101 n = 26) (mean ± SD, Ordinary one‐way ANOVA with Tukey's multiple comparison, **p < 0.01). (C) Chromodomain larval average total distance traveled plot during 9 h of recording, analyzed every 30 min, including 1 h of acclimation in the dark, 4 h in the dark, and 4 h in light (chd7 +/+ n = 44, chd7 ncu101/+ n = 70, chd7 ncu101/ncu101 n = 26) (mean ± SEM). (D) Chromodomain larval area under the curve for individual distance plots during the dark or light phase (mean ± SD, Ordinary one‐way ANOVA with Dunnett's multiple comparisons, *p < 0.05). (E) ATP‐helicase domain larval average total distance traveled (chd7 +/+ n = 22, chd7 rdu1002/+ n = 42, chd7 rdu1002/rdu1002 n = 20) (mean ± SEM) and (F) area under the curve during the dark or light phase (mean ± SEM (G) chromodomain larval total distance time plot during 18.5 min of recording (chd7 +/+ n = 46, chd7 ncu101/+ n = 67, chd7 ncu101/ncu101 n = 29) (mean ± SEM). (H) Sum of total distance traveled for individual larvae, (I) swim (open bars) and turn (shaded bars) frequencies (mean ± SD, Kruskal‐Wallis with Dunn's multiple comparisons).
FIGURE 5
FIGURE 5
CRISPR guides targeting different chd7 Exons induce varying phenotypes. (A) Acoustic startle responses, average short‐latency c‐bend (SLC) frequency as acoustic stimulus intensity increases (Control n = 47, Exon 3 n = 66, Exon 9 n = 60, Exon 30 n = 54, Mix n = 45) (mean ± SEM). (B) Short‐latency c‐bend sensitivity index, calculated by the area under the SLC frequency curves for individual larvae (mean ± SD, Ordinary one‐way ANOVA with Dunnett's multiple comparisons). (C) Long‐latency c‐bend (LLC) frequency as acoustic stimulus intensity increases (mean ± SEM). (D) Long‐latency c‐bend sensitivity index calculated by the area under the LLC frequency curves for individual larvae (mean ± SD, Ordinary one‐way ANOVA with Dunnett's multiple comparisons). (E) Short‐term habituation, average SLC frequency (Control n = 48, Exon 3 n = 61, Exon 9 n = 59, Exon 30 n = 57, Mix n = 49) (mean ± SEM) during 30 acoustic stimuli at highest intensity with (inset) SLC half‐life calculated by nonlinear regression (one‐phase exponential decay) of SLC frequency curves for individual larvae (mean ± SD, Ordinary one‐way ANOVA with Dunnett's multiple comparisons). (F) Average LLC frequency (mean ± SEM) during 30 acoustic stimuli at highest intensity with (inset) LLC sensitivity index calculated by the area under the LLC frequency curves for individual larvae (mean ± SD, Ordinary one‐way ANOVA with Dunnett's multiple comparisons). (G) Average total distance traveled plot during 9 h of recording, analyzed every 30 min, including 1 h of acclimation, 4 h in the dark, and 4 h in light (Control n = 54, Exon 3 n = 27, Exon 9 n = 30, Exon 30 n = 31, Mix n = 31) (mean ± SEM). (H) Area under the curve for individual larvae distance plots during the dark or light phase (mean ± SD, Ordinary one‐way ANOVA with Dunnett's multiple comparisons, *p < 0.05, ***p < 0.001,****p < 0.000).
FIGURE 6
FIGURE 6
Correlation of mutation location and phenotype penetrance in a cohort of CHARGE patients. Heat map displaying the frequency of patients with a specified phenotype and a mutation within a particular CHD7 domain; domains were determined by amino acid alignments (n = 89, n = 30 patients excluded from the original pool of 119 participants because of insufficient information or mutation did not align to a domain). CHD7 domains are represented by columns and phenotypes are represented by rows. Frequencies were calculated by the number of patients with a reported phenotype and mutation in the respective domain over the total number of patients within the same domain (purples). Final row represents the overall average phenotype frequency for a specific domain (oranges). Patient data was obtained from the paper Phenotype and genotype analysis of a French cohort of 119 patients with CHARGE syndrome, Legendre et al. Darker colors indicate a higher frequency, with ranges indicated in the legends. CNS, central nervous system; IUGR, intrauterine growth restriction; SCC, semicircular canal.

References

    1. Zentner GE, Layman WS, Martin DM, Scacheri PC. Molecular and phenotypic aspects of CHD7 mutation in CHARGE syndrome. Am J Med Genet A. 2010;152A:674‐686. - PMC - PubMed
    1. Verloes A. Updated diagnostic criteria for CHARGE syndrome: a proposal. Am J Med Genet A. 2005;133A:306‐308. - PubMed
    1. Blake KD, Hartshorne TS, Lawand C, Dailor AN, Thelin JW. Cranial nerve manifestations in CHARGE syndrome. Am J Med Genet A. 2008;146A:585‐592. - PubMed
    1. Blake KD, Prasad C. CHARGE syndrome. Orphanet J Rare Dis. 2006;1:34. - PMC - PubMed
    1. Blake KD, Salem‐Hartshorne N, Daoud MA, Gradstein J. Adolescent and adult issues in CHARGE syndrome. Clin Pediatr. 2005;44:151‐159. - PubMed

Publication types

Substances

LinkOut - more resources