. 2023 Nov;72(11):2123-2137.
doi: 10.1136/gutjnl-2022-327202. Epub 2023 Jan 30.

Phenotypic CD8 T cell profiling in chronic hepatitis B to predict HBV-specific CD8 T cell susceptibility to functional restoration in vitro

Affiliations

Phenotypic CD8 T cell profiling in chronic hepatitis B to predict HBV-specific CD8 T cell susceptibility to functional restoration in vitro

Marzia Rossi et al. Gut. 2023 Nov.

Abstract

Objective: Exhausted hepatitis B virus (HBV)-specific CD8 T cells in chronic HBV infection are broadly heterogeneous. Characterisation of their functional impairment may allow to distinguish patients with different capacity to control infection and reconstitute antiviral function.

Design: HBV dextramer+CD8 T cells were analysed ex vivo for coexpression of checkpoint/differentiation markers, transcription factors and cytokines in 35 patients with HLA-A2+chronic hepatitis B (CHB) and in 29 control HBsAg negative CHB patients who seroconverted after NUC treatment or spontaneously. Cytokine production was also evaluated in HBV peptide-stimulated T cell cultures, in the presence or absence of antioxidant, polyphenolic, PD-1/PD-L1 inhibitor and TLR-8 agonist compounds and the effect on HBV-specific responses was further validated on additional 24 HLA-A2 negative CHB patients.

Results: Severely exhausted HBV-specific CD8 T cell subsets with high expression of inhibitory receptors, such as PD-1, TOX and CD39, were detected only in a subgroup of chronic viraemic patients. Conversely, a large predominance of functionally more efficient HBV-specific CD8 T cell subsets with lower expression of coinhibitory molecules and better response to in vitro immune modulation, typically detected after resolution of infection, was also observed in a proportion of chronic viraemic HBV patients. Importantly, the same subset of patients who responded more efficiently to in vitro immune modulation identified by HBV-specific CD8 T cell analysis were also identified by staining total CD8 T cells with PD-1, TOX, CD127 and Bcl-2.

Conclusions: The possibility to distinguish patient cohorts with different capacity to respond to immune modulatory compounds in vitro by a simple analysis of the phenotypic CD8 T cell exhaustion profile deserves evaluation of its clinical applicability.

Keywords: T lymphocytes; cellular immunity; chronic viral hepatitis; immune response.


Conflict of interest statement

Competing interests: CF, Grant: Gilead, Abbvie. Consultant: Gilead, Abbvie, Vir Biotechnology, Arrowhead, Transgene, BMS; PL: advisor and speaker bureau for Gilead, Roche, BMS, GSK, MSD, Arrowhead, Alnylam, Spring Bank, Janssen, EIGER, Myr Pharma; AL: Consultant: MyrPharma, Gilead; MM: advisory board for Abbvie. SD, SPF, AG, JM, MG and LL are employees of and stock-holders in Gilead Sciences. The remaining authors disclose no conflicts.

Figures

Figure 1
Figure 1
Phenotypical analysis of HBV-specific CD8 T cells. (A) Flow chart of the patient cohorts enrolled in the study. Pie plots indicate core18-27-dextramer+ CD8 T cell frequency. (B) PD-1, TOX, CD39, CD127, Bcl-2 and TCF1 MdFI of HBV-core18-27 and influenza-specific CD8 T cells in the indicated study groups and in the negative CD8 population calculated for each specific marker within the total CD8+ T cells (negative control). Box-whisker plots show median values and 5th/95th percentiles; each dot represents a single patient. Statistics by the Kruskal-Wallis with Dunn’s correction test. (C) Representative histogram plots for each parameter. (D) Correlation of exhaustion and differentiation/memory markers by core18-27-specific CD8 T cells in CHB patients. Statistics by the Spearman’s correlation test. CHB, chronic hepatitis B; HBV, hepatitis B virus; MdFI, median fluorescence intensity; NUC RES, NUC resolved patients; SS, spontaneous seroconversion.
Figure 2
Figure 2
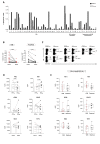
Classification of CHB patients according to CD8 T cells expression of exhaustion and memory/differentiation markers. (A) EI values were defined by PD-1, CD39, TOX, CD127, Bcl-2 and TCF1 expression on core18-27-specific CD8 T cells for each study cohort. Each bar represents an individual patient. The yellow area indicates patients with EI values above 2. (B) Radar plots depict the mean z-Score values of the indicated HBV-specific CD8 T cell exhaustion and memory/differentiation markers. Blue and orange lines indicate z-Score values of patients with high or low EI values, respectively; the grey line NUC-induced and spontaneous anti-HBs seroconverters. (C) Frequencies of PD-1highCD127low/- and CD127+/PD-1+ cells among the core18-27-specific CD8 T cell population (red and grey bars, respectively). Each bar represents an individual patient. (D) Representative FACS plots from two chronic patients with or without the PD-1highCD127low/- subset. (E) PD-1, TOX, CD39, CD127, Bcl-2 and TCF1 expression on core18-27-specific CD8 T cells of CHB patients with high and low EI values. Box-whisker plots as in figure 1; each dot represents a single patient. Statistics by the Mann-Whitney U test. (F) Representative histogram plots for each parameter in each patient cohort. CHB, chronic hepatitis B; EI, Exhaustion Index; HBV, hepatitis B virus.
Figure 3
Figure 3
Different detection rate and phenotype of core18-27-specific and pol455-463-specific CD8 T cells. (A, B) Frequencies of core18-27- and pol455-463-specific CD8 T cells within the total CD8+T cell population from 31 CHB and 18 resolved patients who showed a detectable frequency for at least one HBV dextramer (paired core and polymerase data are illustrated in panel B). (C) Representative FACS plots from two CHB and three resolved patients. (D) PD-1, TOX, CD39, CD127, Bcl-2 and TCF1 expression within core18-27- and pol455-463-specific CD8 T cells from 7 CHB patients; statistics by Wilcoxon matched-pairs test. (E) PD-1, TOX, CD39, CD127, Bcl-2 and TCF1 expression on pol455-463-specific CD8 T cells in CHB and resolved patients (n=10 for both groups). CHB, chronic hepatitis B; HBV, hepatitis B virus.
Figure 4
Figure 4
Ex vivo HBV-specific T cell functional analysis. Cytokine production by HBV-specific and influenza-specific CD8 T cells: (A) representative plots; (B) different patient categories assessed after PBMC stimulation with PMA and Ionomycin (box whisker plots, on the left); CHB patients split according to EI values (right graph). (C) Correlation between cytokine production by the core18-27-specific CD8 T cells and EI in chronic patients with high (orange dots) and low (blue dots) EI, respectively, and in HBV resolved patients (black dots). (D, E) Cytokine production by PD-1highCD127low/- and PD-1+CD127+ HBV-specific CD8 T cells from CHB patients and from PD-1+CD127+ CD8 T cells from the different patient categories. (F) Correlation between cytokine production and Bcl-2 (left graph) or TOX (right graph) expression by core18-27-specific CD8 T cells. Statistics by the Kruskal-Wallis with Dunn’s correction test (B, E) and the Spearman’s correlation test (C, F). CHB, chronic hepatitis B; EI, Exhaustion Index; HBV, hepatitis B virus; NUC RES, NUC resolved patients; PBMC, peripheral blood mononuclear cell; SS, spontaneous seroconversion.
Figure 5
Figure 5
Effect of immune modulatory interventions on the HBV-specific CD8 T cell function. Expansion capacity calculated as the ratio (fold-change) between in vitro and ex vivo frequencies of core18-27 dextramer+ CD8 T cells (A) and percentage of cytokine-positive CD8 T cells (B) in short-term T-cell lines generated by core18-27 peptide stimulation of PBMC from CHB patients with high (n=7) and low (n=13) EI; statistics by Mann-Whitney U test. (C) Percentage of double-positive IFNγ+TNFα+ CD8 T cells in paired short-term T-cell lines generated as in (B) in the presence (treated) or absence (untreated) of Resveratrol (RSV), MitoTempo (MT), anti-PD-L1, a small PD-L1 inhibitor molecule (PD-L1 SM) and a TLR8 agonist (TLR8a) from chronic patients with high (n=7) and low (n=13) EI; statistics by the Wilcoxon-matched-paired test. (D) Delta values of double-positive IFNγ+TNFα+ CD8 T cells derived by subtracting CD8 T cell frequencies of untreated from treated short-term T-cell lines (black lines indicate the median values; statistics by Mann-Whitney U test). (E) Representative examples of cytokine production in two CHB patients. (F) Hierarchical-clustering of HBV-specific CD8 T-cell responses induced by in vitro core18-27 stimulation in presence of the different treatments in chronic patients with high (n=7 orange) and low (n=13 blue) EI. CHB, chronic hepatitis B; EI, Exhaustion Index; HBV, hepatitis B virus; N/A, not available; PBMC, peripheral blood mononuclear cell.
Figure 6
Figure 6
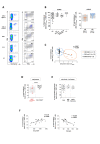
Phenotypic analysis of the total CD8 T cell population. (A) Correlation between logarithmic frequency values of PD-1highCD127low/- T cells among core18-27-specific and total CD8 T cells. (B) Correlations of TCF1, Bcl-2, TOX and CD39 expression in total and HBV-specific CD8 T cells. (C) Representative plots of PD-1high/CD127low/- and TOX+/PD-1high CD8 T cell subsets (yellow boxes) in two CHB patients with high and low EI. (D) Top: phenotypic profiles of total CD8 T cells of individual patients (grey bars) in relation to the corresponding EI values derived from HBV-specific CD8 T cell analysis (black bars, on the left). Red areas indicate the significance threshold for each phenotypic CD8 T cell subpopulation calculated by using a ROC curve analysis based on exhaustion index classification criteria (details in online supplemental materials). In the internal squares, each dot represents the frequency of total CD8 T cells expressing the indicated phenotypic profile in chronic patients with high or low EI (Mann-Whitney test). Bottom: correlation between frequency of cytokine positive core18-27-specific CD8 T cells ex vivo and frequency of PD-1high/TOXhigh, PD-1high/TOXhigh/ Bcl-2-, PD-1high/TOXhigh/CD127- or PD-1high/TOXhigh/TCF1- among total CD8 T cells in CHB patients. Statistics by the Spearman’s correlation test (A, B, D). CHB, chronic hepatitis B; EI, Exhaustion Index; HBV, hepatitis B virus; ROC, receiver operating characteristic.
Figure 7
Figure 7
CD8 T cell phenotype can predict recovery of multi-specific T cell responses to immune modulation. Delta values of IFNγ+, TNFα+ and double-positive IFNγ+TNFα+ CD8 T cells derived by subtracting CD8 T cell frequencies of untreated from treated short-term T-cell lines generated by stimulation of PBMC from CHB patients (n=32) with 15-mer overlapping HBV core and polymerase peptide pools. Data are shown as sum of T cell responses against the two antigens. (A) Segregation of individual CD8 T cell responses to core and polymerase peptides based on the PD-1highTOXhigh CD8 T cell frequency threshold (0.4% value) previously obtained using an ROC curve analysis as illustrated in figure 6D. Statistics by the Mann-Whitney U test. (B–D) Correlation between PD-1highTOXhigh CD8 T cell subset frequency and percentage of IFNγ+, TNFα+ and double-positive IFNγ+TNFα+ CD8 T cells in short-term T-cell lines generated as described above, illustrated for each immune modulation (B), as cumulative data of all treatments (C) and as numbers of immune modulatory agents able to induce a positive response (D). Statistics by the Spearman’s correlation test. (E) Representative examples of cytokine production in a CHB patient with low PD-1highTOXhigh CD8 T cell frequency. CHB, chronic hepatitis B; HBV, hepatitis B virus; PBMC, peripheral blood mononuclear cell.
Figure 8
Figure 8
Impact of mutations on core18-27-specific CD8 T cell responses. (A) Ex vivo frequency of wild-type-specific or variant-specific core18-27 CD8 T cells by staining with the corresponding wild-type of mutated peptide HLA class I dextramers from seven CHB patients; next to each dot, the CHB patient ID number is indicated; statistics by Wilcoxon matched-pairs test. (B) Ratio (fold-change) between the MdFI values of the indicated phenotypic markers expressed by CD8 T cells targeting the mutated or the wild-type core18-27 epitopes (left graph) and EI values defined by PD-1, CD39, TOX, CD127, Bcl-2 and TCF1 expression (right graph). (C) Percentage of cytokine-positive CD8 T cells in short-term T-cell lines generated by WT or mutated core18-27 peptide stimulation of PBMCs from seven CHB patients. The column chart represents median values (upper), while the dot graph shows individual patient responses to wild-type and mutated peptides (lower); statistics by the Wilcoxon-signed-rank test. (D) Dot-plots of ex vivo frequencies of wild-type- or mutated-specific core18-27 CD8 T cells in CHB patients 2, 5, 1. On the right, the corresponding graphs illustrating frequency, phenotype (EI) and function are shown. CHB, chronic hepatitis B; EI, Exhaustion Index; MdFI, median fluorescence intensity; PBMC, peripheral blood mononuclear cell.

Comment in

References

    1. Bertoletti A, Ferrari C. Adaptive immunity in HBV infection. J Hepatol 2016;64:S71–83. 10.1016/j.jhep.2016.01.026 - DOI - PubMed
    1. Fisicaro P, Barili V, Rossi M, et al. . Pathogenetic mechanisms of T cell dysfunction in chronic HBV infection and related therapeutic approaches. Front Immunol 2020;11:849 10.3389/fimmu.2020.00849 - DOI - PMC - PubMed
    1. McLane LM, Abdel-Hakeem MS, Wherry EJ. CD8 T cell exhaustion during chronic viral infection and cancer. Annu Rev Immunol 2019;37:457–95. 10.1146/annurev-immunol-041015-055318 - DOI - PubMed
    1. Wieland D, Kemming J, Schuch A, et al. . TCF1+ hepatitis C virus-specific CD8+ T cells are maintained after cessation of chronic antigen stimulation. Nat Commun 2017;8:15050 10.1038/ncomms15050 - DOI - PMC - PubMed
    1. Khan O, Giles JR, McDonald S, et al. . TOX transcriptionally and epigenetically programs CD8+ T cell exhaustion. Nature 2019;571:211–8. 10.1038/s41586-019-1325-x - DOI - PMC - PubMed

Publication types

MeSH terms

Substances