. 2023 Jan 30;6(4):e202201690.
doi: 10.26508/lsa.202201690. Print 2023 Apr.

Cardiac Plin5 interacts with SERCA2 and promotes calcium handling and cardiomyocyte contractility

Affiliations

Cardiac Plin5 interacts with SERCA2 and promotes calcium handling and cardiomyocyte contractility

Mathieu Cinato et al. Life Sci Alliance. .

Abstract

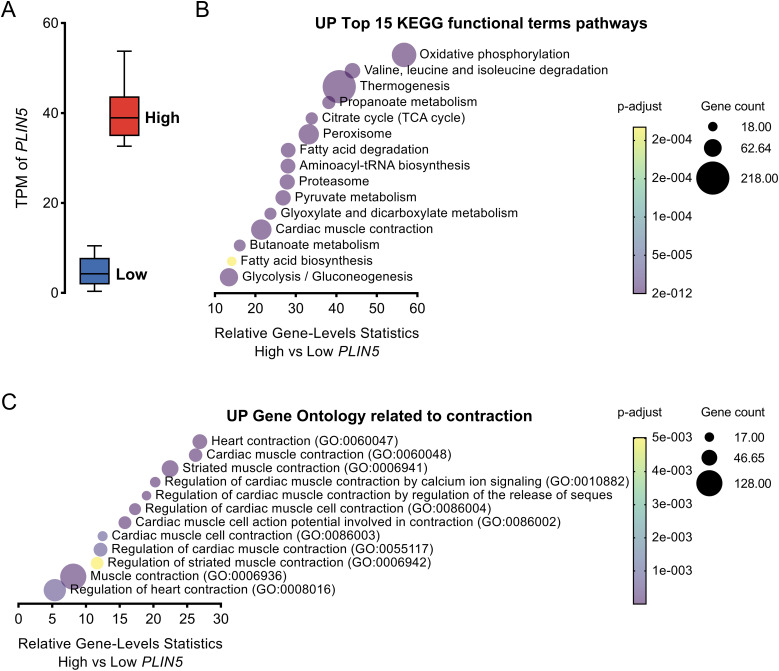
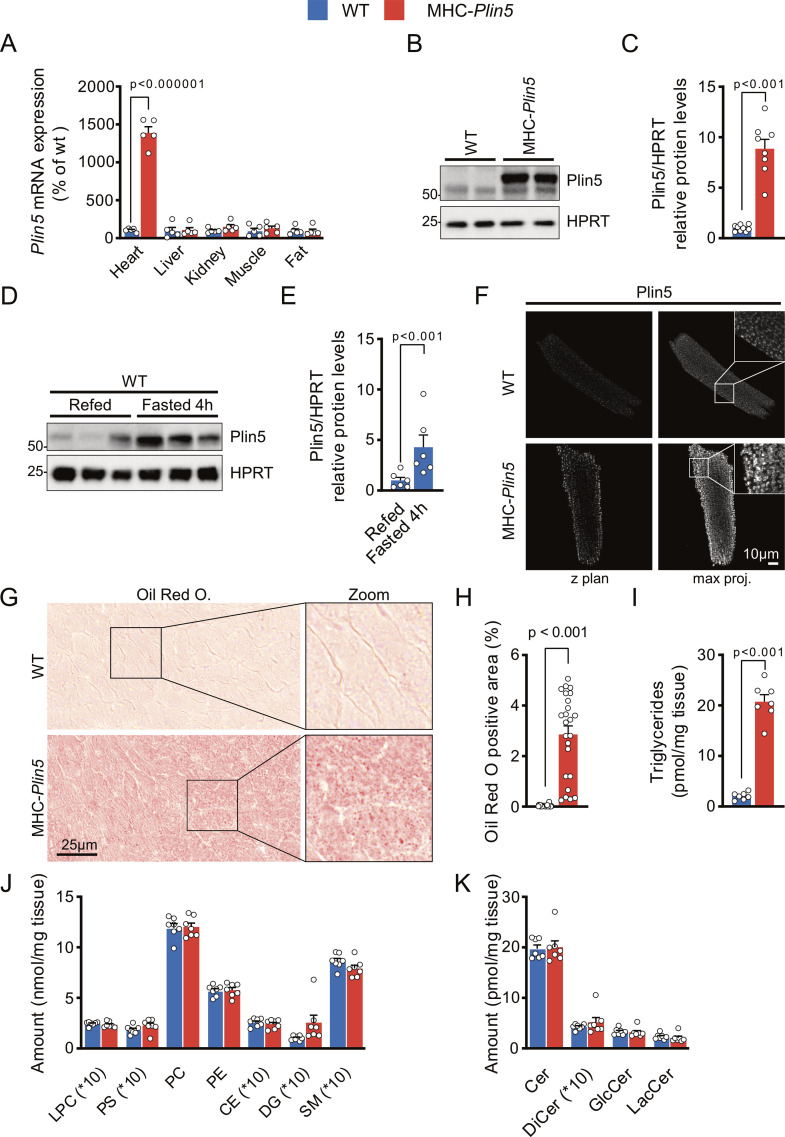
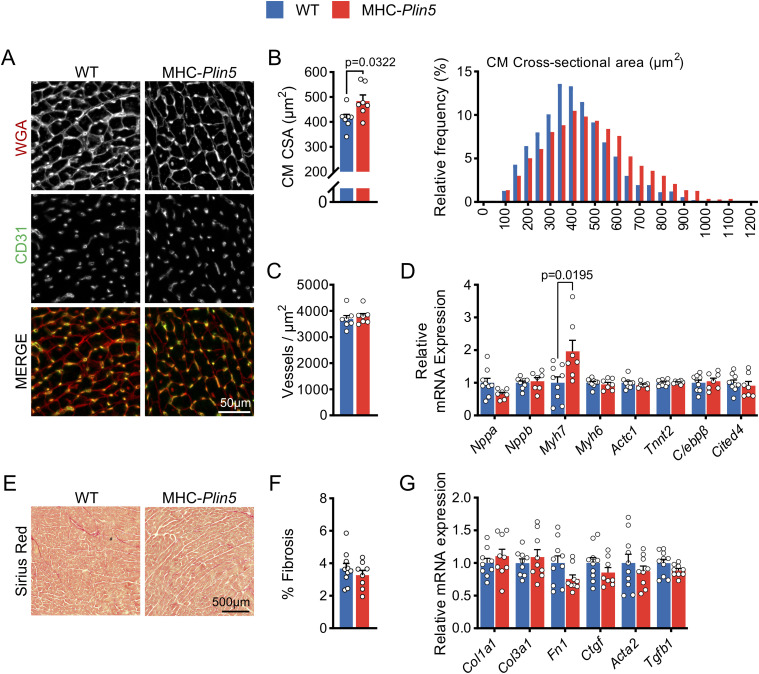
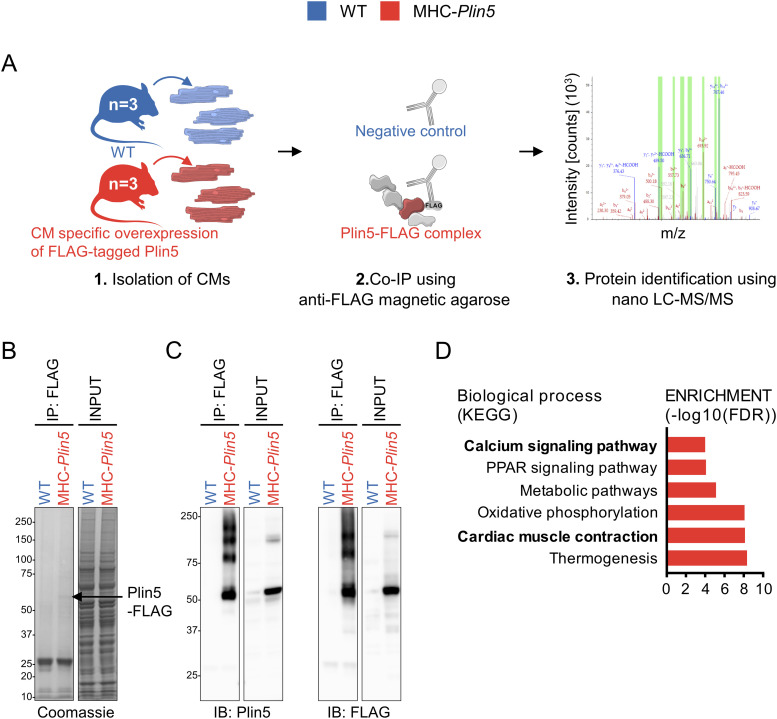
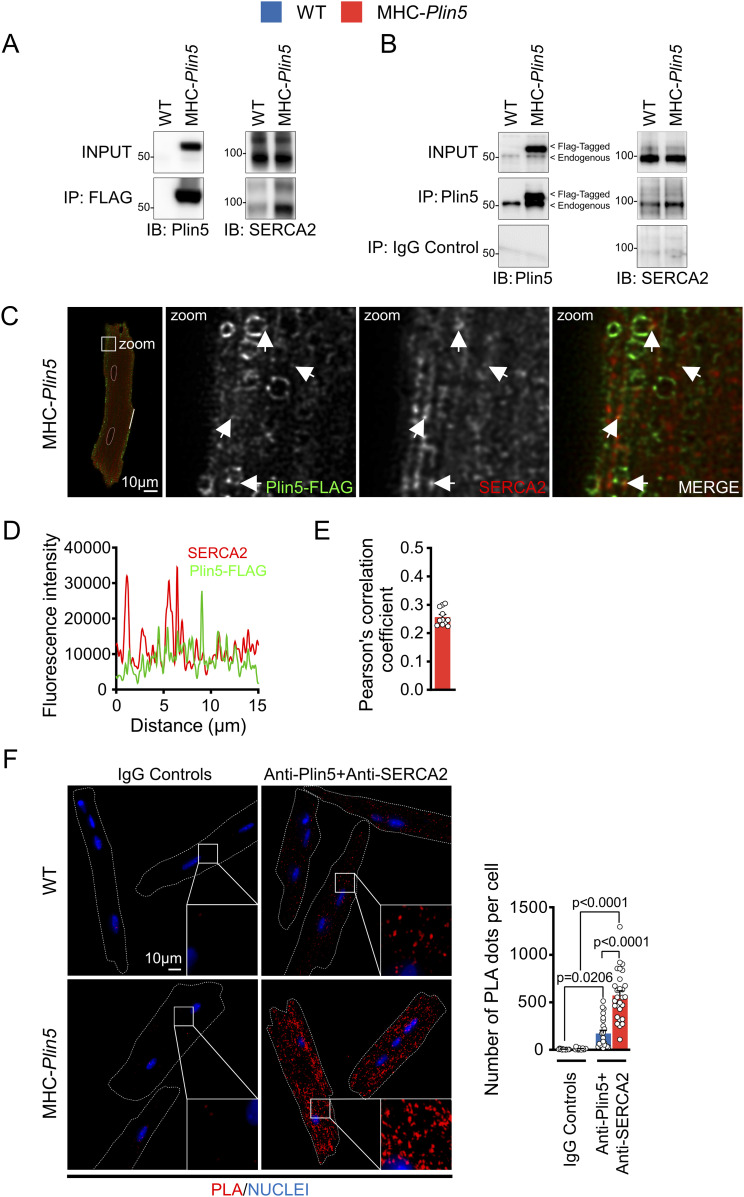
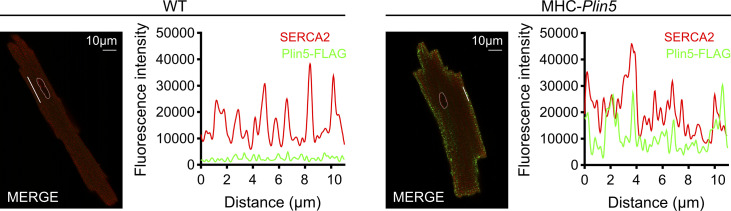
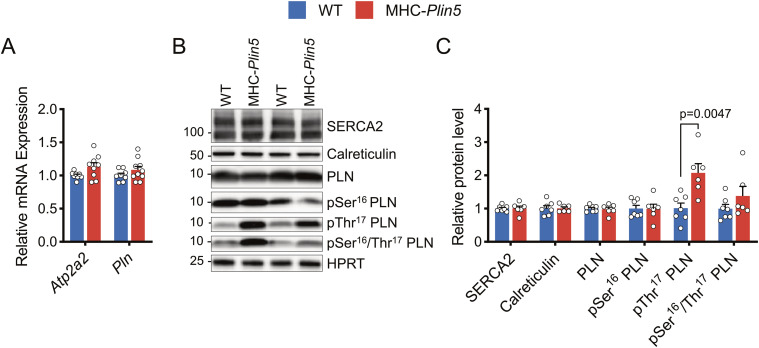
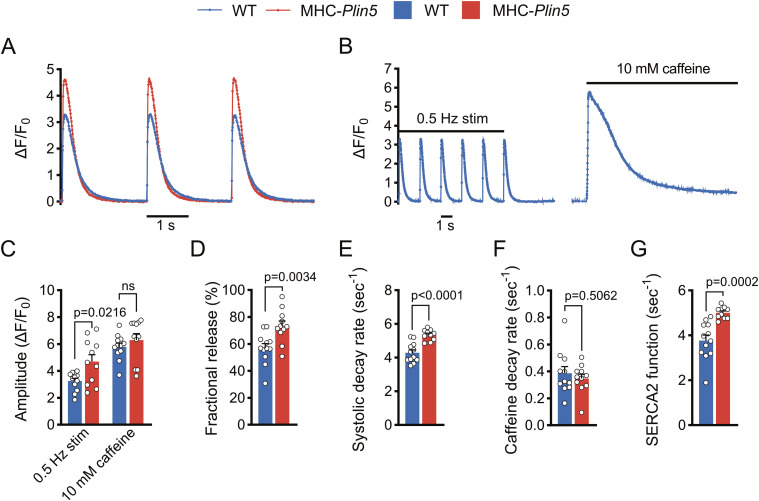
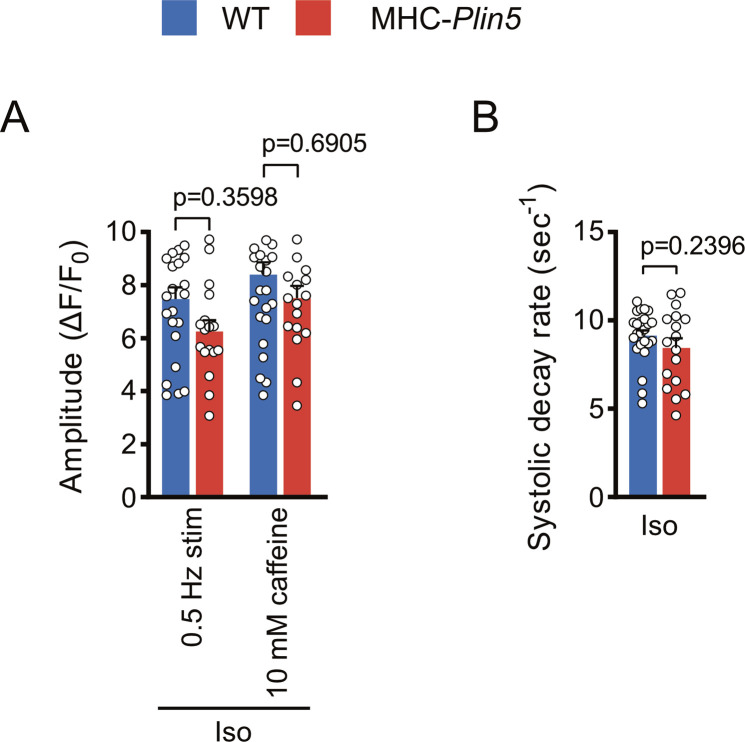
The adult heart develops hypertrophy to reduce ventricular wall stress and maintain cardiac function in response to an increased workload. Although pathological hypertrophy generally progresses to heart failure, physiological hypertrophy may be cardioprotective. Cardiac-specific overexpression of the lipid-droplet protein perilipin 5 (Plin5) promotes cardiac hypertrophy, but it is unclear whether this response is beneficial. We analyzed RNA-sequencing data from human left ventricle and showed that cardiac PLIN5 expression correlates with up-regulation of cardiac contraction-related processes. To investigate how elevated cardiac Plin5 levels affect cardiac contractility, we generated mice with cardiac-specific overexpression of Plin5 (MHC-Plin5 mice). These mice displayed increased left ventricular mass and cardiomyocyte size but preserved heart function. Quantitative proteomics identified sarcoplasmic/endoplasmic reticulum Ca2+ ATPase 2 (SERCA2) as a Plin5-interacting protein. In situ proximity ligation assay further confirmed the Plin5/SERCA2 interaction. Live imaging showed increases in intracellular Ca2+ release during contraction, Ca2+ removal during relaxation, and SERCA2 function in MHC-Plin5 versus WT cardiomyocytes. These results identify a role of Plin5 in improving cardiac contractility through enhanced Ca2+ signaling.


Conflict of interest statement

The authors declare that they have no conflict of interest.

Figures

Figure 1.
Figure 1.. High Plin5 expression in human heart is associated with up-regulation of cardiac contraction.
(A) Transcript per kilobase million of PLIN5 in the left ventricle from donors with values in the bottom and top quartiles, indicating low and high PLIN5 expression, respectively (106 samples per group). (B) Top 15 up-regulated functional terms from the KEGG pathway enrichment analysis of genes that were differentially expressed in heart tissues from humans with high versus low PLIN5 expression. (C) Up-regulated gene ontology terms related to contraction from the analysis of genes that were differentially expressed in heart tissues from humans with high versus low PLIN5 expression. Source data are available for this figure.
Figure S1.
Figure S1.. Characterization of MHC-Plin5 mice.
(A) Heart, liver, kidney, fat, and skeletal muscle from WT and MHC-Plin5 mice were analyzed for relative mRNA levels of Plin5 (nheart = 5 [WT], 5 [MHC-Plin5]). (B) Representative immunoblot images of Plin5 in hearts from WT and MHC-Plin5 mice. HPRT served as a loading control. (C) Quantification of (B) (nheart = 9 [WT], 8 [MHC-Plin5]). (D) Representative immunoblot images of Plin5 in hearts from refed and 4-h fasted WT mice. HPRT served as a loading control. (E) Quantification of (D) (nmice = 6 [WT], 6 [MHC-Plin5]). (F) Representative single z-plane confocal scan and respective 2D maximum-intensity projection along the z-axis of immunofluorescent staining of Plin5 in a WT and an MHC-Plin5 cardiomyocyte. Scale bar, 10 µm. (G) Representative heart cryosections of WT and MHC-Plin5 mice stained with Oil Red O. Scale bar, 25 µm. (H) Quantification of (G): Oil Red O. Positive area, percentage area stained with Oil Red O and quantified as a percentage of the total area on eight random frames (magnification of ×40) per heart (nheart = 3 [WT], 3 [MHC-Plin5]; nframe = 24 [WT], 24 [MHC-Plin5]). (I) Triglyceride content in hearts from WT and MHC-Plin5 mice, 4 h after fasting (nheart = 6 [WT], 6 [MHC-Plin5]). (J, K) Lipid content in hearts from WT and MHC-Plin5 mice, 4 h after fasting. LPC, lysophosphatidylcholine; PS, phosphatidylserine; PC, phosphatidylcholine; PE, phosphatidylethanolamine; CE, cholesterol esters; DG, diacylglycerol; SM, sphingomyelin; Cer, ceramide; DiCer, dihydroceramide; GlcCer, glucosylceramide; LacCer, lactosylceramide (nheart = 7 [WT], 7 [MHC-Plin5]). Values are the mean ± SEM; P-values are calculated by a t test. Source data are available for this figure.
Figure 2.
Figure 2.. Markers of pathological hypertrophy are not up-regulated in MHC-Plin5 cardiomyocytes.
(A) Representative heart cryosections of 22-wk-old WT and MHC-Plin5 mice stained with fluorescent WGA (red) and CD31 (green). Scale bar, 50 µm. (B) Left, quantification of (A): cardiomyocyte cross-sectional area (CM CSA) (nmice = 7 [WT], 7 [MHC-Plin5]). Right, distribution of CM CSA in all measured cardiomyocytes (calculated from nmice = 7 [WT], 7 [MHC-Plin5]; ncell = 1,400 [WT], 1,394 [MHC-Plin5]). (C) Quantification of (A): vessel density within cardiac tissues (nmice = 7 [WT], 7 [MHC-Plin5]). (D) mRNA expression of the indicated genes in isolated primary cardiomyocytes from 27-wk-old WT and MHC-Plin5 mice (nmice = 9 [WT], 7 [MHC-Plin5] from ≥2 independent isolations). (E) Representative heart cryosections of 27-wk-old WT and MHC-Plin5 mice stained with picrosirius red. Scale bar, 500 µm. (F) Quantification of (E): % fibrosis, percentage area stained with picrosirius red quantified as a percentage of the total area of the heart cryosection (nmice = 10 [WT], 8 [MHC-Plin5]). (G) mRNA expression of the indicated genes in heart from 27-wk-old WT and MHC-Plin5 mice (nmice = 9–10 [WT], 8–9 [MHC-Plin5]). Values are the mean ± SEM; P-values are calculated by a t test.
Figure S2.
Figure S2.. Intracellular signaling pathways regulating cardiac growth in MHC-Plin5 cardiomyocytes.
(A) Representative immunoblot images of p38 (pThr180/Tyr182 and total) and Erk1/2 (pThr202/Tyr204 and total) in MHC-Plin5 and WT heart lysates after a 16-h fast. HPRT, loading control. (B) Quantification of (A). (C) Representative immunoblot images of p110α, p85, Akt (pSer473 and total), p70 S6K (pThr389 and total), and E4-BP1 (pThr37/Thr46) in MHC-Plin5 and WT heart lysates after a 16-h fast. (D) Quantification of (C). Values are the mean ± SEM; P-values are calculated by a t test (n = 5–6 [WT], 5–8 [MHC-Plin5]). Source data are available for this figure.
Figure 3.
Figure 3.. Interactome reveals SERCA2 as a novel partner of Plin5.
(A) Experimental approach. CM, cardiomyocyte. Nano-LC–MS/MS, nanoscale liquid chromatography coupled to tandem mass spectrometry. (B) Coomassie blue–stained gels showing FLAG-enriched proteins (IP: FLAG) and total cell lysate (INPUT) from WT and MHC-Plin5 cardiomyocytes. Black arrow indicates the assumed Plin5-FLAG protein. (C) Representative immunoblot images of Plin5 (left) and FLAG (right) in FLAG-enriched and total fractions. (D) List of significantly enriched KEGG pathways in FLAG-enriched fraction of MHC-Plin5 versus WT cardiomyocytes. Source data are available for this figure.
Figure 4.
Figure 4.. Plin5 and SERCA2 interact in both WT and MHC-Plin5 cardiomyocytes.
(A) Representative immunoblot images of Plin5 (left) and SERCA2 (right) in total cell lysates (INPUT) and FLAG co-immunoprecipitates from WT and MHC-Plin5 cardiomyocytes (results shown are representative of nmice = 4 [WT], 3 [MHC-Plin5]). (B) Representative immunoblot images of Plin5 (left) and SERCA2 (right) in total cell lysates (INPUT) and Plin5 co-immunoprecipitates from WT and MHC-Plin5 cardiomyocytes. Non-immune rabbit IgG (IgG control) was used as the IP-negative control (results shown are representative of nmice = 4 [WT], 6 [MHC-Plin5] from two independent isolations). (C) Representative single z-plane confocal scan of immunofluorescent staining of an MHC-Plin5 cardiomyocyte. FLAG-Plin5 signal is green, SERCA2 signal is red, and the white arrows indicate colocalization. Scale bar, 10 µm. (C, D) Fluorescence intensity plot of the distribution of fluorescence from the MHC-Plin5 cardiomyocyte across white line in (C). (E) Quantitative analysis of FLAG-Plin5 and SERCA2 colocalization analyzed by Pearson’s correlation coefficient (calculated from nmice = 2 [MHC-Plin5]; ncell = 11). (F) Left, representative images of in situ interactions between Plin5 and SERCA2 using in situ proximity ligation assay (PLA) in adult WT and MHC-Plin5 cardiomyocytes. Nuclei were stained using DRAQ5. PLA signal is red, and DRAQ5 signal is blue. Non-immune rabbit IgG and mouse IgG1 (IgG controls) were used as the biological negative control. Right, quantification of the PLA fluorescent dots (nmice = 2 [WT], 2 [MHC-Plin5]; ncell = 16 [WT-IgG controls], 15 [MHC-Plin5-IgG controls], 23 [WT-anti-Plin5 + anti-SERCA2], 28 [MHC-Plin5-anti-Plin5 + anti-SERCA2]). Values are the mean ± SEM; P-values are calculated by two-way ANOVA followed by Tukey’s multiple comparisons post hoc test. Source data are available for this figure.
Figure S3.
Figure S3.. Colocalization of Plin5 and SERCA2 in MHC-Plin5 cardiomyocytes.
Representative confocal images of the subcellular localization of FLAG-Plin5 (green) and SERCA2 (red) and respective fluorescence intensity plots in WT and MHC-Plin5 cardiomyocytes. Scale bar, 10 µm.
Figure S4.
Figure S4.. Two-dimensional blue-native/SDS–PAGE for complex analysis of Plin5 and SERCA2 in WT and MHC-Plin5 mice.
(A) Coomassie staining of blue-native PAGE of WT and MHC-Plin5 primary cardiomyocytes. (A, B) Proteins were separated as in (A) and analyzed by immunoblotting with the indicated antibodies. Green shading highlights the macrocomplex that contained both Plin5 and SERCA2. (C) Coomassie staining of two-dimensional blue-native/SDS–PAGE of WT and MHC-Plin5 primary cardiomyocytes. The first horizontal dimension separated protein complexes according to their molecular sizes, and the second vertical dimension displayed each component of the complexes. MW, molecular weight. (C, D) Proteins were separated as in (C) and analyzed by immunoblotting with the indicated antibodies. Green shading highlights the macrocomplex that contained both Plin5 and SERCA2 (results shown are representative of nmice = 3 [WT], 3 [MHC-Plin5] from two independent isolations). Source data are available for this figure.
Figure 5.
Figure 5.. Plin5 overexpression likely contributes to modulations of SERCA2 interaction capacity and/or modulation of regulatory partners.
(A) mRNA expression of the indicated genes in isolated primary cardiomyocytes from WT and MHC-Plin5 mice (nmice = 8 [WT], 9–10 [MHC-Plin5] from ≥3 independent isolations). (B) Representative immunoblot images of SERCA2, calreticulin, and PLN (pSer16, pThr17, pSer16/Thr17, and total) in isolated primary cardiomyocytes from WT and MHC-Plin5 mice. HPRT served as a loading control. (C) Quantification of (B) (nmice = 7 [WT], 6 [MHC-Plin5] from ≥2 independent isolations). Values are the mean ± SEM; P-values are calculated by a t test. Source data are available for this figure.
Figure 6.
Figure 6.. Plin5 overexpression results in increased SERCA2 function.
(A) Representative Ca2+ transients recorded in paced Fluo-4-AM–loaded primary cardiomyocytes from WT and MHC-Plin5 mice. (B) Representative Ca2+ transients recorded in Fluo-4-AM–loaded primary cardiomyocytes from WT and MHC-Plin5 mice after pacing or caffeine (10 mM) induction. Stim, stimulation. (C, D, E, F, G) Quantification (nheart = 5 [WT], 5 [MHC-Plin5]; ncell = 12 [WT], 11 [MHC-Plin5]) of (C) Ca2+ transient amplitude of paced and caffeine-induced WT and MHC-Plin5 cardiomyocytes, (D) fractional release of Ca2+ during systolic contraction, (E) Ca2+ decay rates during systole in paced cardiomyocytes, (F) Ca2+ decay rates in the presence of caffeine, and (G) calculated contribution of SERCA2 activity for Ca2+ removal during relaxation (SERCA2 function). (C, D, E, F, G) Values are the mean ± SEM; P-values are calculated by one-way ANOVA followed by Sidak’s multiple comparisons post hoc tests for (C) and a t test for (D, E, F, –G).
Figure S5.
Figure S5.. Ca2+ handling in paced single-intact cardiomyocytes isolated from WT and MHC-Plin5 mice.
(A, B, C) Quantification of Ca2+ transients recorded in paced Fluo-4-AM–loaded primary cardiomyocytes from WT and MHC-Plin5 mice. (A) Ca2+ transient amplitude. (B) Representative normalized confocal Ca2+ transient from WT and MHC-Plin5 cardiomyocytes. (C, D) Rate of Ca2+ rise and (D) rate of Ca2+ removal. Values are the mean ± SEM; P-values are calculated by a t test (nheart = 5 [WT], 4 [MHC-Plin5]; ncell = 65 [WT], 45 [MHC-Plin5]).
Figure S6.
Figure S6.. Ca2+ handling in isoproterenol (Iso)-stimulated cardiomyocytes isolated from WT and MHC-Plin5 mice.
(A, B) Quantification of (A) Ca2+ transient amplitude of paced and caffeine-induced 10 nM Iso-stimulated WT and MHC-Plin5 cardiomyocytes (nheart = 4 [WT], 3 [MHC-Plin5]; ncell = 24–27 [WT], 17–18 [MHC-Plin5]) and (B) Ca2+ decay rates during systole in paced 10 nM Iso-stimulated cardiomyocytes (nheart = 4 [WT], 3 [MHC-Plin5]; ncell = 24 [WT], 17 [MHC-Plin5]). (A, B) Values are the mean ± SEM; P-values are calculated by one-way ANOVA followed by Sidak’s multiple comparisons post hoc tests for (A) and a t test for (B).
Figure S7.
Figure S7.. Technical negative controls for in situ proximity ligation assay.
Left, representative images of in situ interactions between Plin5 and SERCA2 using PLA in adult WT and MHC-Plin5 cardiomyocytes. Nuclei were stained using DRAQ5. PLA signal is red, and DRAQ5 signal is blue. Right, quantification of the PLA fluorescent dots (nmice = 2 [WT], 2 [MHC-Plin5]; ncell = 10 [WT-anti-Plin5], 10 [MHC-Plin5-anti-Plin5], 7 [WT-anti-SERCA2], 11 [MHC-Plin5-anti-SERCA2]). Values are the mean ± SEM.

References

    1. Amrutkar M, Cansby E, Nuñez-Durán E, Pirazzi C, Ståhlman M, Stenfeldt E, Smith U, Borén J, Mahlapuu M (2015) Protein kinase STK25 regulates hepatic lipid partitioning and progression of liver steatosis and NASH. FASEB J 29: 1564–1576. 10.1096/fj.14-264937 - DOI - PubMed
    1. Andersson L, Drevinge C, Mardani I, Dalen KT, Ståhlman M, Klevstig M, Lundqvist A, Haugen F, Adiels M, Fogelstrand P, et al. (2017) Deficiency in perilipin 5 reduces mitochondrial function and membrane depolarization in mouse hearts. Int J Biochem Cell Biol 91: 9–13. 10.1016/j.biocel.2017.07.021 - DOI - PubMed
    1. Arif M, Klevstig M, Benfeitas R, Doran S, Turkez H, Uhlén M, Clausen M, Wikström J, Etal D, Zhang C, et al. (2021) Integrative transcriptomic analysis of tissue-specific metabolic crosstalk after myocardial infarction. Elife 10: e66921. 10.7554/elife.66921 - DOI - PMC - PubMed
    1. Arnlov J, Ingelsson E, Riserus U, Andren B, Lind L (2004) Myocardial performance index, a Doppler-derived index of global left ventricular function, predicts congestive heart failure in elderly men. Eur Heart J 25: 2220–2225. 10.1016/j.ehj.2004.10.021 - DOI - PubMed
    1. Autry JM, Thomas DD, Espinoza-Fonseca LM (2016) Sarcolipin promotes uncoupling of the SERCA Ca2+ pump by inducing a structural rearrangement in the energy-transduction domain. Biochemistry 55: 6083–6086. 10.1021/acs.biochem.6b00728 - DOI - PMC - PubMed

Publication types