. 2023 Jan 30;10(2):e200084.
doi: 10.1212/NXI.0000000000200084. Print 2023 Mar.

Ocrelizumab Impairs the Phenotype and Function of Memory CD8+ T Cells: A 1-Year Longitudinal Study in Patients With Multiple Sclerosis

Affiliations

Ocrelizumab Impairs the Phenotype and Function of Memory CD8+ T Cells: A 1-Year Longitudinal Study in Patients With Multiple Sclerosis

Amandine Mathias et al. Neurol Neuroimmunol Neuroinflamm. .

Abstract

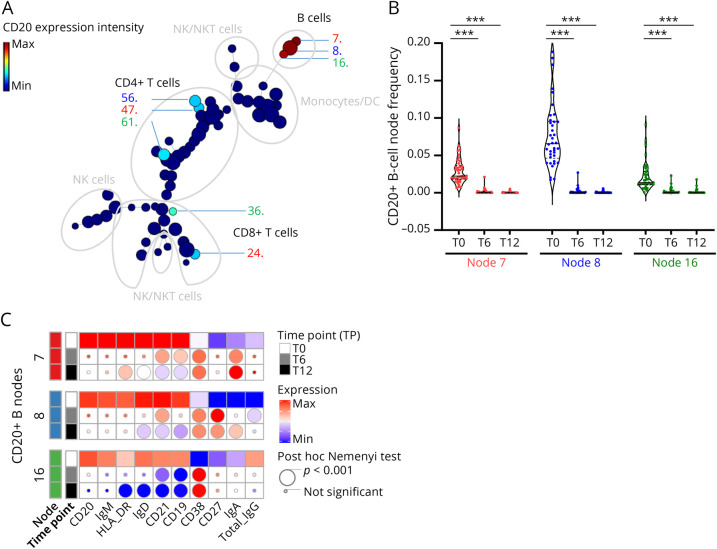
Background and objective: Depleting CD20+ B cells is the primary mechanism by which ocrelizumab (OCRE) is efficient in persons with multiple sclerosis (pwMS). However, the exact role of OCRE on other immune cell subsets directly or indirectly remains elusive. The purpose of this study is to characterize the dynamics of peripheral immune cells of pwMS on OCRE.

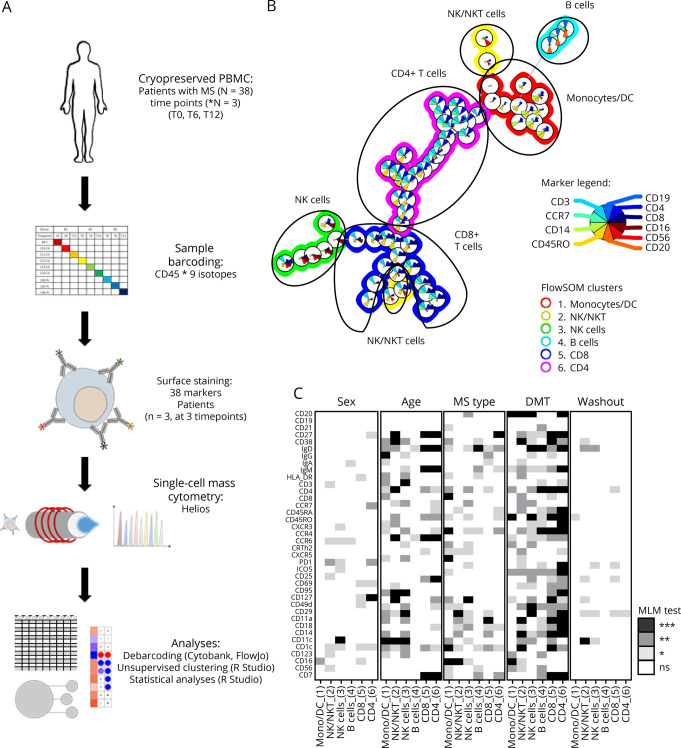
Methods: We collected blood samples from 38 pwMS before OCRE onset (T0) and at 6 and 12 months (T6, T12) after initiation. To cover the immune cell diversity, using mass cytometry time of flight, we designed a 38-parameter panel to analyze B, T, and innate immune cell markers and CNS migratory markers. In parallel, viral-specific CD8+ T-cell responses were assessed by the quantification of interferon-γ secretion using the enzyme-linked immunospot assay on cytomegalovirus, Epstein-Barr virus, and influenza stimulations.

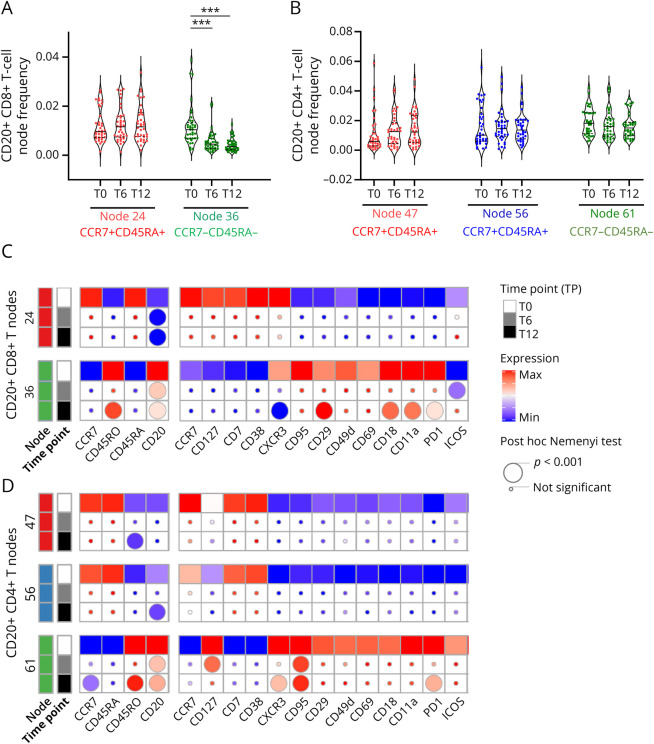
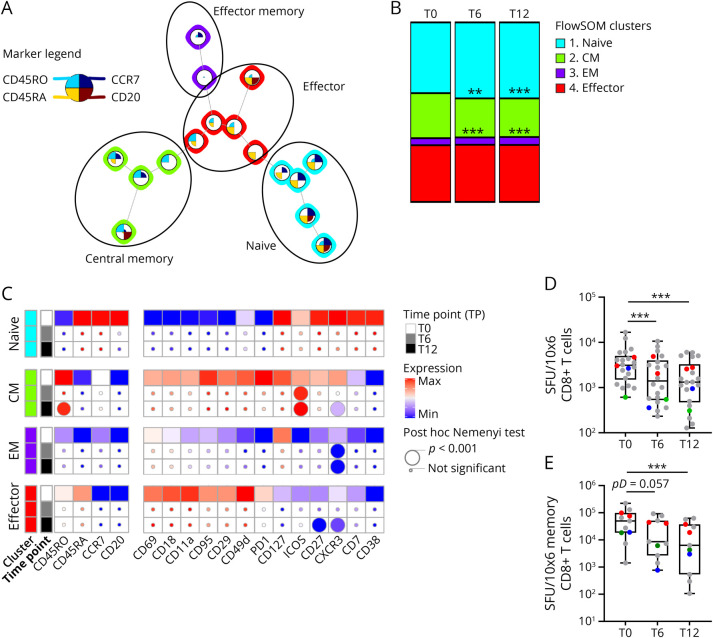
Results: Beside B-cell depletion, we observed a loss in memory CD8+CD20+ and central memory CD8+ T cells but not in CD4+CD20+ T cells already at T6 and T12 (p < 0.001). The loss of memory CD8+ T cells correlated with a lower CXCR3 expression (p < 0.001) and CNS-related LFA-1 integrin expression (p < 0.001) as well as a reduced antiviral cellular immune response observed at both time points (p < 0.001). Of note, we did not observe major changes in the phenotype of the other cell types studied. Seven of 38 (18.4%) patients in our cohort presented with infections while on OCRE; 4 of which were switched from dimethyl fumarate. Finally, using a mixed linear model on mass cytometry data, we demonstrated that the immunomodulation induced by previous disease-modifying therapies (DMTs) was prolonged over the period of the study.

Discussion: In addition to its well-known role on B cells, our data suggest that OCRE also acts on CD8+ T cells by depleting the memory compartment. These changes in CD8+ T cells may be an asset in the action of OCRE on MS course but might also contribute to explain the increased occurrence of infections in these patients. Finally, although more data are needed to confirm this observation, it suggests that clinicians should pay a special attention to an increased infection risk in pwMS switched from other DMTs to OCRE.


Figures

Figure 1
Figure 1. Immunophenotyping of the Effect of Ocrelizumab on Total PBMCs of Treated Patients With MS Using Mass Cytometry
PBMCs from 38 patients with MS before OCRE onset (T0) and after 6 and 12 months (T6 and T12). To cover the immune cell diversity, a 38-parameter panel was designed for mass cytometry analyses (CyTOF) including B, T, NK, and innate immune cell markers as well as CNS migratory markers. (A) A schematic overview of the analysis pipeline is represented from the barcoding of PBMC individual sample to mass cytometry acquisition and analyses. The 3 longitudinal time points from 3 donors were barcoded, and all 9 samples analyzed together to minimize the batch effect. (B) FlowSOM unsupervised clustering allows to discriminate the 6 major blood cell subsets, i.e., B cells, CD4+ and CD8+ T cells, NKT cells, and monocytes/dendritic cells (see legend for marker selection [inside color pies] and metacluster definition [outside ring color]). (C) Effect of sex, age, MS type, treatment before OCRE introduction, and washout period before OCRE introduction on the expression of all 38 parameters was tested using a mixed linear model (MLM) in the total PBMC FlowSOM metaclusters. In white, pLM > 0.05 (not significant [ns]); in light gray, pLM < 0.05; in dark gray, pLM < 0.01; in black, pLM < 0.001. MS = multiple sclerosis; OCRE = ocrelizumab; PBMCs = peripheral blood mononuclear cells.
Figure 2
Figure 2. Depletion and Phenotypical Changes of CD20+ B-Cell Subsets on OCRE
PBMCs were analyzed as in Figure 1. (A) CD20 expression across FlowSOM unsupervised clustering allows to discriminate the major CD20-expressing nodes including B cells (nodes 7, 8, and 16), CD4+ T cells (nodes 47, 56, and 61), and CD8+ T cells (nodes 24 and 36). (B) Changes in the frequency of FlowSOM unsupervised naive and memory CD20+ B-cell subsets overtime (T0, T6, and T12). The asterisks (*) represent significant differences for the effect of time for a given treatment on a given metacluster: ***p < 0.001 using a nonparametric paired post hoc Nemenyi test. (C) Statistical heatmap expression analyses of markers of function/activation of CD20+ B-cell subsets overtime (T0, T6, and T12). Effect of the treatment overtime and over CD20+ nodes was tested using a nonparametric paired Friedman test as compared to baseline (T0, squares). If significant, a nonparametric paired post hoc Nemenyi test was run to compare baseline values with subsequent time points (T0 vs T6 and T0 vs T12). Post hoc results are depicted as circles (the smallest being not significant and the largest, p < 0.001, see the figure for details). OCRE = ocrelizumab; PBMCs = peripheral blood mononuclear cells.
Figure 3
Figure 3. Depletion of Memory CD20+ CD8+ T Cells and Phenotype Changes of CD20+ T-Cell Subsets on OCRE
PBMCs were analyzed as in Figure 1. CD8+CD20+ and CD4+CD20+-expressing nodes were selected as depicted in Figure 2A. CD20 expression across FlowSOM unsupervised clustering allows to discriminate the major CD20-expressing T-cell nodes including CD8+ T cells (nodes 24 and 36) and CD4+ T cells (nodes 47, 56, and 61) as identified in Figure 2. Changes in the frequency of FlowSOM unsupervised naive and memory CD8+CD20+ (A) and CD4+CD20+ (B) T-cell subsets overtime (T0, T6, and T12). The asterisks (*) represent significant differences for the effect of time for a given treatment on a given metacluster: ***p < 0.001 using a nonparametric paired post hoc Nemenyi test. Statistical heatmap expression analyses of markers of function/activation and CNS-migration properties of CD8+CD20+ (C) and CD4+CD20+ (D) T-cell subsets overtime (T0, T6, and T12). Effect of the treatment overtime and over CD20+ nodes was tested using a nonparametric paired Friedman test as compared to baseline (T0, squares). If significant, a nonparametric paired post hoc Nemenyi test was run to compare baseline values with subsequent time points (T0 vs T6 and T0 vs T12). Post hoc results are depicted as circles (the smallest being not significant and the largest, p < 0.001, see the figure for details). OCRE = ocrelizumab; PBMCs = peripheral blood mononuclear cells.
Figure 4
Figure 4. Loss of Functional Activated Central Memory CD8+ T Cells on OCRE Treatment
(A) FlowSOM unsupervised subclustering of PBMC CD8+ metacluster 5 discriminates the circulating naive, central memory (CM), effector memory (EM), and effector (Eff) CD8+ T cells (see legend for marker selection and submetacluster definition). (B) Modification in the frequency of FlowSOM unsupervised naive and memory CD8+ T-cell subsets overtime (T0, T6, and T12) is represented. The asterisks (*) represent significant differences for the effect of time for a given treatment on a given metacluster: **p < 0.01; ***p < 0.001 using a nonparametric paired post hoc Nemenyi test. (C) Statistical heatmap analyses of markers of phenotype, function/activation, and CNS-migration properties of CD8+ cell subsets overtime (T0, T6, and T12). Effect of the treatment overtime and over CD8+submetaclusters was tested using a nonparametric paired Friedman test as compared to baseline (T0, squares). If significant, a nonparametric paired post hoc Nemenyi test was run to compare baseline values with subsequent time points (T0 vs T6 and T0 vs T12). Post hoc results are depicted as circles (the smallest being not significant; the lower intermediate, p < 0.05; the upper intermediate, p < 0.01; and the largest, p < 0.001, see the figure for details). (D) IFN-γ–mediated cellular immune responses against a pool of immunodominant peptides of CMV, EBV, and influenza (CEF) were tested using an ELISPOT assay at 3 time points of OCRE administration (T0, T6, and T12) in n = 22 of 38 patients tested with valid ELISPOT at T0 and more than 4 times the unstimulated condition. Spot-forming units (SFUs) were normalized to total CD8+ T-cell counts (frequencies from cluster 5, Figure 1, B and C). (E) In a subset of patients tested in panel D (11/22), CD8+ T-cell fractions were MACS sorted at 3 time points of OCRE administration (T0, T6, and T12) and cocultured with autologous CD8-depleted PBMCs (CD80) that were collected only at T0, at a ratio of 1:10 (CD8+:CD80). SFUs were normalized to total memory CD8+ T-cell counts (frequencies from clusters 2 and 3, panel A). (D-E) The asterisks (*) represent significant differences for the effect of time: ***p < 0.001 using a nonparametric paired Friedman test followed by a post hoc Dunn test (pD). Colored dots represent patients who developed infections on OCRE treatment over the period of the study. In green, patients previously under IFN; in red, previously under DMF; and in blue, previously under GA. ELISPOT = enzyme-linked immunospot; MACS = magnetic-activated cell sorting; OCRE = ocrelizumab; PBMCs = peripheral blood mononuclear cells.

References

    1. Greenfield AL, Hauser SL. B-cell therapy for multiple sclerosis: entering an era. Ann Neurol. 2018;83(1):13-26. doi:10.1002/ana.25119 - DOI - PMC - PubMed
    1. Hauser SL, Waubant E, Arnold DL, et al. . B-cell depletion with rituximab in relapsing-remitting multiple sclerosis. N Engl J Med. 2008;358(7):676-688. doi:10.1056/NEJMoa0706383 - DOI - PubMed
    1. Krumbholz M, Derfuss T, Hohlfeld R, Meinl E. B cells and antibodies in multiple sclerosis pathogenesis and therapy. Nat Rev Neurol. 2012;8(11):613-623. doi:10.1038/nrneurol.2012.203 - DOI - PubMed
    1. Meier UC, Giovannoni G, Tzartos JS, Khan G. Translational mini-review series on B cell subsets in disease. B cells in multiple sclerosis: drivers of disease pathogenesis and Trojan horse for Epstein–Barr virus entry to the central nervous system? Clin Exp Immunol. 2011;167(1):1-6. doi:10.1111/j.1365-2249.2011.04446.x - DOI - PMC - PubMed
    1. Kappos L, Li D, Calabresi PA, et al. . Ocrelizumab in relapsing-remitting multiple sclerosis: a phase 2, randomised, placebo-controlled, multicentre trial. Lancet. 2011;378(9805):1779-1787. doi:10.1016/S0140-6736(11)61649-8 - DOI - PubMed

Publication types