. 2023 Jan 30;14(1):73.
doi: 10.1038/s41419-023-05612-7.

The interaction of β-arrestin1 with talin1 driven by endothelin A receptor as a feature of α5β1 integrin activation in high-grade serous ovarian cancer

Affiliations

The interaction of β-arrestin1 with talin1 driven by endothelin A receptor as a feature of α5β1 integrin activation in high-grade serous ovarian cancer

Ilenia Masi et al. Cell Death Dis. .

Erratum in

Abstract

Dissemination of high-grade serous ovarian cancer (HG-SOC) in the omentum and intercalation into a mesothelial cell (MC) monolayer depends on functional α5β1 integrin (Intα5β1) activity. Although the binding of Intα5β1 to fibronectin drives these processes, other molecular mechanisms linked to integrin inside-out signaling might support metastatic dissemination. Here, we report a novel interactive signaling that contributes to Intα5β1 activation and accelerates tumor cells toward invasive disease, involving the protein β-arrestin1 (β-arr1) and the activation of the endothelin A receptor (ETAR) by endothelin-1 (ET-1). As demonstrated in primary HG-SOC cells and SOC cell lines, ET-1 increased Intβ1 and downstream FAK/paxillin activation. Mechanistically, β-arr1 directly interacts with talin1 and Intβ1, promoting talin1 phosphorylation and its recruitment to Intβ1, thus fueling integrin inside-out activation. In 3D spheroids and organotypic models mimicking the omentum, ETAR/β-arr1-driven Intα5β1 signaling promotes the survival of cell clusters, with mesothelium-intercalation capacity and invasive behavior. The treatment with the antagonist of ETAR, Ambrisentan (AMB), and of Intα5β1, ATN161, inhibits ET-1-driven Intα5β1 activity in vitro, and tumor cell adhesion and spreading to intraperitoneal organs and Intβ1 activity in vivo. As a prognostic factor, high EDNRA/ITGB1 expression correlates with poor HG-SOC clinical outcomes. These findings highlight a new role of ETAR/β-arr1 operating an inside-out integrin activation to modulate the metastatic process and suggest that in the new integrin-targeting programs might be considered that ETAR/β-arr1 regulates Intα5β1 functional pathway.


Conflict of interest statement

The authors declare no competing interests.

Figures

Fig. 1
Fig. 1. High ITGB1/EDNRA expression correlates with the HG-SOC poor prognosis.
A Kaplan–Meier analysis of overall survival (OS) and progression-free survival (PFS) curves in HG-SOC patients with low or high ETAR (EDNRA)/Intβ1 (ITGB1) expression. B Dot plots from TCGA data illustrate the correlation between the endogenous EDNRA level with ITGB1 and ITGA5 mRNA levels.
Fig. 2
Fig. 2. Expression of integrins, β-arr1 and ETAR.
A qRT-PCR analysis for the expression of ITGB1 (Intβ1), ITGA5 (Intα5), ARRB1 (β-arr1), and EDNRA (ETAR) in a panel of primary HG-SOC cells (OV.GEM#9 and OV.GEM#11 from ovarian cancer tissues, OV.GEM#20 from peritoneal cancer tissue and OV.GEM#27 from omental cancer tissue) and cell lines. Representative WB analysis of indicated proteins in (B) primary HG-SOC cells and (C) cell lines.
Fig. 3
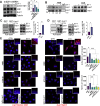
Fig. 3. ET-1/ETAR/β-arr1 activates Intβ1 signaling.
A CLSM analysis in OV.GEM#20 (upper) and SKOV3 (lower) cells, stimulated with ET-1 (100 nM) for 5 min and/or AMB (1 μm) and/or ATN161 (1 μm), stained for active Intβ1 (green) and F-actin (red). Nuclei are reported in blue (DAPI). For active Intβ1 a higher-power magnification image of a selected ROI in ET-1-stimulated cells is shown, indicating active Intβ1 intracellular accumulation. Scale bar, 50 μm. Histograms, mean fluorescence intensity (MFI) of active Intβ1/cytoplasmic area means ± SD. One-way ANOVA. B Lysates of cells stimulated with ET-1 for indicated times or (C) with ET-1 for 5 min and/or AMB and/or ATN161 were subjected to WB for indicated proteins. Histograms, means ± SD of the average band intensity normalized to Tubulin or GAPDH (fold changes versus CTR) used as loading control; n = 3, one-way ANOVA.
Fig. 4
Fig. 4. ET-1 promotes the phosphorylation of talin1 and its association with active Intβ1.
A CLSM analysis of SKOV3 cells stimulated with ET-1 for 5 min and/or AMB and/or ATN161, then stained for active Intβ1 (green) and talin1 (red) detection. Colocalization is shown in merged images, detected in yellow. For ET-1 stimulation, intracellular accumulation of active Intβ1 is depicted by arrows and higher-power magnification images of two selected ROI are shown, bringing out active Intβ1/talin1 colocalization. Nuclei are reported in blue (DAPI). Scale bar, 20 μm. Columns show the mean ± SD of quantification of Pearson’s correlation between active Intβ1 and talin1. B CLSM analysis of SKOV3 cells stimulated with ET-1 and/or AMB and/or ATN161 for 5 min and stained for active Intβ1 (green) and ptalin1 (red). Colocalization is shown in merged images, detected in yellow and depicted by an arrow. Nuclei are reported in blue (DAPI). Scale bar, 20 μm. Columns, mean ± SD of quantification of Pearson’s correlation between active Intβ1 and ptalin1. n = 3, one-way ANOVA.
Fig. 5
Fig. 5. β-arr1 links Intβ1 and talin1.
A si-SCR and si-ARRB1 transfected SKOV3 cells, stimulated with ET-1 for 5 min, were subjected to WB for indicated proteins. Histograms mean ± SD of the average band intensity normalized to Tubulin used as a loading control (fold changes versus CTR); n = 2, one-way ANOVA. B Lysates of SKOV3 cells stimulated with ET-1 and/or AMB for 5 min were immunoprecipitated (IP) with anti-β-arr1 or irrelevant IgG. C, D Lysates of OVCAR3 cells stimulated or not with ET-1 were incubated with GST or GST-β-arr1 fusion protein. Representative images of inputs and pulldown analyzed by WB for indicated proteins. Histograms, means ± SD of the average band intensity normalized to GAPDH used as a loading control (fold changes versus CTR); n = 2, t test. E Representative PLA images of protein complexes containing Intβ1 and β-arr1 or talin1 and β-arr1 in OVCAR3 cells stimulated with ET-1 and/or AMB and/or ATN161 for 60 min. The red signal represents a positive PLA reaction and DAPI staining (blue) highlights the nucleus. No positive PLA reaction was observed in negative controls (with primary antibodies and irrelevant IgG). Scale bar, 10 μm. Inset, show higher magnifications of the square. Histograms mean ± SD of PLA dots per nucleus; n = 3. One-way ANOVA, Tukey post hoc analysis.
Fig. 6
Fig. 6. HG-SOC cell spheroid survival and mesothelial clearance are regulated by ET-1/ β-arr1/Intβ1 signaling.
A 3D spheroids were treated with ET-1 and/or AMB and/or ATN161 for 72 h or (B) si-SCR, or si-ARRB1 or si-TLN1 transfected 3D spheroids were treated with ET-1 and live (green) or dead (red) cells were determined using a dual-fluorescence system. Histograms mean ± SD of the live/dead cell ratio (fold changes versus CTR); n = 2, one-way ANOVA. C Images depict mesothelial clearance induced by SKOV3 spheroids treated with ET-1 and/or AMB + ATN161 at 0- and 24-h time points. Scale bar, 50 μm. The graph represents the ratio between the area of the “hole”/aperture in the mesothelial monolayer after 24 h (highlighted with the white line) and the initial spheroid area (0 h). n = 2, one-way ANOVA.
Fig. 7
Fig. 7. HG-SOC invasion is regulated by ET-1/Intβ1 signaling.
A si-SCR, or si-TLN1 or si-ARRB1 OVCAR3 cells treated with ET-1 and/or AMB and/or ATN161 were allowed to invade fibronectin/type I collagen plugs in an inverted invasion assay (48 h). Cells were stained with PKH67, and serial optical sections (10 μm intervals) were acquired. The invasion was measured by dividing the sum of signal intensity of all slides beyond 20 μm (invading cells) by the sum of the intensity of all slides (total cells). n = 2, one-way ANOVA, Tukey post hoc analysis. Scale bar, 200 µm. B SKOV3 cells plated on a monolayer of MCs grown on fibronectin/type I collagen in a polystyrene scaffold were allowed to invade for 7 days in the absence and presence of ET-1 and/or AMB and/or ATN161, then fixed with Bouin’s solution and paraffin-embedded scaffolds were then cut into thin slices (10 µm). The images show cell invasion in a 3D organotypic model. Hematoxylin and eosin staining are shown. C Sections as in (B) were stained for active Intβ1 (green) and DAPI (blue) detection. The corresponding transmitted light images are also shown. Arrows depict the top side of the scaffold where cells were plated. Scale bar, 50 µm.
Fig. 8
Fig. 8. Ambrisentan as well as ATN161 controls SOC cell metastatic colonization .
A In vivo adhesion assays as showed by bioluminescent images of SKOV3-Luc cells, untreated (CTR) or pretreated with AMB or ATN161 or with a combination, on abdominal organs (n = 5 mice/group). The organs arranged are the intestine and mesentery, the spleen with the pancreas, and omentum. The adherent cell aggregates were observed, and the luminescence was read and recorded. n = 2 one-way ANOVA. B Bioluminescent images of intraperitoneally (i.p.) injected SKOV3-Luc cells (2 × 106 cells) in NOD/SCID mice, undergoing treatments for 5 weeks with 200 L Metocell (vehicle, CTR) or 200 μL AMB (10 mg/kg, oral daily), both by oral gavage, or ATN161 (100 μg/kg, i.p. twice a week). Tumor burden was assessed on days 17, 25, 32, and 39 after tumor cell injection. Data are presented as mean ± SD, n = 2, one-way ANOVA. C Representative WB for Intβ1 expression in metastatic nodules. GAPDH was used for loading control. D Representative CLSM images of paraffin-embedded formalin-fixed tumor tissue sections stained for active Intβ1 from mice as in (B), stained for active Intβ1 (green). Nuclei in the tissue sections were counterstained with DAPI. Scale bar = 50 µm.

References

    1. Doyle AD, Nazari SS, Yamada KM. Cell–extracellular matrix dynamics. Phys Biol. 2022;19:021002. - PMC - PubMed
    1. Hamidi H, Ivaska J. Every step of the way: integrins in cancer progression and metastasis. Nat Rev Cancer. 2018;18:533–48. - PMC - PubMed
    1. Cooper J, Giancotti FG. Integrin signaling in cancer: mechanotransduction, stemness, epithelial plasticity, and therapeutic resistance. Cancer Cell. 2019;35:347–67. - PMC - PubMed
    1. Gong H, Shen B, Flevaris P, Chow C, Lam SCT, Voyno-Yasenetskaya TA, et al. G protein subunit Gα13 binds to integrin αIIb β3 and mediates integrin “outside-in” signaling. Science. 2010;327:340–3. - PMC - PubMed
    1. Shen B, Estevez B, Xu Z, Kreutz B, Karginov A, Bai Y, et al. The interaction of Gα13 with integrin β1 mediates cell migration by dynamic regulation of RhoA. Mol Biol Cell. 2015;26:3658–70. - PMC - PubMed

Publication types