. 2023 Jan 30;14(1):476.
doi: 10.1038/s41467-023-35979-2.

Influence of circadian clocks on adaptive immunity and vaccination responses

Affiliations

Influence of circadian clocks on adaptive immunity and vaccination responses

Louise Madeleine Ince et al. Nat Commun. .

Abstract

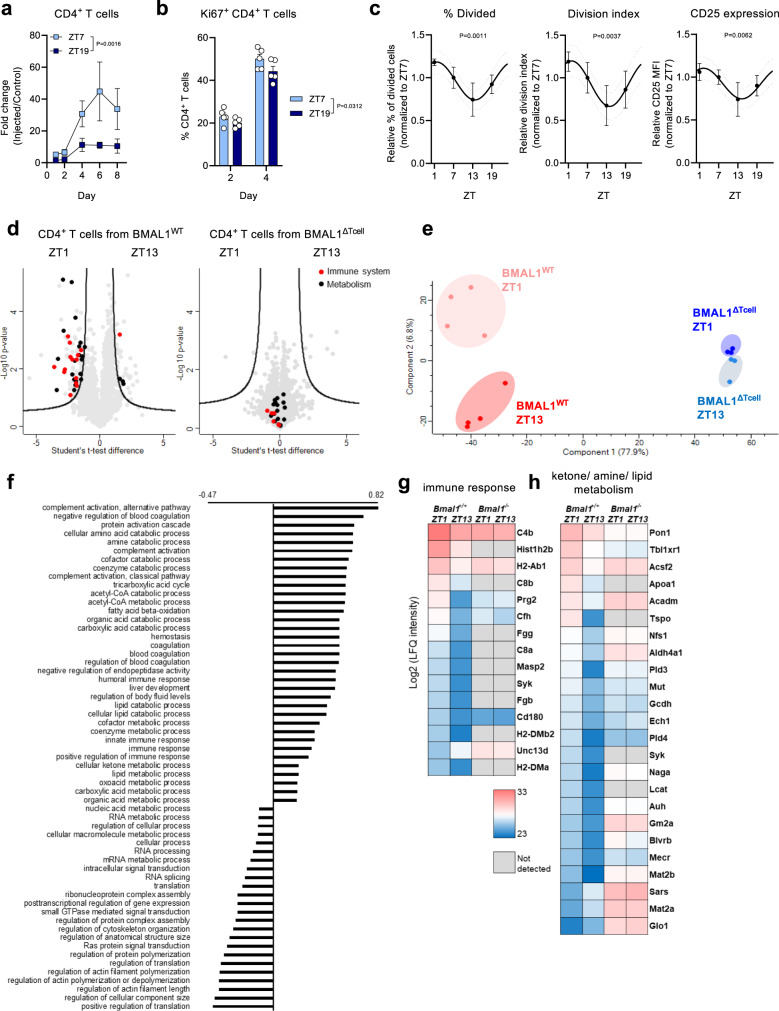
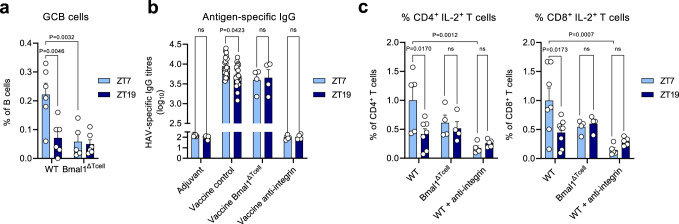
The adaptive immune response is under circadian control, yet, why adaptive immune reactions continue to exhibit circadian changes over long periods of time is unknown. Using a combination of experimental and mathematical modeling approaches, we show here that dendritic cells migrate from the skin to the draining lymph node in a time-of-day-dependent manner, which provides an enhanced likelihood for functional interactions with T cells. Rhythmic expression of TNF in the draining lymph node enhances BMAL1-controlled ICAM-1 expression in high endothelial venules, resulting in lymphocyte infiltration and lymph node expansion. Lymph node cellularity continues to be different for weeks after the initial time-of-day-dependent challenge, which governs the immune response to vaccinations directed against Hepatitis A virus as well as SARS-CoV-2. In this work, we present a mechanistic understanding of the time-of-day dependent development and maintenance of an adaptive immune response, providing a strategy for using time-of-day to optimize vaccination regimes.


Conflict of interest statement

The authors declare no competing interests.

Figures

Fig. 1
Fig. 1. DC migration during the day elicits greater lymph node expansion.
a, b Time course of cell counts, normalized to the 12 h time point on the contralateral side in a parotid lymph node (LN), n = 3 mice; or b popliteal LN, n = 3–9 mice; from 5 independent experiments each, two-way ANOVA with Tukey’s post test. c Dose-response curve of total cell counts in the popliteal LN 48 h post-injection, normalized to the contralateral side; n = 2–3 mice, two-way ANOVA with Sidak’s post test. d, e Number of exogenous (CFSE+) bone marrow-derived dendritic cells (BMDCs) in popliteal LNs quantified by flow cytometry (d), n = 3–14 mice from 5 independent experiments, two-way ANOVA with Sidak’s post test; or by confocal microscopy (e) 24 h post-injection, n = 8 mice, unpaired two-sided Student’s t test, scale bar: 500 µm. f Median velocities of intravenously injected CD4+ T cells in popliteal LN in steady-state conditions and after FITC painting. Tracks were pooled from 3–4 mice per group; n = 186–777 total tracks, unpaired two-sided Student’s t test. Scale bar: 50 µm. g (Left) Representative overlay of CD4+ T cell migration tracks. (Right) Euclidean distance of CD4+ T cells from (f). Euclidian distances were pooled from 3–4 mice per group; n = 186–777 total tracks, one-way ANOVA with Tukey’s post test. h Model predictions (Supplementary Table 1 (ID1, ID2)) for the fold-change in the interaction probability of DC and T cells comparing rhythmic migratory dynamics (red dashed line) to non-rhythmic migration (gray dotted line). The mean (black line) and the range (min–max, gray shaded area) of the predicted fold change across skin draining LNs are shown. i Model predictions for the fold-change in the interaction probability of DC and T cells, assuming different combinations of rhythmic and non-rhythmic components based on the mean dynamics across skin draining LNs. j Number of CD69+ CD4+ and CD8+ T cells in draining LNs 48 h post-FITC; n = 9 mice; two-way ANOVA with Tukey’s post test. Data are plotted as mean ± standard error of mean (SEM); ns, not significant. Source data are provided as a Source data file and detailed sample sizes are available in “Methods”.
Fig. 2
Fig. 2. Rhythmic DC trafficking induces lymph node homing.
a Popliteal lymph node (LN) mass 24 h following subcutaneous injection of 1 × 106 bone marrow-derived dendritic cells (BMDCs), with or without prior treatment with integrin-blocking antibodies, normalized to average ZT7 mass; n = 4–5 mice, two-way ANOVA with Sidak’s post test. b Popliteal LN cellularity 48 h following subcutaneous injection of 1 × 106 BMDCs, with and without prior treatment with integrin-blocking antibodies; n = 2–3 mice, two-way ANOVA with Sidak’s post test. c Icam1 mRNA expression in parotid LN 12 h after topical application of FITC; n = 3 mice, unpaired two-sided Student’s t test. d Time course of ICAM-1 protein levels on high endothelial venules (HEVs) of parotid LNs by quantitative imaging after topical FITC application; n = 3 mice, two-way ANOVA with Sidak’s post test. e LN cellularity 48 h after topical FITC application, with or without prior treatment with anti-ICAM1 antibody; n = 5 mice, two-way ANOVA with Fisher’s post test. f ICAM-1 protein levels on HEVs of parotid LNs 12 h after topical FITC application in WT or endothelial cell-specific Bmal1−/− mice (BMAL1ΔEC); n = 3–4 mice, two-way ANOVA with Sidak’s post test. g Chromatin immunoprecipitation (ChIP) analysis of BMAL1 binding to the Icam1 promoter region R4 in the parotid LN 6 h after topical FITC application; n = 3 mice, unpaired two-sided Student’s t test. h Time course of Tnf mRNA expression in parotid LN after topical application of FITC; n = 3 mice, two-way ANOVA with Sidak’s post test. i ICAM-1 protein levels on HEVs of parotid LNs 12 h after topical FITC application in mice pre-treated with anti-TNF antibody or isotype control; n = 5 mice, two-way ANOVA with Tukey’s post test. j Parotid LN cellularity 48 h after topical FITC application, with or without prior treatment with anti-TNF antibody; n = 8–14 mice, two-way ANOVA with Tukey’s post test. Data are plotted as mean ± standard error of mean (SEM); ns, not significant. Source data are provided as a Source data file and detailed sample sizes are available in “Methods”.
Fig. 3
Fig. 3. CD4+ T cell-intrinsic, clock-controlled rhythms in the adaptive immune response.
a Time course of CD4+ T cells in popliteal lymph nodes (LNs) following subcutaneous injection of 1 × 106 bone marrow-derived dendritic cells (BMDCs); n = 5 mice, two-way ANOVA with Sidak’s post test. b Quantification of Ki67+ CD4 T cells in popliteal LNs following subcutaneous injection of 1 × 106 BMDCs; n = 5 mice, two-way ANOVA with Sidak’s post test. c Proliferation capacity of LN CD4+ T cells stimulated ex vivo, normalized to the ZT7 average; n = 3–6 mice, cosinor analysis (F-test with 95% confidence interval; 15 degrees of freedom; R2 effect sizes from left to right 0.5949, 0.5261, 0.4918). d Volcano plot of protein enrichment in LN CD4+ T cells from WT (left) and T cell-specific Bmal1−/− (right, (BMAL1ΔTcell)) mice in steady state at ZT1 vs. ZT13; n = 3–4 mice, unpaired two-sided Student’s t-test, ZT1 vs. ZT13 at a FDR = 0.05 and S0 = 1 that are part of the GOBP terms immune response (red) or ketone/amine/lipid metabolism (black) are shown. e Principal component analysis of log2 transformed LFQ intensities at a FDR = 0.05 cut-off. f GOBP 1D annotation categories and enrichment scores of the unpaired two-sided Student’s t-test differences ZT1 vs. ZT13 at a FDR = 0.01 cut-off. g, h Heatmap of log2 transformed LFQ intensities filtered for significance in a Student’s t-test ZT1 vs. ZT13 and part of the GOBP terms immune response (g) or ketone/amine/lipid metabolism (h). Data are plotted as mean ± standard error of mean (SEM) ns, not significant. Source data are provided as a Source data file and detailed sample sizes are available in “Methods”.
Fig. 4
Fig. 4. Modeling a multi-stage process for adaptive immunity by integrating cell-intrinsic rhythms.
a Dynamics of the individual rhythmic components of T cell (red) and dendritic cells (DCs, blue) migration to the lymph node (LN), as well as T cell proliferation (black) as predicted by the mathematical models (ID1-3, Supplementary Table 1) with Z-score for each dynamic being shown. The solid lines indicate the mean (for T cell homing) or the best fit (for DC homing and T cell proliferation), while colored shaded areas represent 95%-confidence intervals. T cell velocity (purple) was only measured at ZT7 and ZT19, leading to a stepwise function. The orange shaded area indicates a time window for potential optimal interactions of rhythmic components around ZT7. b Mathematical model (Supplementary Note 1) describing the migration and interaction of T cells and DC to and within the LN. T-DC interactions lead to activated T cells (orange) that proliferate in a rhythmic manner, and mediate feedback on the homing and egress dynamics of T cells. c Predicted effect of individually ablating rhythmic homing (T + DC) or proliferation (T) on LN expansion at day 6 post-injection relative to an arrhythmic scenario. Individual data points show predicted fold ratio for each skin draining LNs using the best fit, with bars and whiskers indicating the mean ± 1.96 × SEM, n = 3 mice. d Schematic depicting stages of initial immune response and clock interactions. Antigen-presenting cell (APCs) trafficking is regulated by clocks in endothelial cells (green) and APCs (blue), leading to temporal variation in APC numbers reaching the LN. This feeds into rhythms in the acute LN response to influence recruitment dynamics of effector cells (red). Downstream and independent of these rhythmic events, effector cells can maintain a rhythmic proliferation capacity, ultimately leading to temporal variation in long-term immunity. e, f Leukocyte counts 48 h post-treatment in WT and T cell-specific Bmal1−/− (BMAL1ΔTcell) mice in e parotid LNs, n = 3–7 mice; and f popliteal LNs, n = 4–11 mice; two-way ANOVA with Tukey’s post test. Data are plotted as mean ± standard error of mean (SEM); ns, not significant. Source data are provided as a Source data file and detailed sample sizes are available in “Methods”.
Fig. 5
Fig. 5. Rhythms in response to vaccination.
a Germinal center B (GCB) cells as % of B cell fraction in the draining inguinal LN of T cell specific Bmal1−/− (BMAL1ΔTcell) mice 14 days following vaccination with the commercial vaccine HAVRIX; n = 5–6 mice, two-way ANOVA with Tukey’s post test. b Serum antigen-specific antibody titers 28 days after vaccination with the commercial vaccine HAVRIX; n = 4–22 mice, two-way ANOVA with Tukey’s post test. c T cell response upon antigen restimulation 28 days after vaccination with the commercial HAVRIX vaccine; n = 4–8 mice, two-way ANOVA with Tukey’s post test. Data are plotted as mean ± standard error of mean (SEM); ns, not significant. Source data are provided as a Source data file and detailed sample sizes are available in “Methods”.

References

    1. Man K, Loudon A, Chawla A. Immunity around the clock. Science. 2016;354:999–1003. doi: 10.1126/science.aah4966. - DOI - PMC - PubMed
    1. Baxter M, Ray DW. Circadian rhythms in innate immunity and stress responses. Immunology. 2020;161:261–267. doi: 10.1111/imm.13166. - DOI - PMC - PubMed
    1. Palomino-Segura M, Hidalgo A. Circadian immune circuits. J. Exp. Med. 2021;218:e20200798. doi: 10.1084/jem.20200798. - DOI - PMC - PubMed
    1. Scheiermann C, Gibbs J, Ince L, Loudon A. Clocking in to immunity. Nat. Rev. Immunol. 2018;18:423–437. doi: 10.1038/s41577-018-0008-4. - DOI - PubMed
    1. Scheiermann C, Kunisaki Y, Frenette PS. Circadian control of the immune system. Nat. Rev. Immunol. 2013;13:190–198. doi: 10.1038/nri3386. - DOI - PMC - PubMed

Publication types