

doi: 10.1038/s41592-022-01761-3.
Epub 2023 Jan 30.
LILAC: enhanced actin imaging with an optogenetic Lifeact
Affiliations
- PMID: 36717692
- PMCID: PMC10986358
- DOI: 10.1038/s41592-022-01761-3
Item in Clipboard
LILAC: enhanced actin imaging with an optogenetic Lifeact
Nat Methods.
2023 Feb.
Abstract
Lifeact is a popular peptide-based label of actin filaments in live cells. We have designed an improved Lifeact variant, LILAC, that binds to actin in light using the LOV2 protein. Light control allows the user to modulate actin labeling, enabling image analysis that leverages modulation for an enhanced view of F-actin dynamics in cells. Furthermore, the tool reduces actin perturbations and cell sickness caused by Lifeact overexpression.
© 2023. The Author(s), under exclusive licence to Springer Nature America, Inc.
Conflict of interest statement
Competing Interests
K.L.K., A.R.F., T.R.S., and R.S.R. have submitted a patent application (PCT/US2022/077754; Methods and Compositions Comprising Actin Binding Proteins) to the USA patent office.
Figures

TIRF image of an S2 cell expressing LILAC without (a) and with (c) pre-excitation image background subtraction to eliminate cytosolic background. Kymographs of the region in yellow without (c) and with (d) pre-excitation background subtraction. e) Histograms of normalized pixel intensities in the outer ring of the cell with (CV= 0.58) and without (CV=0.23) image subtraction.

TIRF images of live S2 cells expressing mCherry-LILAC taken pre- and post-488 nm (blue) laser excitation. Scale bar is 5 μm. Inset images are 3x.

TIRF images of live S2 cells expressing mCherry-LILAC taken pre- and post-488 nm (blue) laser excitation. Cells are imaged as they land on the ConA coated coverslip. Scale bar is 5 μm. Inset images are 2x.

TIRF images of fixed S2 cells expressing (a) mCherry-Lifeact or (b) mCherry-LILAC stained with phalloidin. Cells were fixed under blue light. Pearson’s correlation coefficients are displayed on the merge image. Scale bar is 5 μm.

(a) Post-excitation image of an S2 cell with pre-excitation image subtracted. (b) OLID (optical lock-in detection)26 image of an S2 cell. White pixels are correlated, black anticorrelated, and mid-gray are uncorrelated. Note the recruitment at the lamellipodium and the depletion in the cytosol. Also note how weaker lamellipodial actin signals are boosted compared to the background-subtracted image. We used the first 50 frames of a movie (0.5 s / frame) where the excitation pulse arrives in frame 2 to generate the OLID image. For details, see methods. An S2 cell expressing mCherry-LILAC before (c) and after (d) blue light excitation. The outer and inner rings of cells are hand traced in FIJI (yellow). Scale bar, 5 μm. Actin labeling ratio: ALR = Intensityouter/Intensityinner, actin switching ratio: ASR = ALRpost/ALRpre.

Max actin labeling ratio (a, R2 = 0..34, n=72) and switching ratio (b, R2=0.14, n=72) of LILAC expressing cells as a function of cell intensity. Maximum actin labeling (c, P = 0.11) and switching ratios (d, P = 9.66*10^−15) of LILAC, Lifeact, and the light-mimic mutant, LILACI539E. The center line represents the median. Boxes span the 25th and 75th percentiles. Whiskers extend from the 25th percentile - 1.5x the interquartile range (IQR) and from the 75th percentile + 1.5x IQR. Data beyond the whiskers represent outliers and are plotted individually. For c and d, P-values were determined initially using a one-way ANOVA test (n=32 for Lifeact, n=18 for LILAC, n=23 for LILACI539E). A post-hoc Dunn test was used to determine pairwise p-values. (**=P≤0.01, ***=P≤0.001, ****=P≤0.0001).

a, b, SDS-PAGE of the protein of interest (P), either mCherry- LILACI539E (a) or mCherry-Lifeact (b), in the pellet after cosedimentation with 0.5 μM actin (A). Concentration of free protein added to each lane is labeled above in μM. c, Free protein plotted against bound protein in the pellet after cosedimentation to determined binding affinities of Lifeact (Kd=3.9 μM) and LILAC539E (Kd=3.4 μM). Data was normalized to the maximum observed and fit to a hyperbola. The constitutively active form of LILAC was used because excitation of LILAC cannot be maintained in the dark ultracentrifuge.
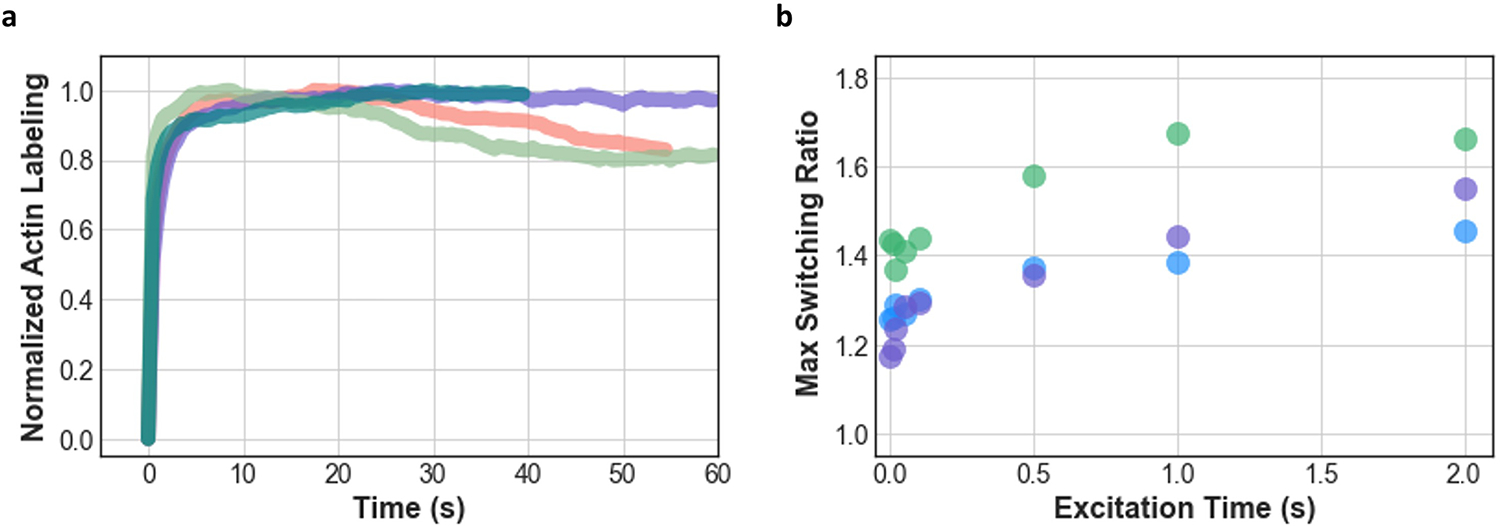
a, Min-max normalized actin labeling ratio traces for cells initially in the dark, then activated with blue light continually through the end of the movie. b, Max switching ratios for cells excited for various lengths of time at 1% laser power, colored by cell.

a, First and second recovery time constants for individual cells expressing wild type (R2=0.70, n=34) and T406A/T407A (R2=0.56, n=26) LILAC. Grey line is X=Y. b, Kernel density estimations of the first time constants for wild type (blue) and T406A/T407A (lilac) LILAC. Mean is indicated by vertical lines. c, Min-max normalized actin labeling ratio traces of LILAC(T406A/T407A )expressing cells with (teal) and without (lilac) 1mM imidazole. Cells were activated with blue light every 60 and 130 seconds respectively. d, First and second recovery time constants for individual cells expressing LILAC(T406A/T407A) with varying imidazole concentrations (R2=0.77, n=128, Pearson p=7.3e-46). Grey line is X=Y. e, First recovery time constants as a function of imidazole concentration (R2=.52, Pearson p=3.5e-24) with a linear regression fit to log-transformed data and shaded regions indicating the 95% confidence interval. Data with 0 and 1mM imidazole were taken at different times with different starter cultures of S2 cells than all other concentrations, which were imaged on the same day.

Schematics of LILAC (a) and other vectors used. a, Schematic of LILAC, including LOV2opt(AsLOV2401–543 G528A/I532A/N538E). Vectors used for protein expression (b, c) and expression in S2 cells (d-f), where TEV is the TEV protease cleavage site.

a, Sequences of the LOV2 C-terminal Jɑ helix and Lifeact. The template was created by keeping hydrophobic residues (orange) which interact with the core of LOV2, and Lifeact was integrated to minimize disrupting those interactions. Grey:LOV2, turquoise: Jɑ helix, orange: key hydrophobic residues, black: Lifeact. b, Structural representations of LOV2 (left) and LILAC (right). Actin (blue) is shown in bound to Lifeact from PDB 7AD9. LOV2 residues that sterically clash with actin in the dark state are shown in dark red. The LILAC model was created by extending the Jɑ helix of AsLOV2 (PDB 2V0W) with the residues of Lifeact in helical form. c, TIRF images of a representative S2 cell that is expressing LILAC taken before, during, and after excitation with blue light. d, Line scan of cell area highlighted in yellow in c before blue light excitation at 0 seconds and 1 to 60 seconds post excitation, where 0 μm is outside of the cell. Scale bar is 5 μm. e, Kymograph of the outer cell edge highlighted in yellow in (c), where the top is the inside of the cell, and the bottom is outside the cell. f, Actin labeling ratio (ALR) of a repeatedly excited cell. Dashed lines indicate min and max ALRs.

a, Cells at various intensities expressing Lifeact, LILAC, and LILACI539E. Cell circularity (b, P = 1.57*10−4) and cell area (d, P = 3.77*10−6) of Lifeact, LILAC, LILACI539E. The center line represents the median. Boxes span the 25th and 75th percentiles. Whiskers extend from the 25th percentile - 1.5x the interquartile range (IQR) and from the 75th percentile + 1.5x IQR. Data beyond the whiskers represent outliers and are plotted individually. Cell circularity (c), and cell area (e) as a function of intensity with a linear regression fit to log-transformed data and shaded regions indicating the 95% confidence interval. For b, and d, P-values were determined initially using a one-way ANOVA test (n=27 for Lifeact, n=18 for LILAC, n=23 for LILACI539E). A post-hoc Dunn test was used to determine pairwise p-values. (***=P≤0.001,****=P≤0.0001)
References
-
- Blanchoin L, Boujemaa-Paterski R, Sykes C & Plastino J Actin dynamics, architecture, and mechanics in cell motility. Physiol. Rev. 94, 235–263 (2014). - PubMed
Publication types
MeSH terms
Substances
Grants and funding
LinkOut - more resources
Full Text Sources
