. 2023 Feb;55(2):280-290.
doi: 10.1038/s41588-022-01295-6. Epub 2023 Jan 30.

Enhancer-promoter interactions can bypass CTCF-mediated boundaries and contribute to phenotypic robustness

Affiliations

Enhancer-promoter interactions can bypass CTCF-mediated boundaries and contribute to phenotypic robustness

Shreeta Chakraborty et al. Nat Genet. 2023 Feb.

Abstract

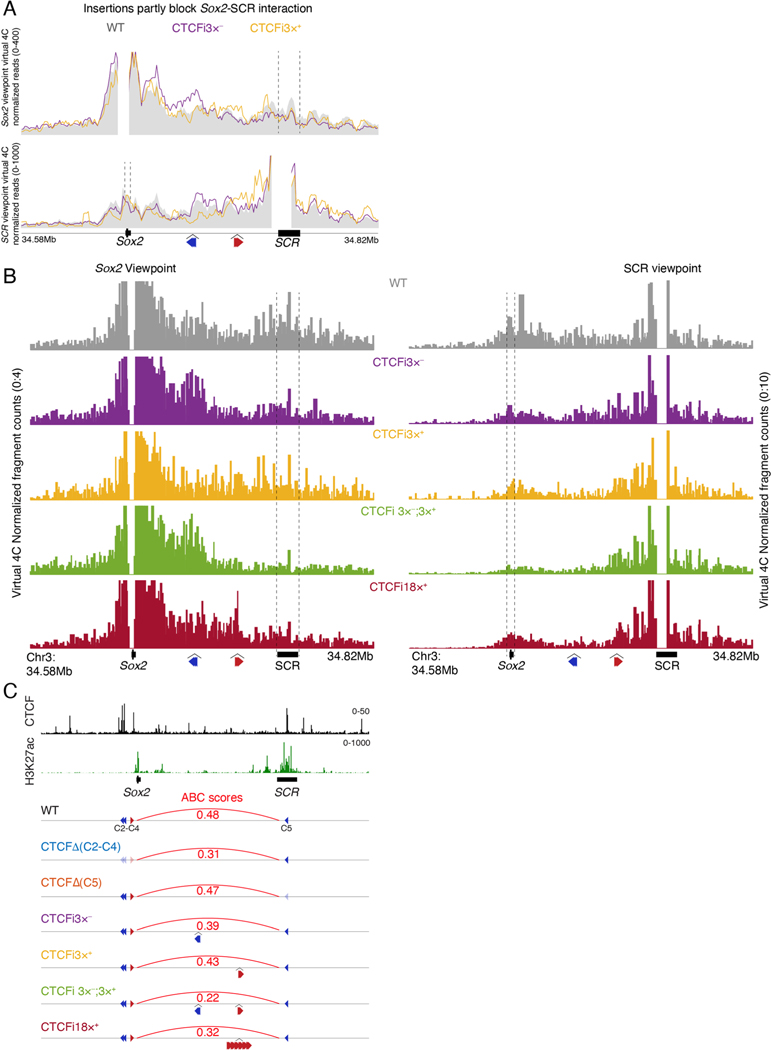
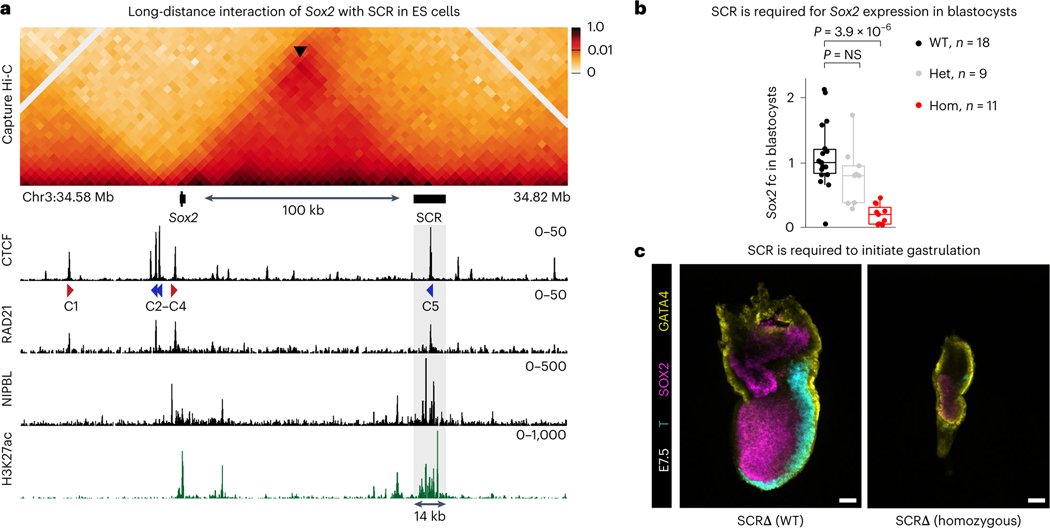
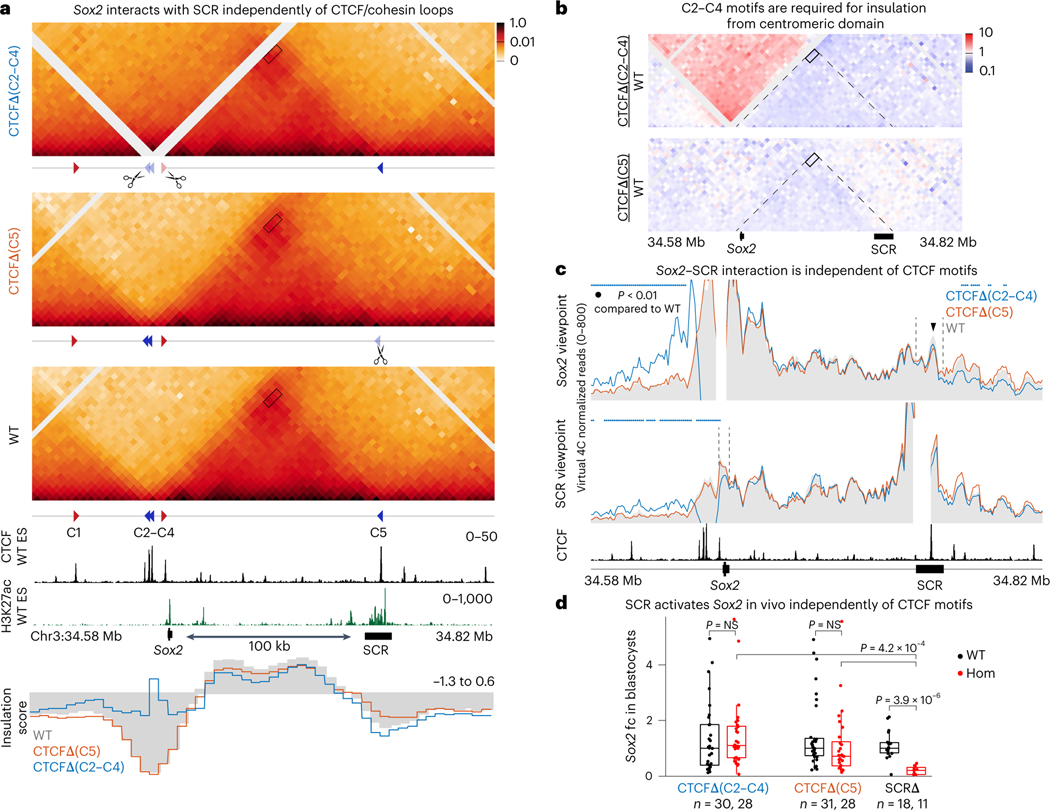
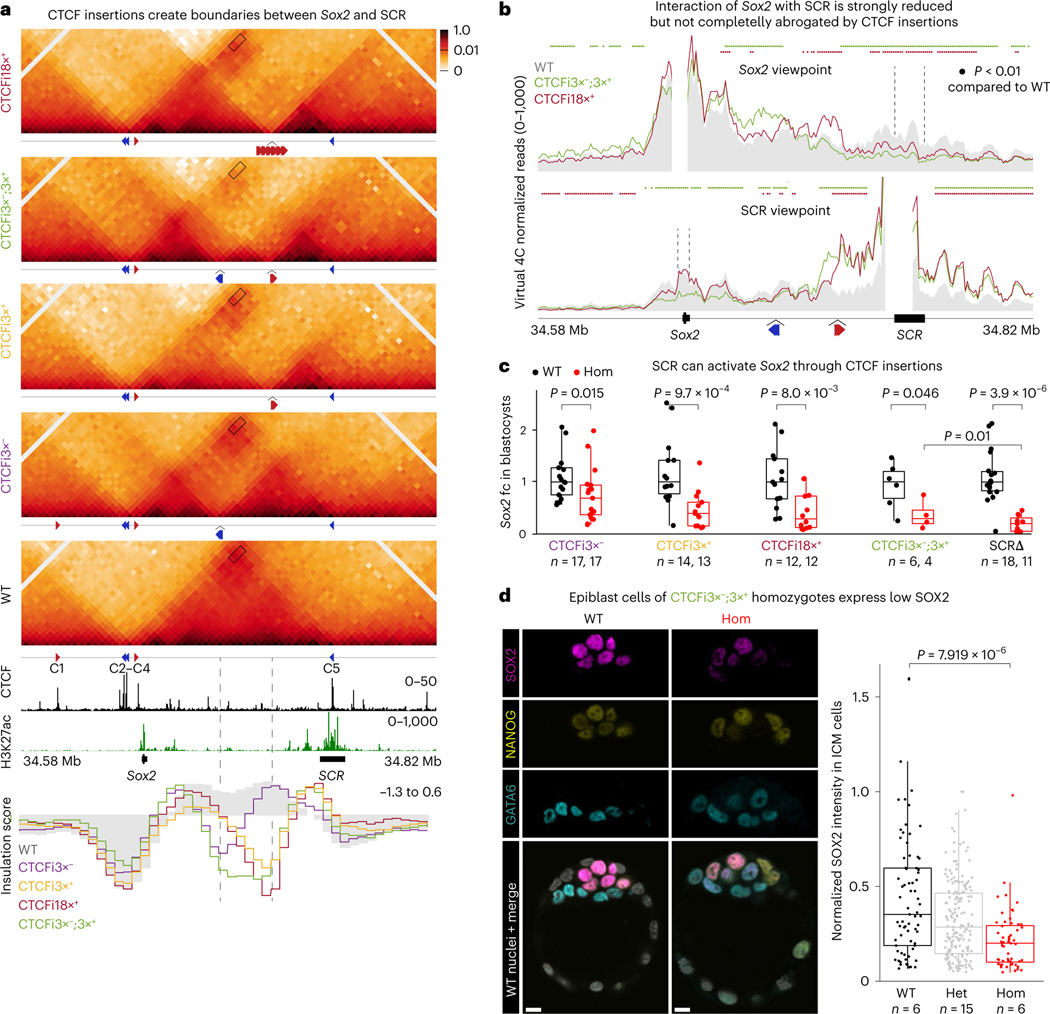
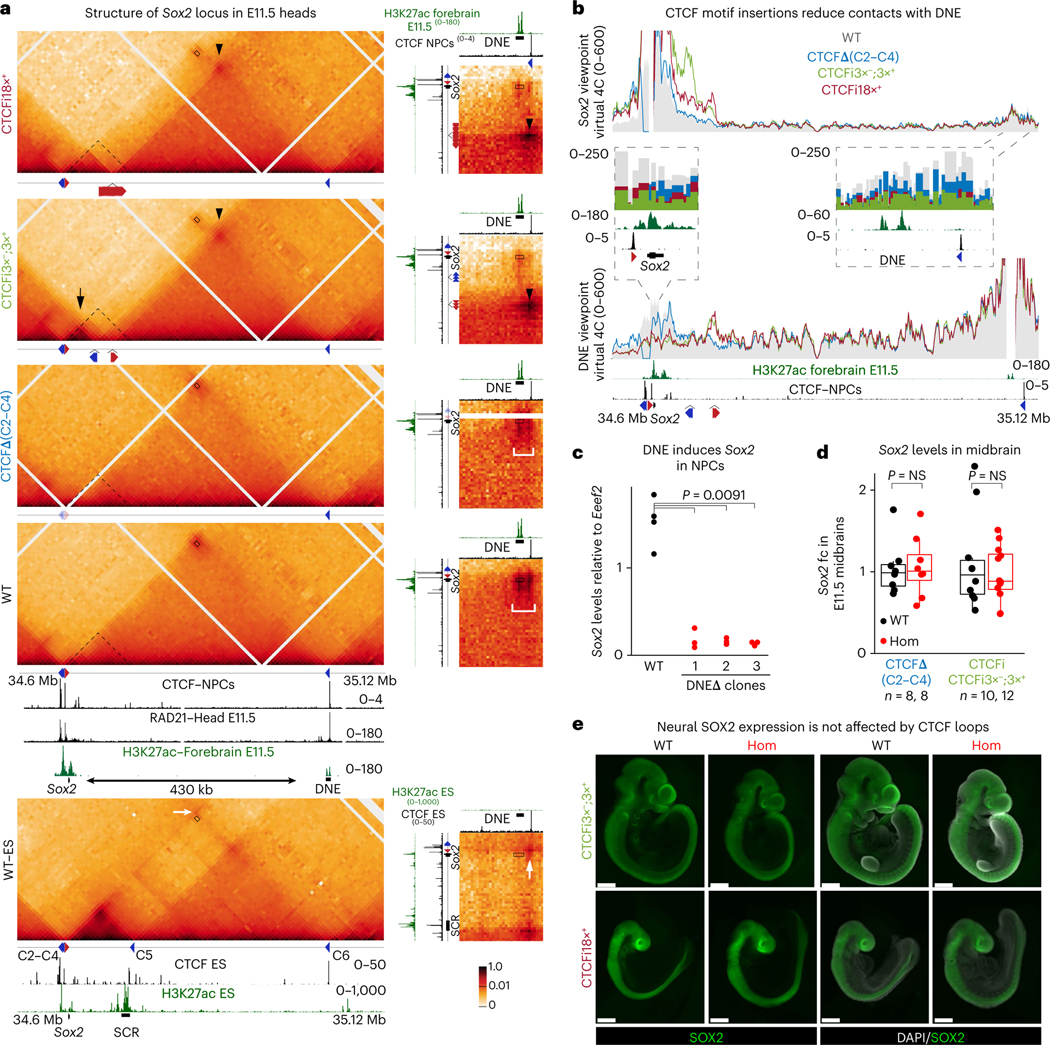
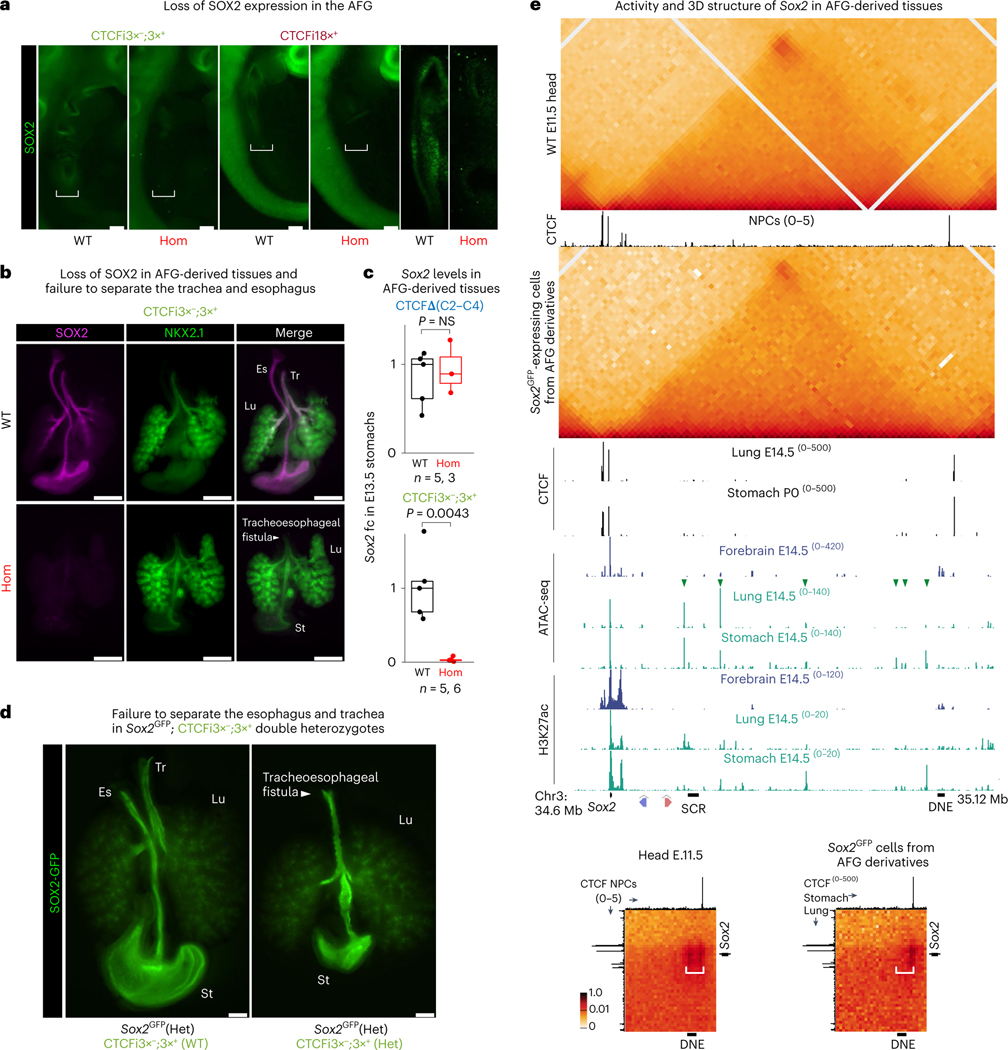
How enhancers activate their distal target promoters remains incompletely understood. Here we dissect how CTCF-mediated loops facilitate and restrict such regulatory interactions. Using an allelic series of mouse mutants, we show that CTCF is neither required for the interaction of the Sox2 gene with distal enhancers, nor for its expression. Insertion of various combinations of CTCF motifs, between Sox2 and its distal enhancers, generated boundaries with varying degrees of insulation that directly correlated with reduced transcriptional output. However, in both epiblast and neural tissues, enhancer contacts and transcriptional induction could not be fully abolished, and insertions failed to disrupt implantation and neurogenesis. In contrast, Sox2 expression was undetectable in the anterior foregut of mutants carrying the strongest boundaries, and these animals fully phenocopied loss of SOX2 in this tissue. We propose that enhancer clusters with a high density of regulatory activity can better overcome physical barriers to maintain faithful gene expression and phenotypic robustness.


Conflict of interest statement

Competing interests

The authors declare no competing interests.

Figures

Extended Data Fig. 1 |
Extended Data Fig. 1 |. SCR is required for Sox2 expression.
a Sox2 and SCR activity during early mouse development as assessed by enrichment of H3K27ac and ATAC-seq. SCR is active in pluripotent epiblast cells, and in germ cells that regain a pluripotent status. H3K27ac CUT&RUN in mES cells cultured in epiblast-like conditions shows enrichment at both Sox2 and SCR but not in cells differentiated into primitive endoderm (PrE). No H3K27ac is detected at Sox2 or SCR in the visceral endoderm of post-implantation embryos and SCR activity is diminished in epiblast cells. Despite strong enrichment at the Sox2 gene body in the neural tube and forebrain of E11.5 embryos, SCR is no longer active. Instead, other proximal regions (black arrow) show increased activity. ATAC-seq data shows that both male and female primordial germ cells, but not the surrounding soma, are enriched in accessible chromatin at SCR. b Regions targeted for deletion in the SCRΔ line and gRNAs used. Browser shot shows enrichment of NANOG, SOX2, OCT4 and H3K27ac over Sox2 and SCR in ES cells. Nucleotides in red represent the protospacer sequence of gRNAs used for injection. Underlined nucleotides highlight location of the Cas9 PAM in the mouse genome. Regions targeted in previous studies are show also with black boxes. Arrows on both sides of the deletion highlight the ligation junction detected in the mouse used as founder as determined by Sanger sequencing. c IF of E4.5 blastocysts stained with antibodies targeting GATA6, NANOG and SOX2. In the quantification plots, each dot represents a cell and to allow comparison across three different litters, the intensity of each cell was normalized by the cell with highest intensity in heterozygous embryos. Number of embryos analyzed for each genotype is shown below the plot. Boxplots show minimum, maximum, median, first, and third quartiles. A Wilcoxon two-sided test was performed to assess statistical significance. Scale bar represents 10 μm.
Extended Data Fig. 2 |
Extended Data Fig. 2 |. SCR activates Sox2 independently of CTCF.
a Scheme depicting targeting strategy for generation of the two CTCF deletion lines. Browser shot shows enrichment of CTCF, NANOG, SOX2, OCT4 and H3K27ac over Sox2 and SCR. A NANOG/SOX2/OCT4 peak showing high enrichment was deleted in the CTCFΔ(C2-C4) but this region has been previously shown to not be required for mouse development. Browser shots with zoomed-in views of CTCF enrichment at Sox2 and SCR show precise location of gRNAs used in zygotic injections. CTCF peak nearest the most centromeric gRNA used in the CTCFΔ(C2-C4) targeting does not contain a significant CTCF motif according to FIMO. This peak was nonetheless deleted in the CTCFΔ(C2-C4) line. Nucleotides in red represent the protospacer sequence of gRNAs used for injection. Underlined nucleotides highlight location of the Cas9 PAM in the mouse genome. Arrows on both sides of the deletion highlight ligation junction detected in the mouse used as founder as determined by Sanger sequencing. For the CTCFΔ(C5) scheme, purple line highlights location of the CTCF motif at SCR. The central sequence of the repair template is shown, with parts of the protospacer sequence used in the gRNA shown in red, and the restriction enzyme target that replaced the CTCF motif in blue. Full sequence of homology arms on both sides is omitted. b Differential CHi-C interaction frequency heatmaps. Red signal represents interactions occurring at higher frequency in mutant cell lines compared to control and blue shows interactions of lower frequency. Dotted lines represent the Sox2-SCR domain as detected in WT control cells.
Extended Data Fig. 3 |
Extended Data Fig. 3 |. SCR induces Sox2 independently of CTCF.
a Virtual 4C plots using the Sox2 and SCR viewpoints at DpnII-fragment resolution. Plots in main figure show overlapping 5 kb windows. These plots can be used to also visualize the maintenance of Sox2-SCR interactions. Region surrounding viewpoint was removed from analysis. Dotted lines highlight SCR in the Sox2 viewpoint (left), and Sox2 in the SCR viewpoint (right). Virtual 4C signal is shown as average of the 2 replicates at the fragment level. b Deletion of CTCF motifs on the centromeric and telomeric end of the Sox2-SCR domain does not affect interactions and Sox2 expression. Left-qPCR analysis of Sox2 expression in ES cells was done using the ΔΔCT method and Gapdh as a reference. Sox2 expression was calculated by comparing it to the median WT clones. Each dot represents a different ES cell clone. The number of independent cell lines(n) analyzed of each genotype was 2. Boxplots show minimum, maximum, median, first, and third quartiles. A Wilcoxon two-sided test was performed to assess statistical significance. Right-CHi-C 1D interaction frequency heatmap in homozygotic CTCFΔ(C2-C4) + (C5) mES cells compared to WT.
Extended Data Fig. 4 |
Extended Data Fig. 4 |. SCR can activate Sox2 across CTCF-mediated insulation.
a Top left scheme depicts targeting strategy for generation of the transgenic lines carrying insertion of CTCF motifs. Arcs represent CTCF-mediated loops generated in each insertion line as predicted by the loop-extrusion model. We assumed that the sites where cassettes were targeted did not contain regulatory elements based on conservation and analysis of ENCODE datasets. Top right browser shows CTCF ChIP-seq enrichment and insertion sites of CTCF transgenes. Left bottom panel shows the targeting of the C57Bl6 genome to generate CTCFi3× mice. Right bottom panel shows targeting to generate CTCFi3×+, CTCFi3×;3×+, and CTCFi18×+ mice. Nucleotides shown in red represent the protospacer sequence of gRNAs used for injection while underlined nucleotides highlight location of the Cas9 PAM in the mouse mm10 genome. gRNA mm10 coordinates are shown in red. The central sequence of the repair templates is shown, with parts of the protospacer sequence used in the gRNA shown in red and mutated PAM nucleotides underlined. The complete sequence of homology arms on both sides is omitted. Each colored rectangle represents a different region from the mouse genome containing a CTCF motif and adjacent regions. Complete sequences of the CTCF motifs and adjacent regions are shown in different color with the central CTCF motif in blue representing targeting to negative strand in the CTCFi3× line. The first and last two nucleotides of each of the three CTCF regions are shown in the schema of the repair template. The same three CTCF-carrying regions were used in CTCFi3× and CTCFi3×+ lines but targeted to different strands and locations. Therefore, the central region of repair template is the same but in different strands and containing different repair templates. Retargeting of the CTCFi3×+ transgene on a homozygous CTCFi3× background generated the CTCFi3×;3×+ line. The CTCFi18×+ line was obtained as a consequence of the CTCFi3×+ injection because of concatemerization of the repair template. The resulting allele is shown in the bottom right. b Differential CHi-C interaction frequency heatmap. Red signal represents interactions occurring at higher frequency in mutant cell lines compared to control. Dotted lines represent insertion sites of CTCF transgenes.
Extended Data Fig. 5 |
Extended Data Fig. 5 |. SCR can interact with Sox2 across CTCF-mediated insulation.
a Virtual 4C plot using Sox2 and SCR viewpoints. Region surrounding viewpoint was removed from analysis. Dotted lines highlight SCR in the Sox2 viewpoint (top), and Sox2 in the SCR viewpoint (bottom). Virtual 4C signal is shown as average of the 2 replicates of each genotype in 5 kb overlapping windows. b Virtual 4C plot using Sox2 and SCR viewpoints at DpnII-fragment resolution. This same signal at 5 kb overlapping bins is shown in A and in the main figure. This representation highlights how, despite massively reduced, Sox2 can interact with SCR in all lines generated. Region surrounding viewpoint was removed from analysis. Dotted lines highlight SCR in the Sox2 viewpoint (left), and Sox2 in the SCR viewpoint (right). Virtual 4C signal is shown as average of the 2 replicates of each genotype at DpnII fragment resolution. c Results from ABC model using WT H3K27ac and CHi-C data from each of our mutants. The lower score in CTCFΔ(C2-C4) mutants is likely related to the 5 kb windows used for analysis, which cause a very strong artificial reduction in CHi-C signal on these cells that have an 8 kb deletion very near the Sox2 promoter.
Extended Data Fig. 6 |
Extended Data Fig. 6 |. DNE also induces Sox2 across CTCF-mediated insulation.
a Interaction frequency heatmap determined by CHi-C in heads of E11.5 embryos. Insets on the right show 2D interaction heatmaps highlighting interactions between regions surrounding Sox2 and DNE. CTCF data shown under CHi-C heatmaps from heads is derived from in vitro differentiated neural progenitor cells. Rectangles represent the Sox2-DNE interaction, arrowheads represent loops with CTCF downstream of DNE established by transgene insertions, black arrow represent loops with CTCF upstream of Sox2 established by transgene insertions. b Insulation scores for 5 kb windows in this region are shown where lower levels represent higher insulation. CTCFi18×+ shows the strongest insulation score while CTCFi3×;3×+ displays the largest ectopic boundary. c Differential CHi-C interaction frequency heatmap. Red signal represents interactions occurring at higher frequency in mutant cell lines compared to control. Black arrow highlights formation of a highly interacting domain containing Sox2 and the proximal neural enhancers.
Extended Data Fig. 7 |
Extended Data Fig. 7 |. DNE can activate Sox2 across CTCF-mediated insulation.
a Virtual 4C plot using Sox2 and DNE viewpoints with signal plotted at each DpnII fragment. This same signal at 5 kb overlapping bins is shown in the main figure. This representation highlights how, despite massively reduced, Sox2 can interact with DNE in all lines assessed. Signal is shown as average of the 2 replicates of each genotype. Region surrounding viewpoint was removed from analysis. Dotted lines highlight DNE in the Sox2 viewpoint (left), and Sox2 in the DNE viewpoint (right). Virtual 4C signal is shown as average of the 2 replicates of each genotype at DpnII fragment resolution. b IF of E11.5 embryos stained with an antibody targeting SOX2. Scale bar represents 500 μm. 2 embryos of each genotype were stained and imaged.
Extended Data Fig. 8 |
Extended Data Fig. 8 |. Developmental defects seen in homozygous embryos with modifications of the Sox2 locus.
a Transverse section of E13.5 CTCFi3×;3×+ wt and homozygote littermates at heart level. Es-esophagus, Tr-trachea. 3 embryos from each genotype were sectioned, stained and imaged. Scale bar represents 100 μm b Genotyping at of living animals at weaning, P0 and E18.5 for the indicated strains. P values were calculated using a two-tailed chi-squared test. The viability of homozygous CTCFi3× and CTCFi3×+ animals provides strong evidence that insertion of CTCF cassettes did not disrupt regulatory elements and that the phenotypes seen in CTCFi3×;3×+ and CTCFi18×+ homozygotes are caused by perturbations to the chromatin structure of the Sox2 locus. In agreement with our observation that 1 of 9 post-implantation E6.5 mutant embryos initiated gastrulation (Fig. 1c), we recovered a few SCRΔ homozygotes at weaning but at a highly reduced frequency compared to the expected ratio. This could be explained by SCR losing activity following implantation, suggesting that embryos that successfully implant despite SCR deletion can complete development. In line with absence of SOX2 expression in the AFG of E9.5 embryos, we only recovered 3 CTCFi18×+homozygous pups alive at P0 (out of 15 expected) and none at weaning. As the three pups found at P0 were observed during delivery we speculate that they would perish within a few hours as all other analyzed pups of this line. c Frontal sections of E18.5 CTCFi3×;3×+ wt and homozygote littermates. Asterisk highlights cleft palate defect. 3 embryos from each genotype were sectioned, stained and imaged. Scale bar represents 500 μm. d Plot of normalized Sox2 expression in single cells of WT E8.25 embryos. 16 biologically independent embryos (n) were analyzed. Boxplots show minimum, maximum, median, first, and third quartiles. Plot was modified from marionilab. cruk.cam.ac.uk/organogenesis/.
Fig. 1 |
Fig. 1 |. SCR is required for Sox2 expression in epiblast cells.
a, CHi-C 1D interaction frequency heatmap in WT mES cells (top). Black arrowhead points to the center of the Sox2–SCR interaction and this corner signal overlaps with CTCF binding suggesting the formation of a CTCF-mediated loop. Publicly available ChIP-seq of RAD21, CTCF and NIPBL as well as CUT&RUN of H3K27ac in mES cells are shown at the bottom. CTCF motif orientation (red and blue arrowheads) is shown for significant CTCF motifs (Q < 0.05) as detected by FIMO. Shaded box shows deleted region in SCRΔ mice. b, qPCR analysis of Sox2 expression in blastocysts at E3.5 was done using the ΔΔCT method and Gapdh as a reference. Sox2 expression was calculated by comparing it to the median of all analyzed WT embryos. Each dot represents a single blastocyst. The number of biologically independent blastocysts (n) analyzed of each genotype is shown in the legend. Boxplots show minimum, maximum, median, first and third quartiles. A Wilcoxon two-sided test was performed to assess statistical significance. Het, heterozygous; Hom, homozygous. c, E6.5–E7.5 embryos were stained for GATA4, T and SOX2. Eight of nine SCRΔ homozygotes showed arrested development shortly after implantation and failed to initiate gastrulation as shown by T expression. Eight of eight WT and heterozygotes displayed correct pattern of T expression. Scale bars, 80 μm.
Fig. 2 |
Fig. 2 |. SCR activates Sox2 expression independently of CTCF.
a, CHi-C 1D interaction frequency heatmaps in homozygotic CTCFΔ(C2–C4) and CTCFΔ(C5) mES cells, compared to WT. Rectangles represent the Sox2–SCR interaction. Insulation scores for 5-kb windows in this region are shown below publicly available CTCF and H3K27ac enrichment tracks. Lower scores represent higher insulation. b, Differential CHi-C interaction frequency heatmap. Red signal represents interactions occurring at higher frequency in mutant cell lines compared to control and the blue shows interactions of lower frequency. Dashed lines represent the Sox2–SCR domain as detected in WT control cells. c, Virtual 4C plots using the Sox2 and SCR viewpoints. Region surrounding viewpoint was removed from the analysis. Dashed lines highlight SCR in the Sox2 viewpoint (top) and Sox2 in the SCR viewpoint (bottom). Virtual 4C signal is shown as the average of the two replicates in 5-kb overlapping windows. Colored dots represent regions of statistically significant difference compared to WT (adj. P < 0.01). Black arrowhead indicates region of the highest intensity of the Sox2–SCR interaction, which overlaps with the SCR–CTCF motif. d, qPCR analysis of Sox2 expression in blastocysts at E3.5 was done using the ΔΔCT method and Gapdh as a reference. Sox2 expression was calculated by comparing it to the median of all analyzed WT embryos. Each dot represents a single blastocyst. The number of biologically independent blastocysts (n) analyzed of each genotype is shown below the plot. Boxplots show minimum, maximum, median, first and third quartiles. A Wilcoxon two-sided test was performed to assess statistical significance.
Fig. 3 |
Fig. 3 |. SCR can activate Sox2 across CTCF-mediated insulation.
a, CHi-C 1D interaction frequency heatmaps in homozygotic mES cells of the CTCFi3×, CTCFi3×+, CTCFi18×+ and CTCFi3×;3×+ strains compared to WT. Rectangles show the Sox2–SCR interaction. Inserted CTCF motif orientation and position in each mutant are shown below the plots. Insulation scores for 5-kb windows are shown below publicly available CTCF and H3K27ac tracks. Dashed lines below heatmap show CTCF insertion sites. b, Virtual 4C plots using the Sox2 and SCR viewpoints. Dashed lines highlight SCR in the Sox2 viewpoint (top) and Sox2 in the SCR viewpoint (bottom). Region surrounding viewpoint was removed from analysis. Virtual 4C signal is shown as the average of the two replicates in 5-kb overlapping windows. Colored dots represent regions of statistically significant difference compared to WT using a Wald test and after correction for multiple comparisons (Q < 0.01). c, qPCR analysis of Sox2 expression in blastocysts at E3.5 was done using the ΔΔCT method and Gapdh as a reference. Sox2 expression was compared to the median of all WT embryos. Each dot represents a blastocyst and a Wilcoxon two-sided test assessed statistical significance. The number of biologically independent blastocysts (n) analyzed of each genotype is shown below the plot. Boxplots show minimum, maximum, median, first and third quartiles. d, IF of blastocysts with antibodies targeting GATA6, NANOG and SOX2. Each dot in the quantification plots represents the signal intensity of a single cell normalized by the cell with the highest intensity in heterozygotes. The number of biologically independent blastocysts (n) analyzed of each genotype is shown below the plot. Boxplots show minimum, maximum, median, first and third quartiles. A Wilcoxon two-sided test was performed to assess statistical significance. Scale bars, 10 μm.
Fig. 4 |
Fig. 4 |. DNE also induces Sox2 across CTCF-mediated insulation.
a, CHi-C 1D interaction frequency heatmap in E11.5 heads. Data of WT ES cells are shown for comparison (bottom). Insets on the right show 2D interaction heatmaps highlighting interactions between regions surrounding Sox2 and DNE. CTCF ChIP-seq publicly available data were obtained from in vitro differentiated neural progenitor cells. RAD21 ChIP-seq was performed on E11.5 heads isolated as for CHi-C. 2D insets show the same tracks on the x and y axes but at different locations. Rectangles represent the Sox2–DNE interaction, arrowheads represent loops with CTCF downstream of DNE established by transgene insertions, black arrow represents loops with CTCF upstream of Sox2 established by transgene insertions, white arrow represents loops in ES cells between CTCF upstream of Sox2 and CTCF downstream of DNE, white brackets in the insets highlight the region between DNE and CTCF. Dashed triangle in head CHi-C represents the Sox2–SCR interaction domain detected in ES cells. b, Virtual 4C plots using Sox2 and DNE viewpoints using 5-kb overlapping windows and signal are shown as an average of the two replicates of each genotype. Region surrounding viewpoint was removed from the analysis. Insets show signal at DpnII fragments. c, qPCR analysis of Sox2 expression in NPCs was done using the standard curve dilution method and Eef2 as a reference. Each dot represents a technical replicate and three individual mutant cell lines (n) were analyzed. A Wilcoxon two-sided test assessed the statistical significance by comparing WT to all mutant clones combined. d, qPCR analysis of Sox2 expression in E11.5 midbrains was done using the ΔΔCT method and Gapdh as a reference. Sox2 expression was compared to the median of all WT embryos. Each dot represents one embryo and a Wilcoxon two-sided test assessed statistical significance. The number of biologically independent embryos (n) analyzed for each genotype is shown in the legend. Boxplots show minimum, maximum, median, first and third quartiles. e, IF of E9.5–10.5 embryos stained with an antibody targeting SOX2. Three homozygotes of each line were stained and imaged together with two WT littermates. Scale bars, 500 μm.
Fig. 5 |
Fig. 5 |. CTCF loops can completely insulate Sox2 from its AFG-specific enhancers.
a, IF of E9.5–10.5 embryos stained with an antibody targeting SOX2. Bracket highlights the AFG. First four images were taken with a dissection microscope and the two on the right with a confocal microscope. Three homozygotes of each line were stained and imaged together with two WT littermates. Scale bars, 150 μm. b, IF with antibodies targeting SOX2 and NKX2.1 using dissected E13.5 AFG-derived tissues. Tr, trachea; Es, esophagus; Lu, lungs; St, stomach. Six embryos of each genotype were stained and imaged. Scale bars, 500 μm. c, qPCR analysis of Sox2 expression in stomach at E13.5 was done using the ΔΔCT method and Gapdh as a reference. Sox2 expression was calculated by comparing it to the median of all analyzed WT embryos. Each dot represents a single embryo. The number of embryos (n) analyzed for each genotype is shown below the plot. Boxplots show minimum, maximum, median, first and third quartiles. A Wilcoxon two-sided test was performed to assess statistical significance. d, GFP expression in AFG-derived organs dissected from E15.5 fetuses originating from crosses between CTCFi3×;3×+ and Sox2GFP heterozygous mice. Three embryos of each genotype were imaged. Scale bars, 500 μm. e, CHi-C 1D interaction frequency heatmaps in WT E11.5 heads (top) and GFP+ cells from E11.5–12.5 AFG-derived tissues dissected from Sox2GFP heterozygotes (bottom). Publicly available CTCF, ATAC-seq and H3K27ac enrichment data from different tissues are shown below the heatmaps. Green arrowheads indicate putative regulatory elements with tissue-specific activity in AFG derivatives. Insets show a 2D interaction heatmap where y axis shows region centered around Sox2 and x axis shows region around a CTCF motif downstream of DNE. For the E11.5 head inset, CTCF data from NPCs are shown on both axes. For AFG-derived tissues, CTCF from stomach is shown on x axis and from lungs on the y axis. White bracket highlights the DNE and CTCF regions. In the AFG, the signal is restricted to the CTCF motifs and not to DNE.

Comment in

References

    1. Long HK, Prescott SL & Wysocka J. Ever-changing landscapes: transcriptional enhancers in development and evolution. Cell 167, 1170–1187 (2016). - PMC - PubMed
    1. de Laat W. & Duboule D. Topology of mammalian developmental enhancers and their regulatory landscapes. Nature 502, 499–506 (2013). - PubMed
    1. Schuijers J. et al. Transcriptional dysregulation of MYC reveals common enhancer-docking mechanism. Cell Rep. 23, 349–360 (2018). - PMC - PubMed
    1. Kubo N. et al. Promoter-proximal CTCF binding promotes distal enhancer-dependent gene activation. Nat. Struct. Mol. Biol. 28, 152–161 (2021). - PMC - PubMed
    1. Tang Z. et al. CTCF-mediated human 3D genome architecture reveals chromatin topology for transcription. Cell 163, 1611–1627 (2015). - PMC - PubMed

Publication types