. 2023 Feb;24(2):320-336.
doi: 10.1038/s41590-022-01402-z. Epub 2023 Jan 30.

Enhancer-instructed epigenetic landscape and chromatin compartmentalization dictate a primary antibody repertoire protective against specific bacterial pathogens

Affiliations

Enhancer-instructed epigenetic landscape and chromatin compartmentalization dictate a primary antibody repertoire protective against specific bacterial pathogens

E Mauricio Barajas-Mora et al. Nat Immunol. 2023 Feb.

Abstract

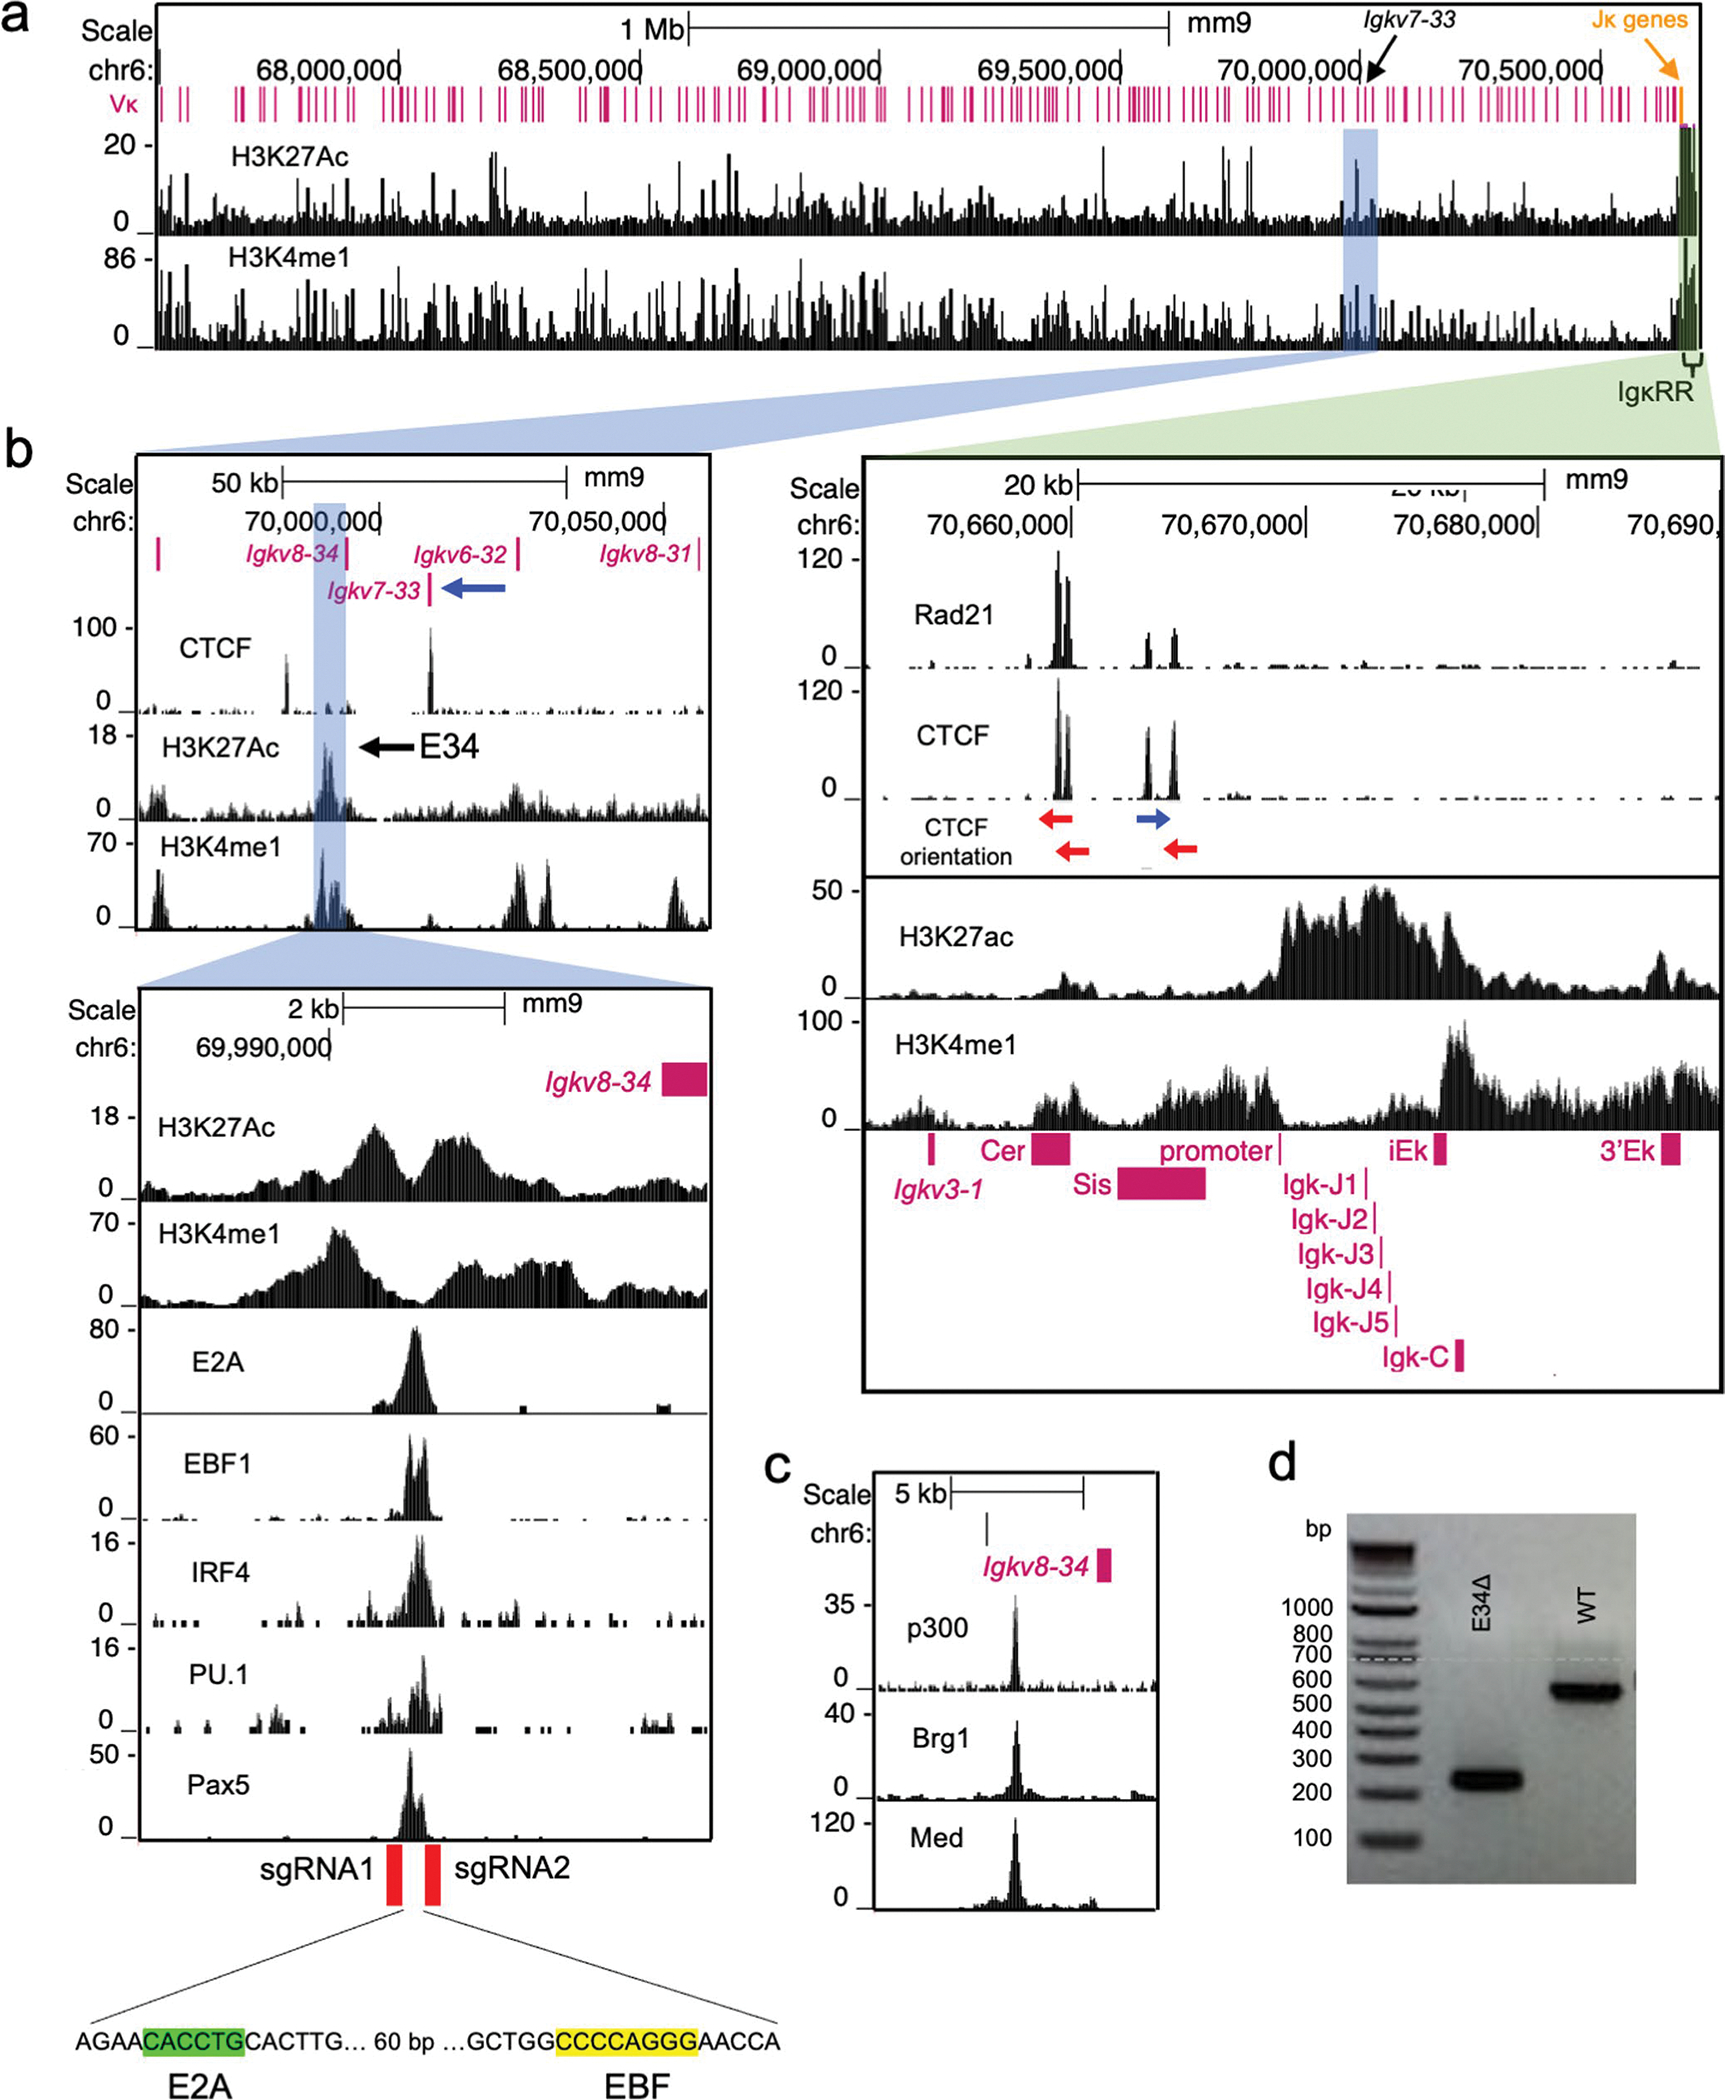
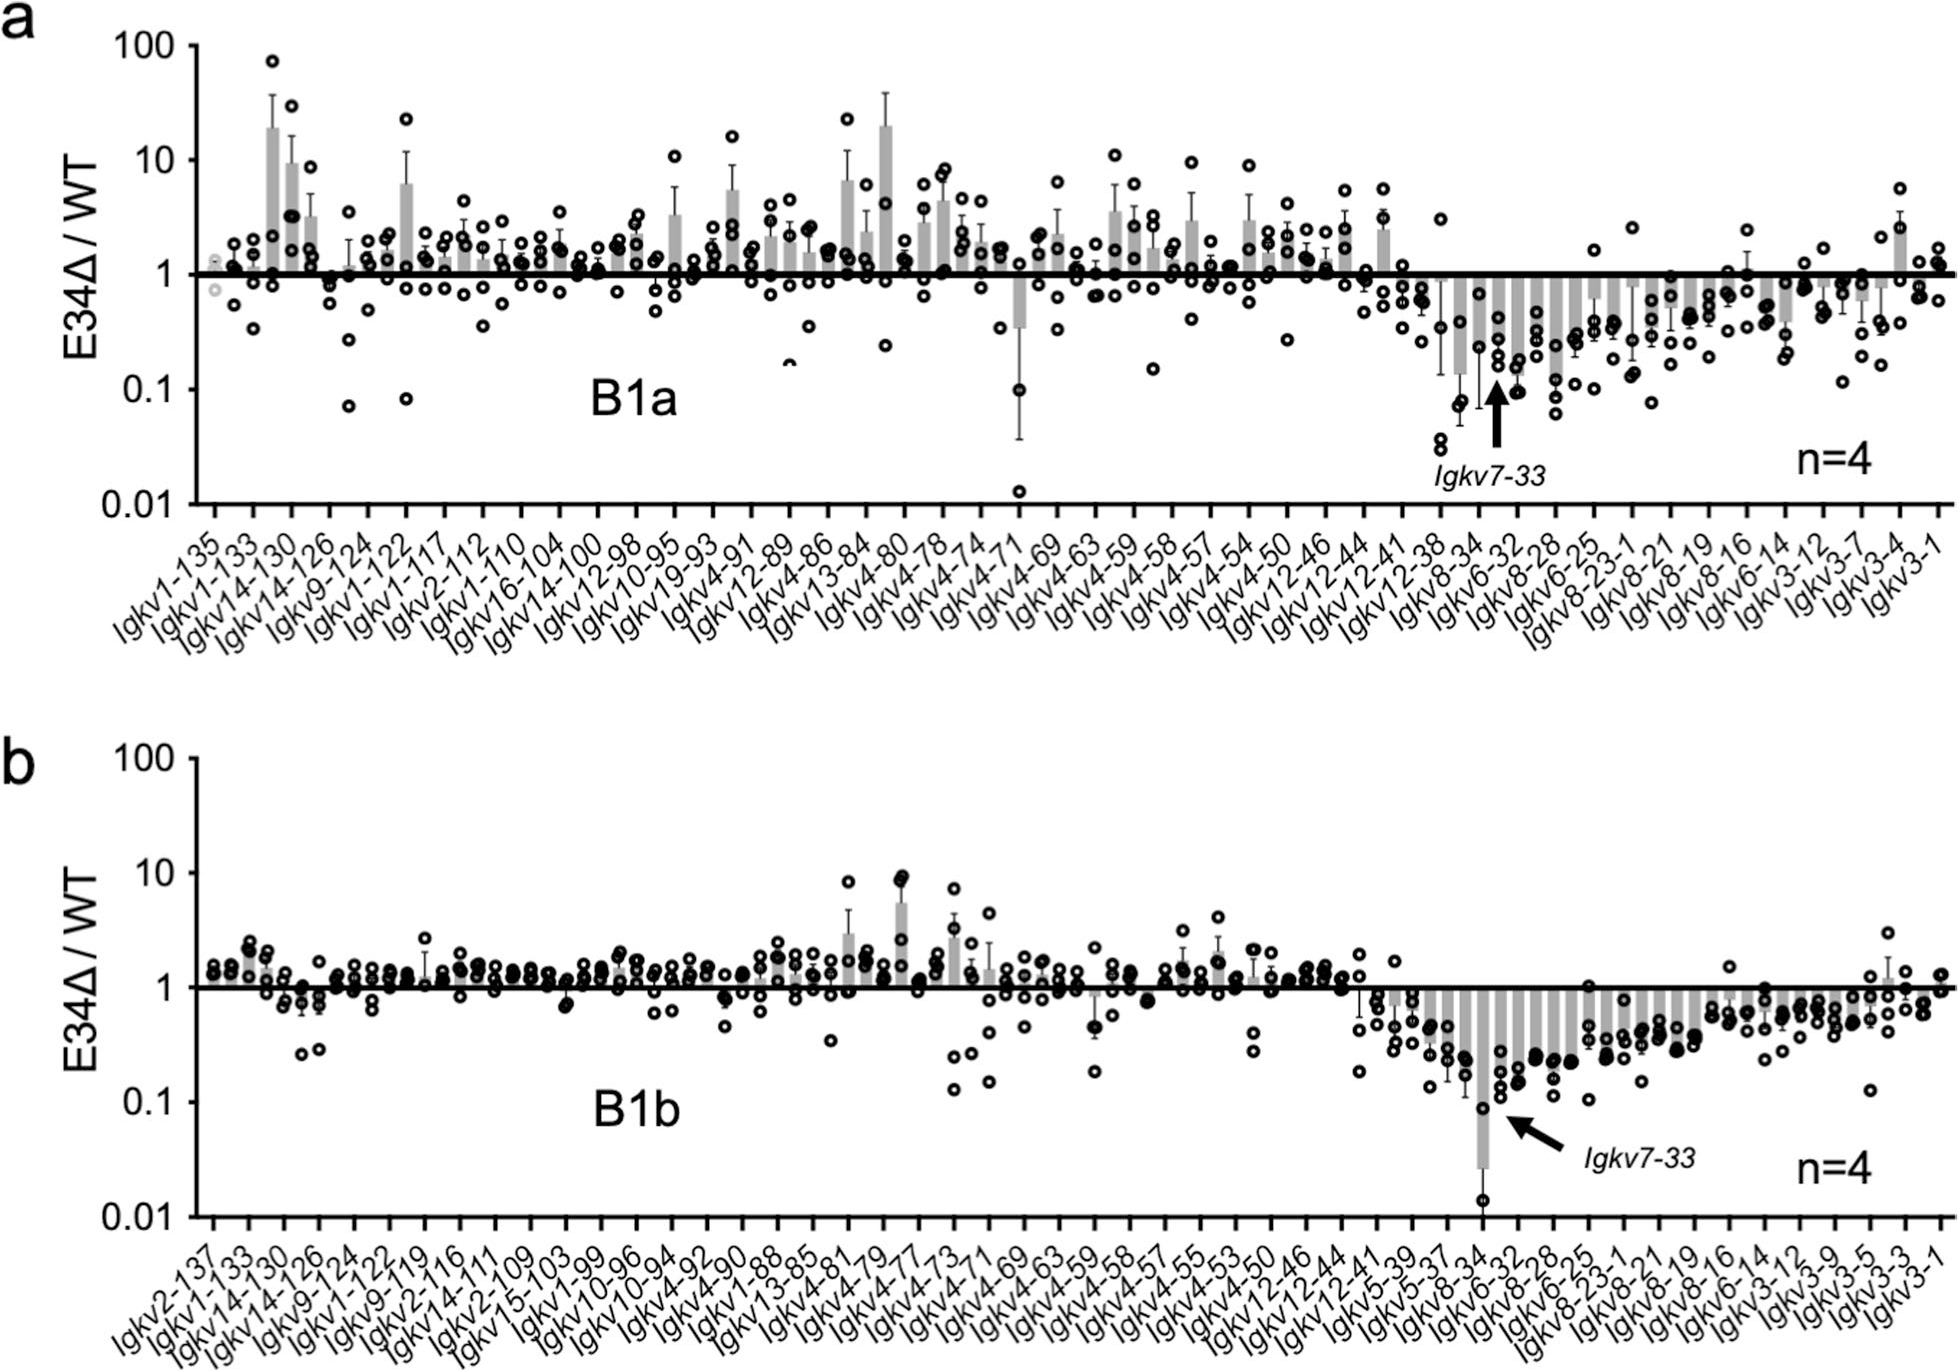
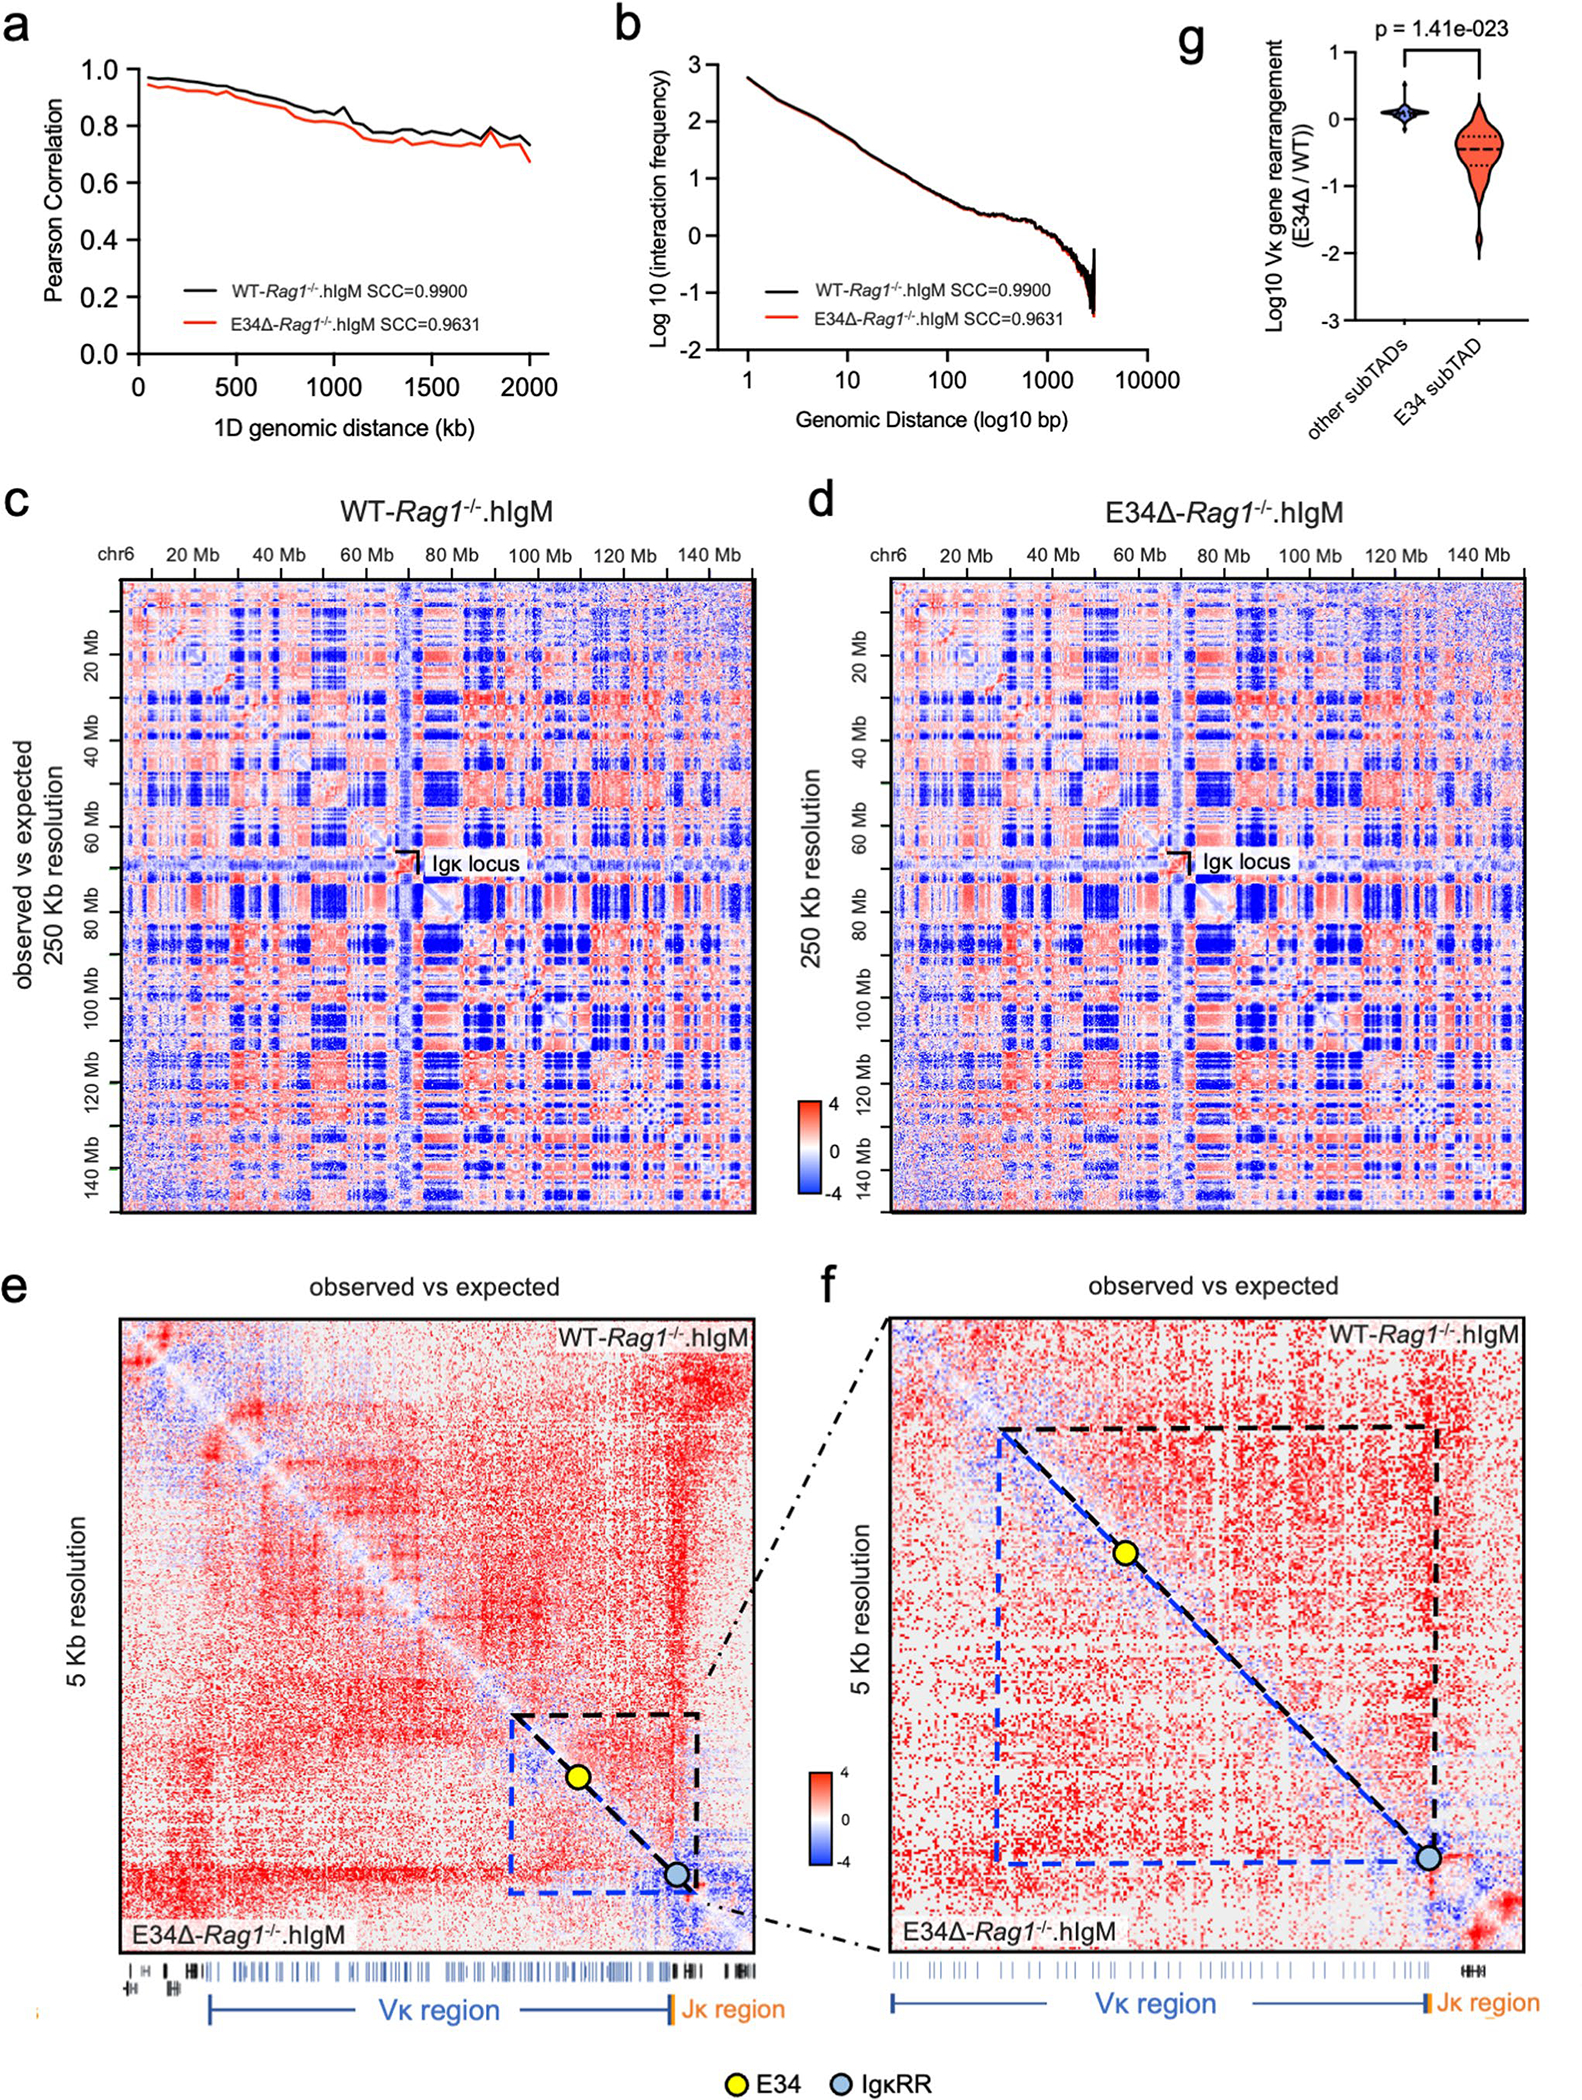
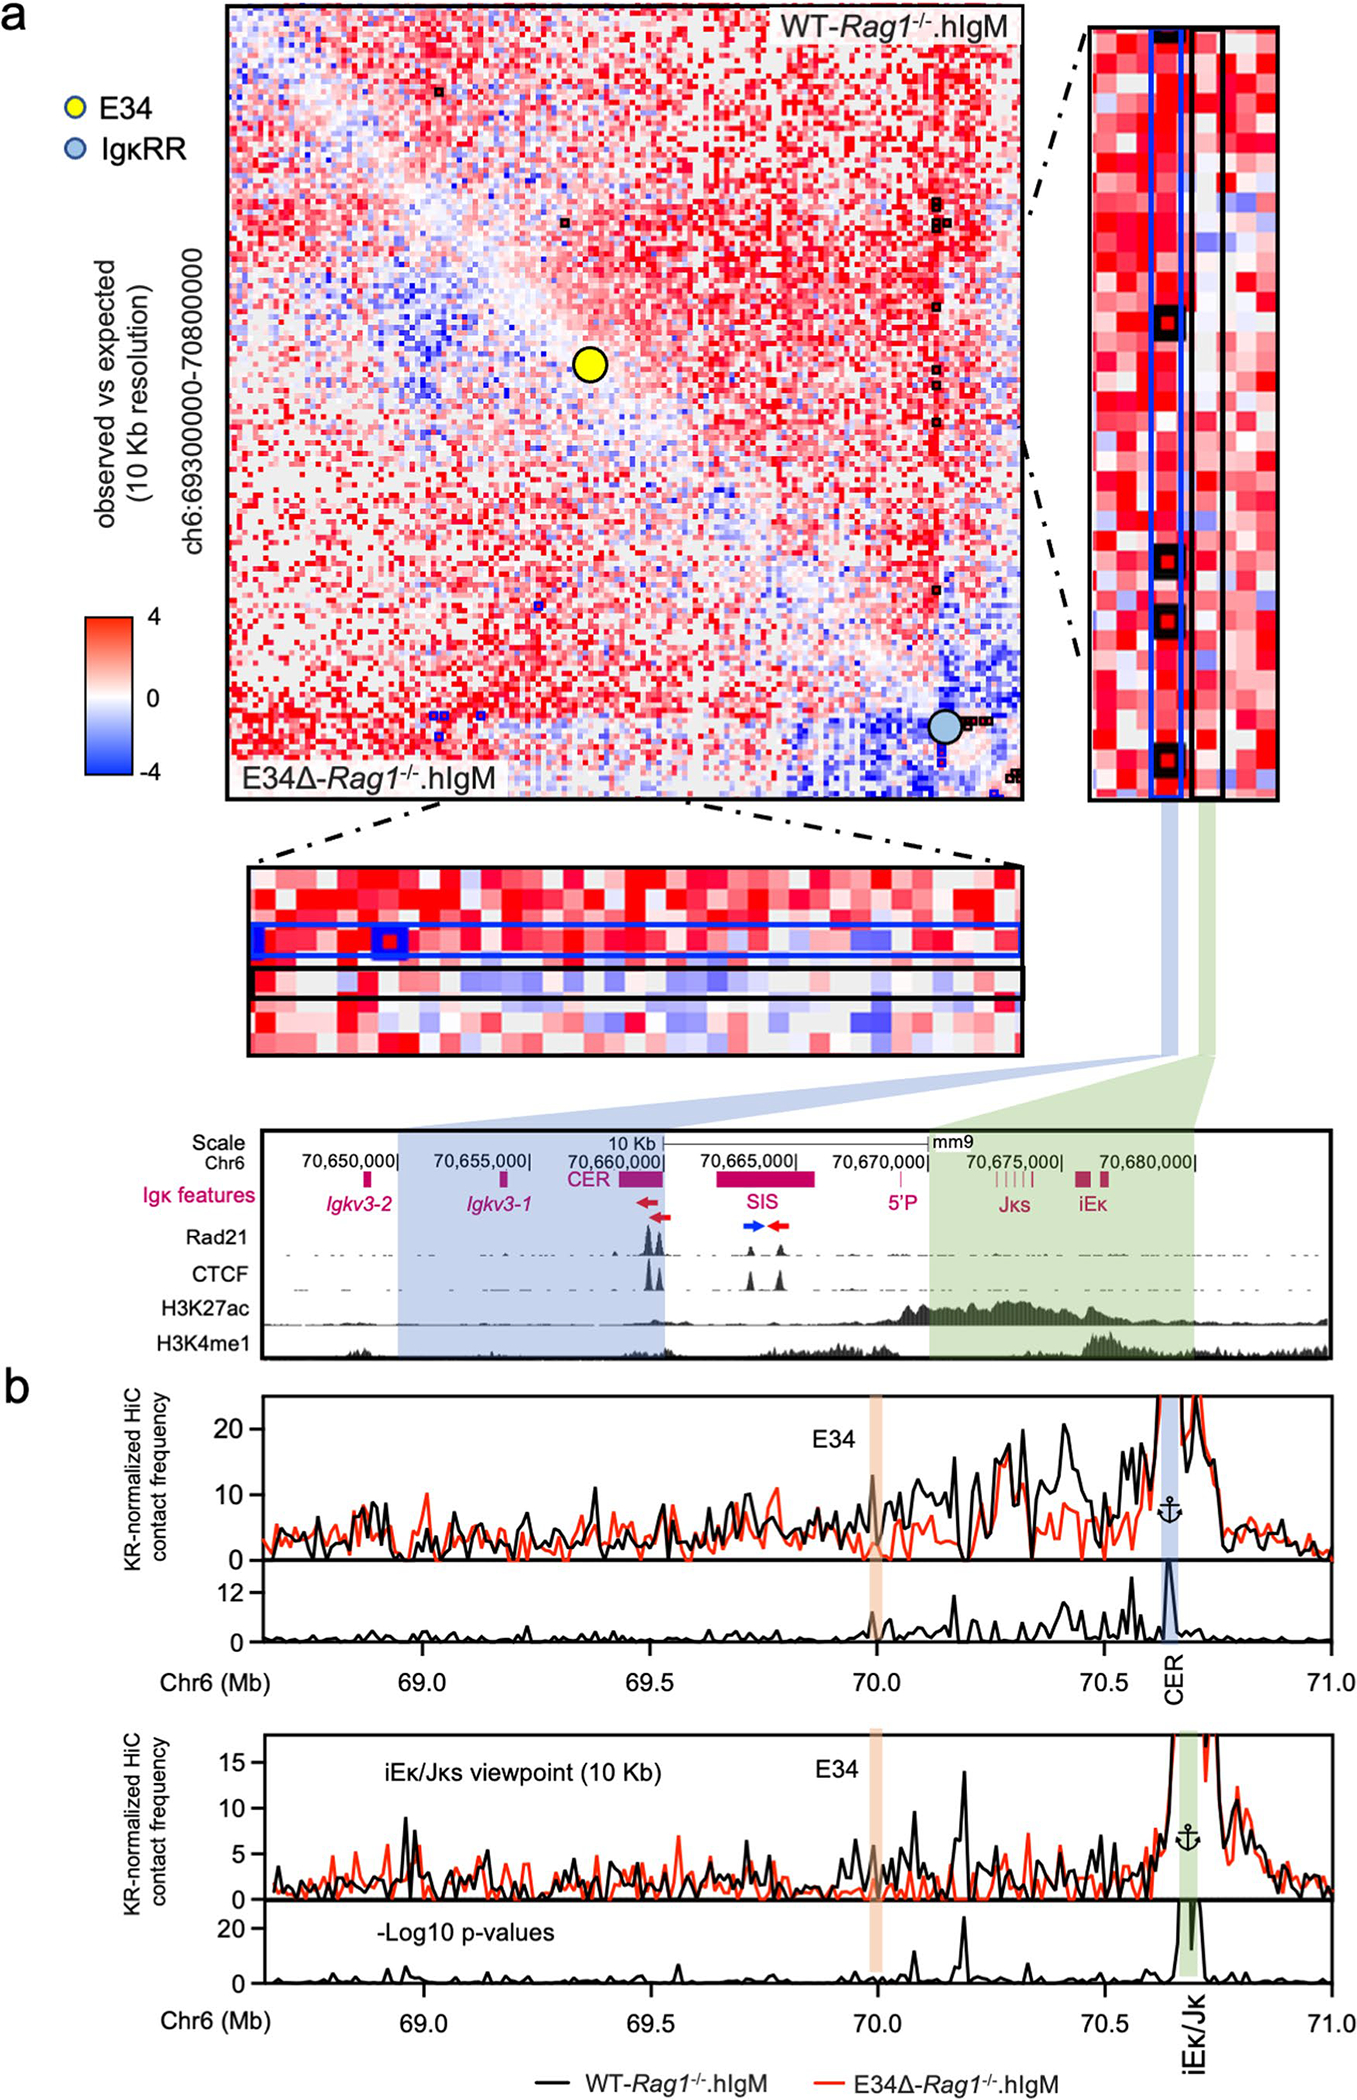
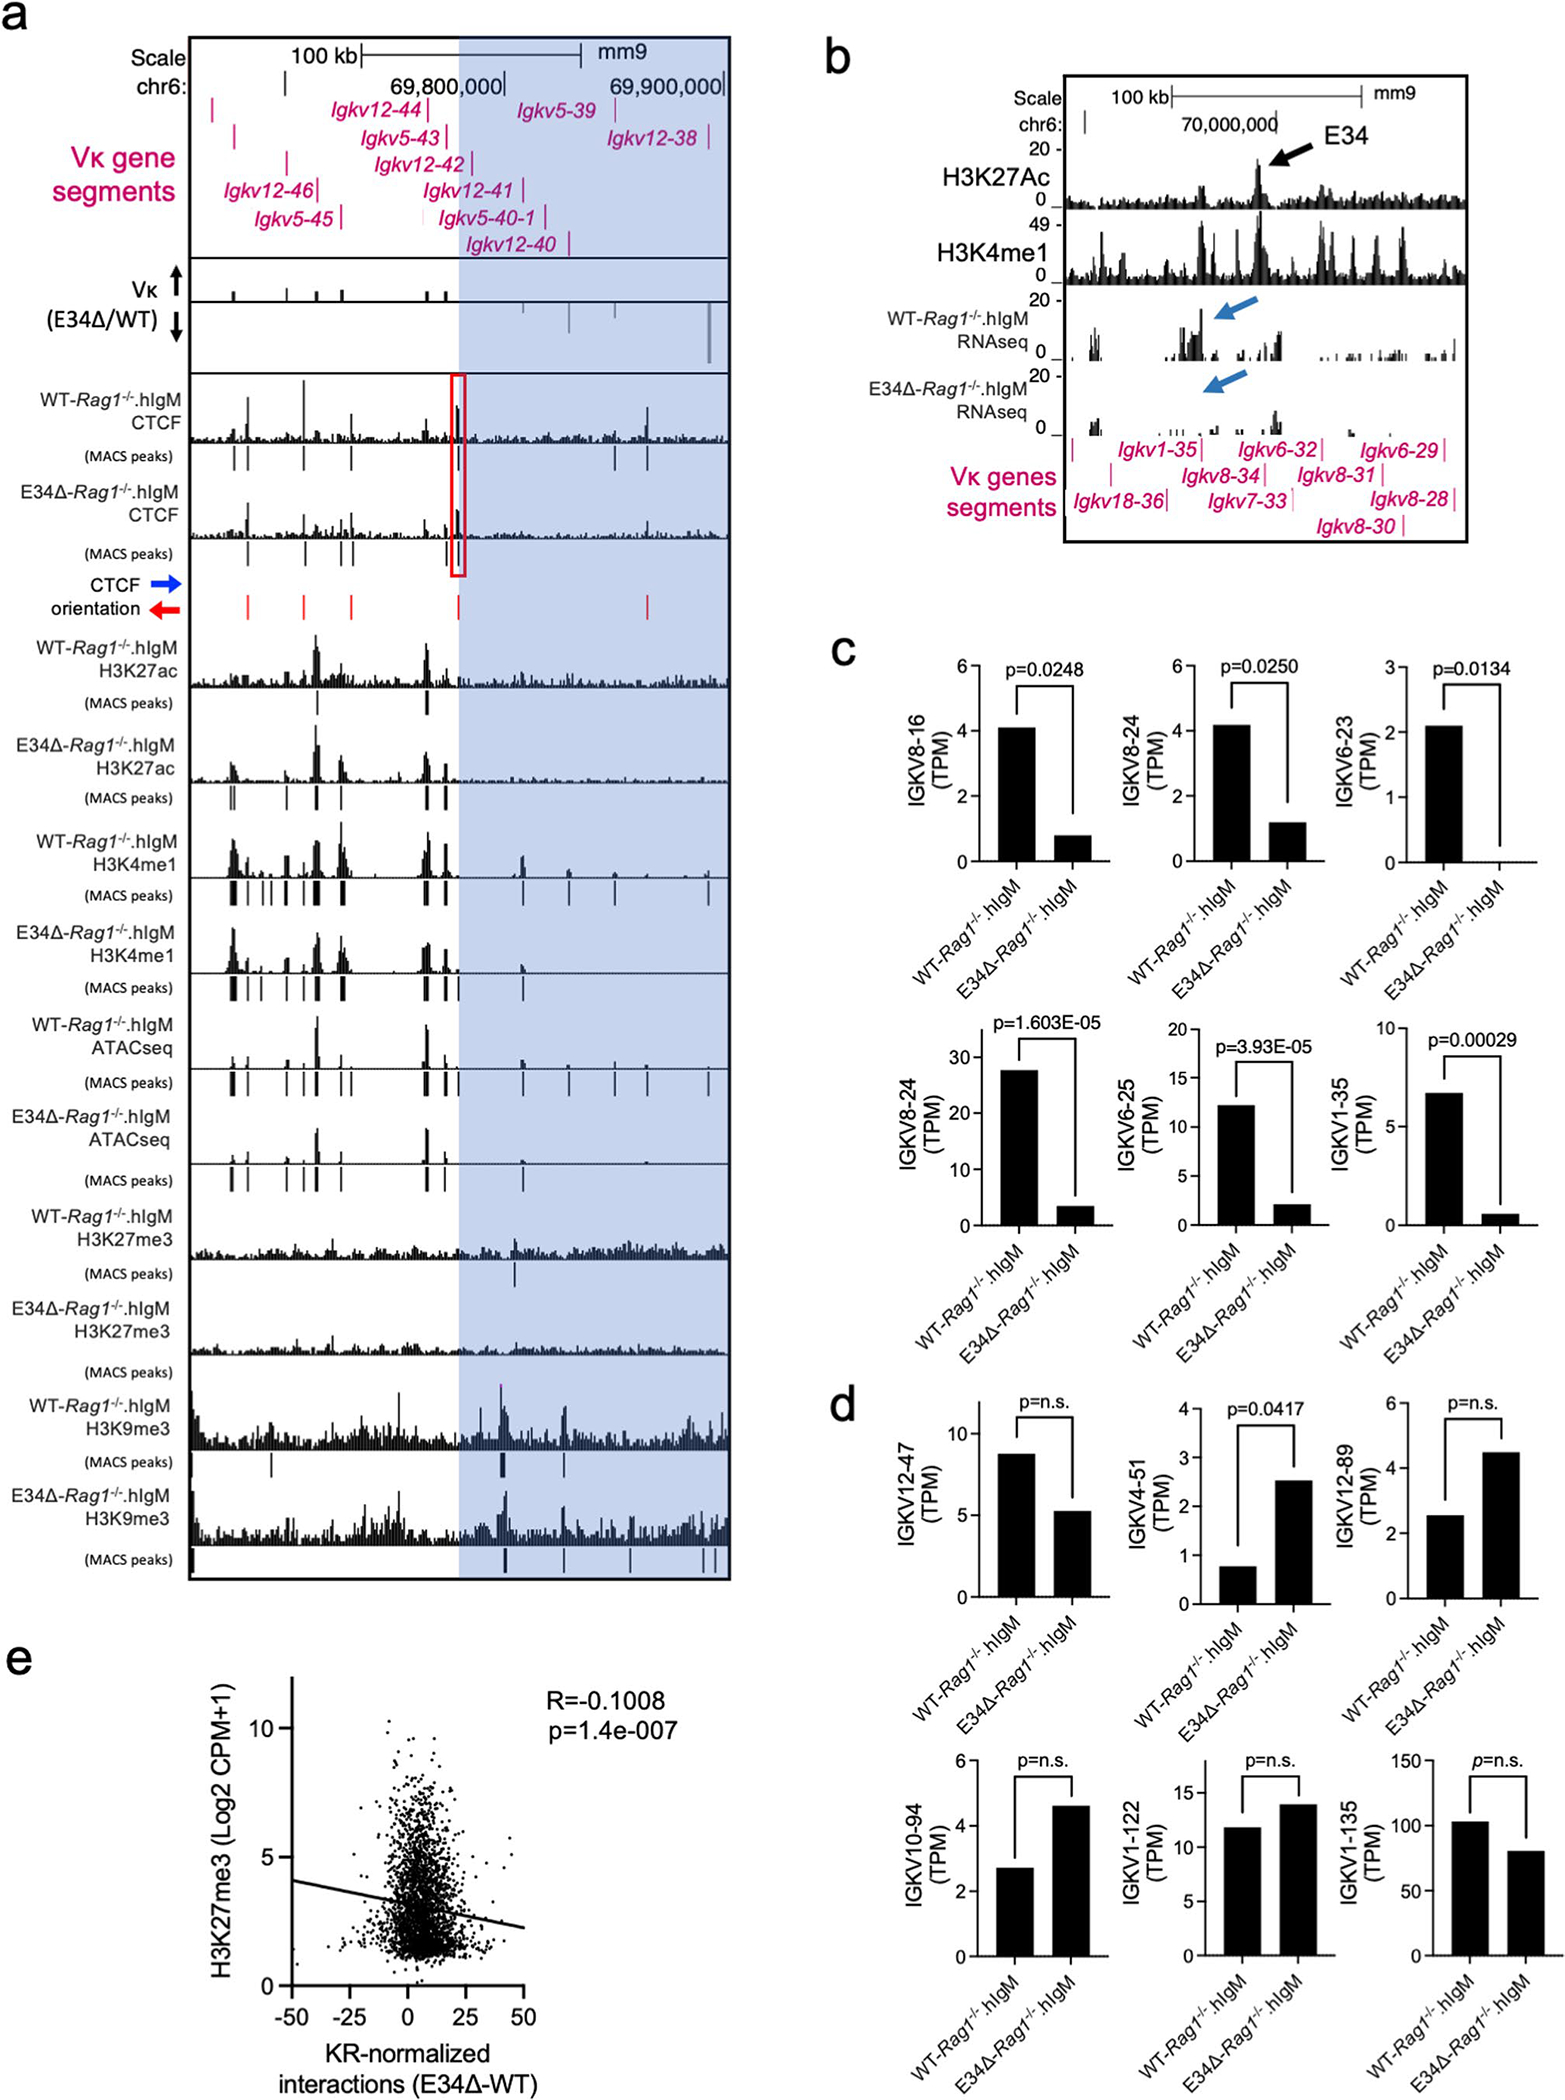
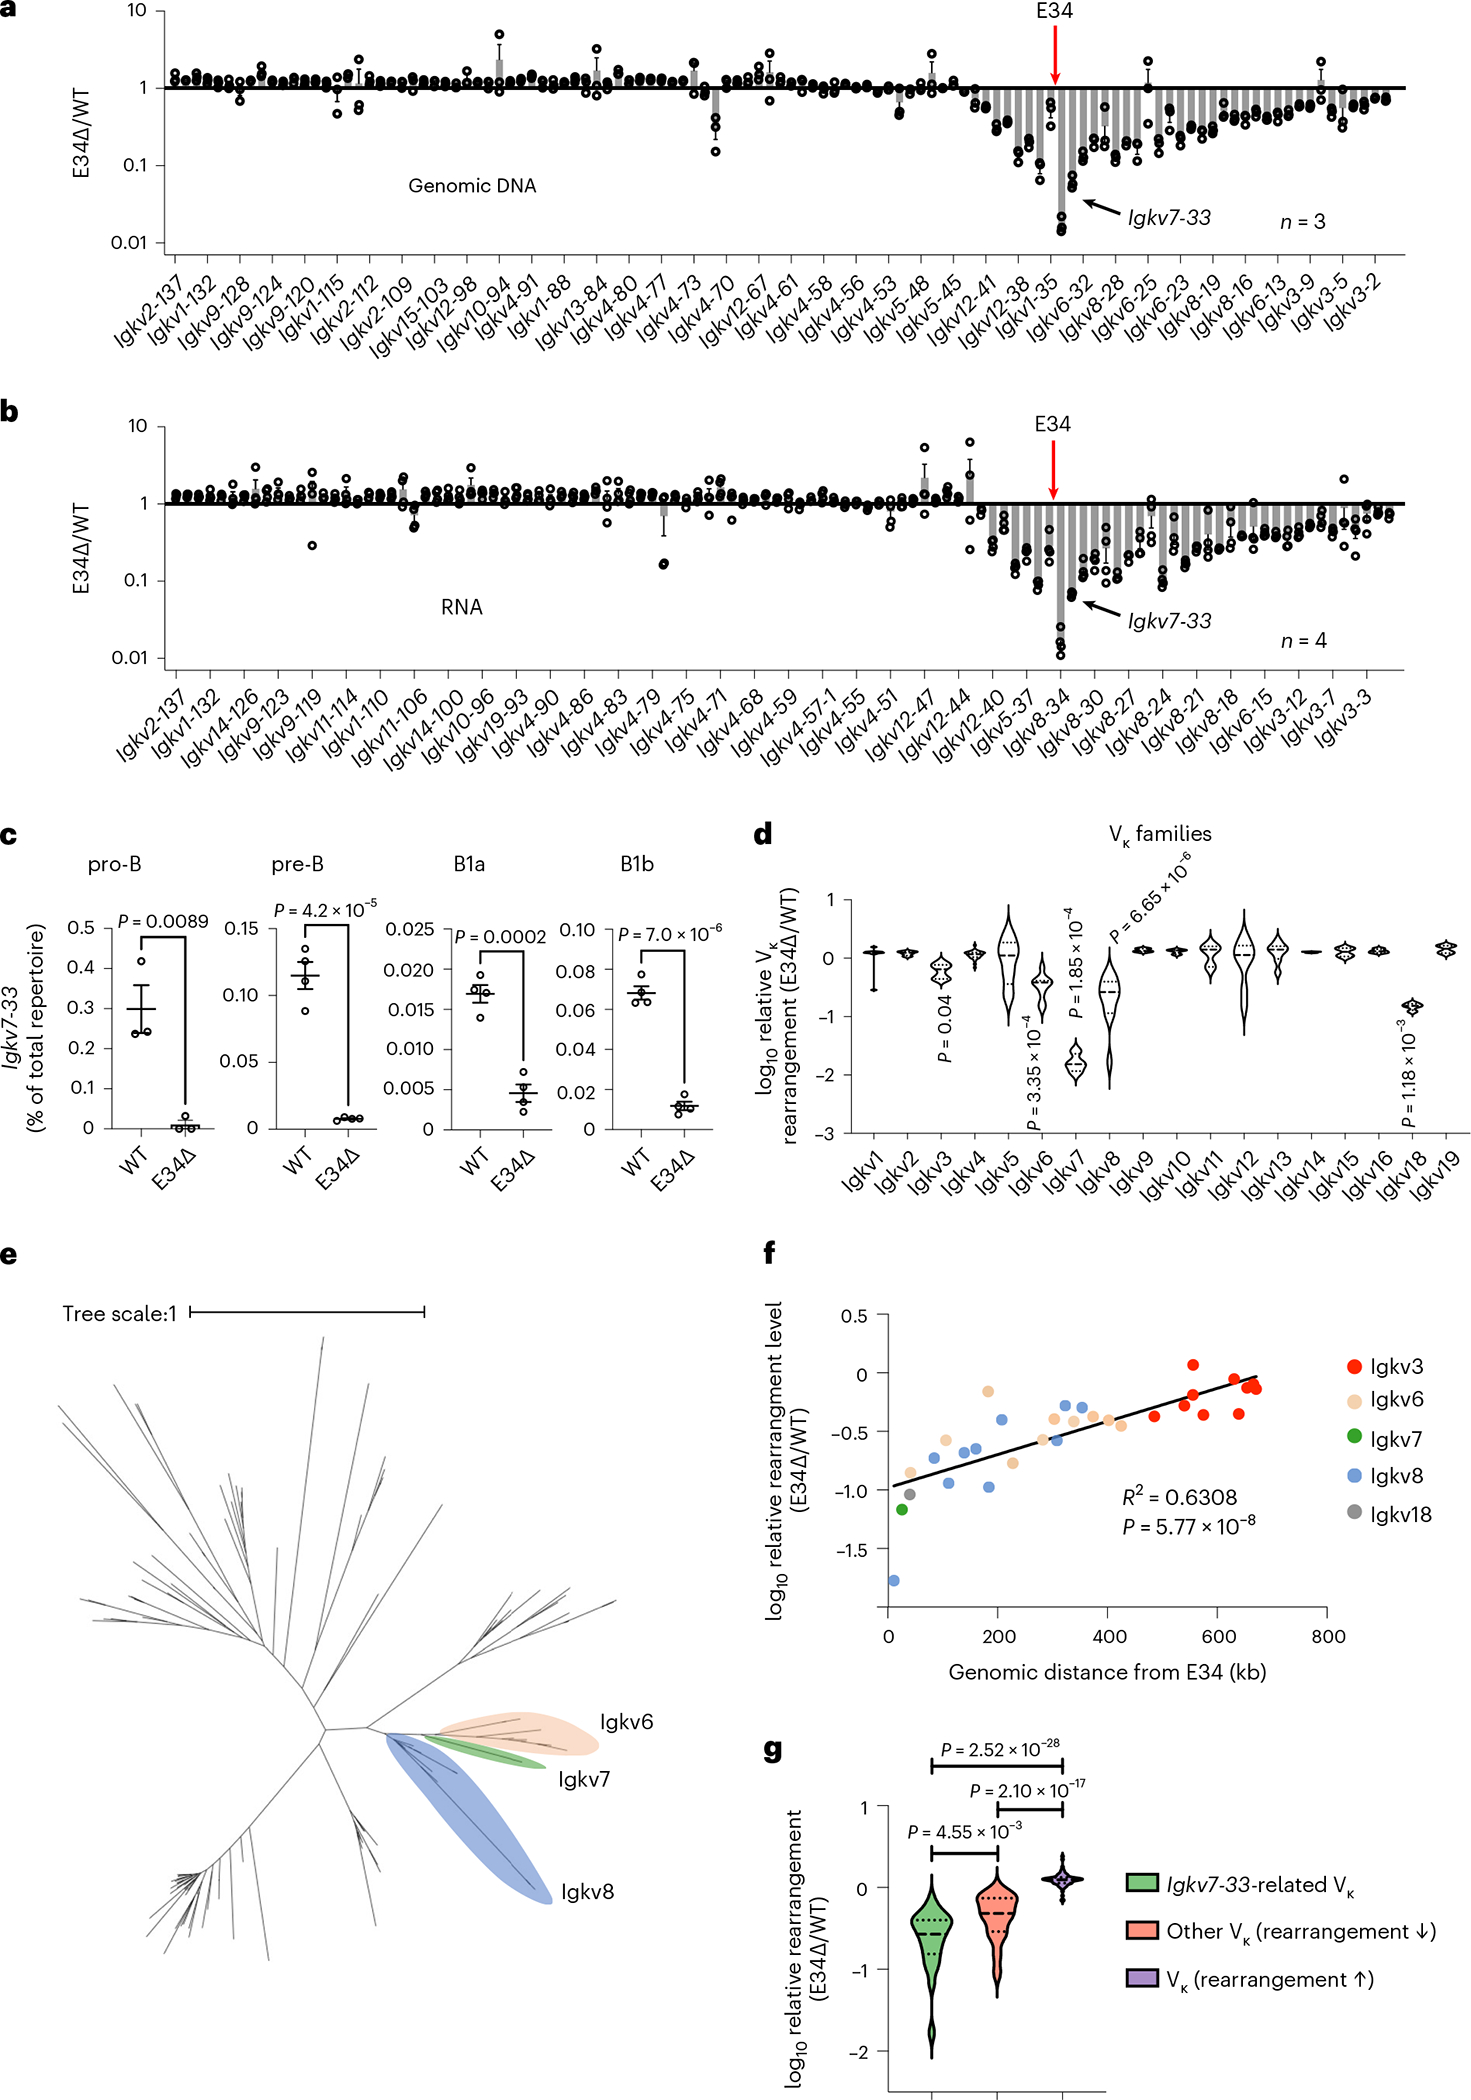
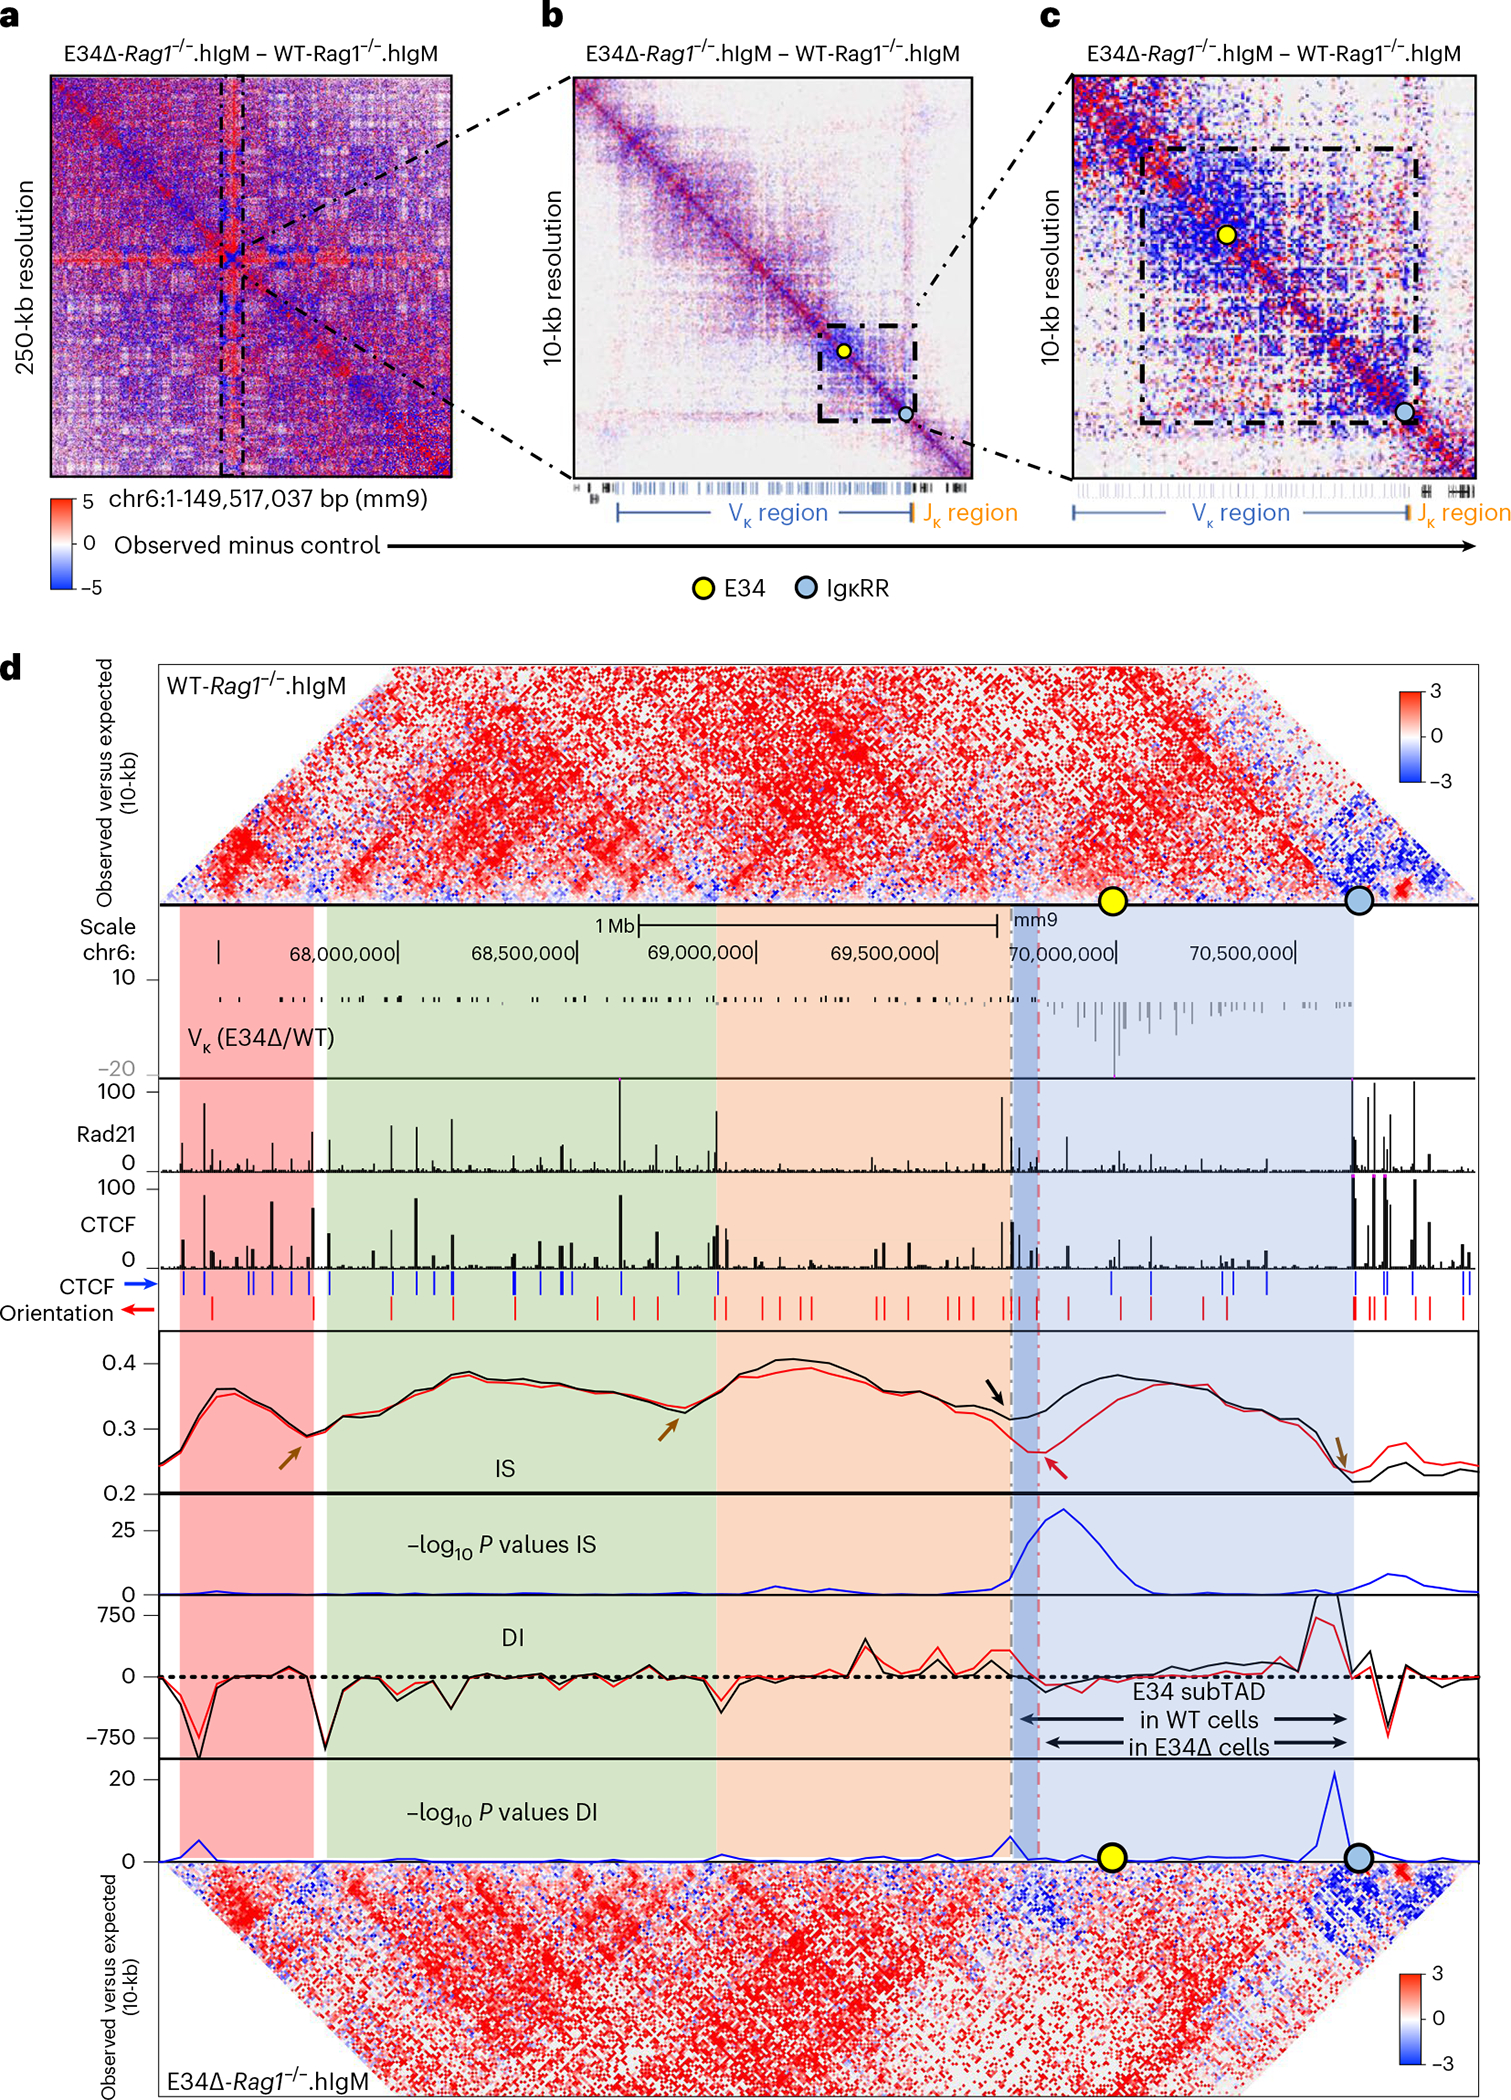
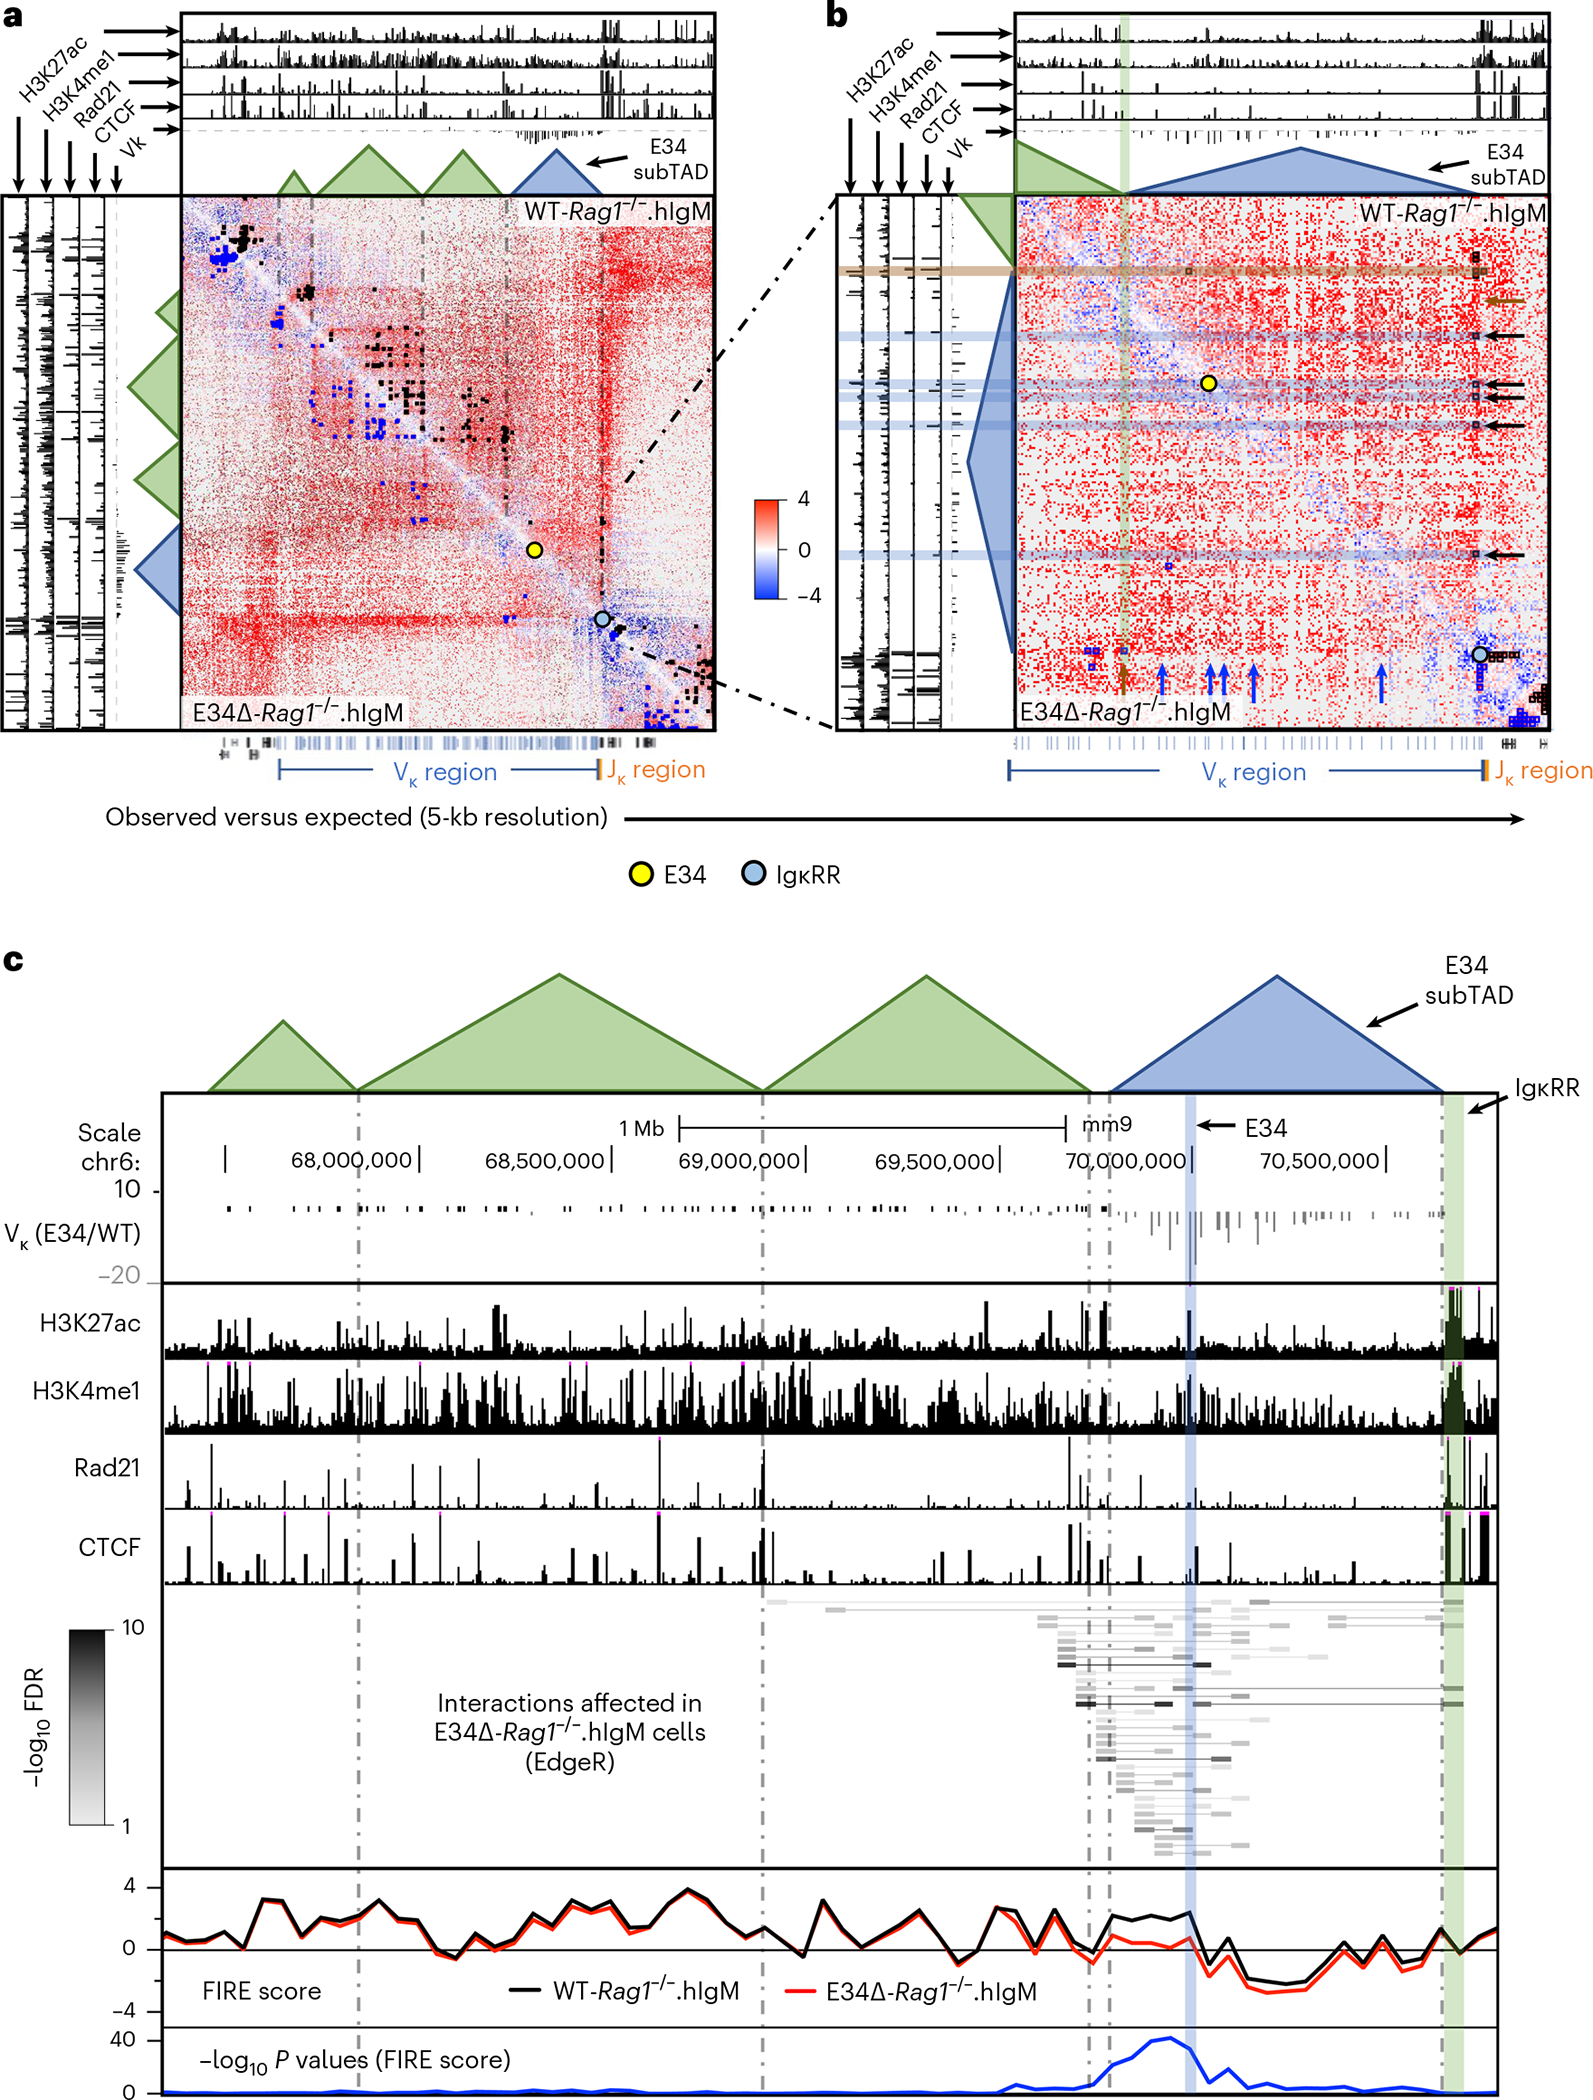
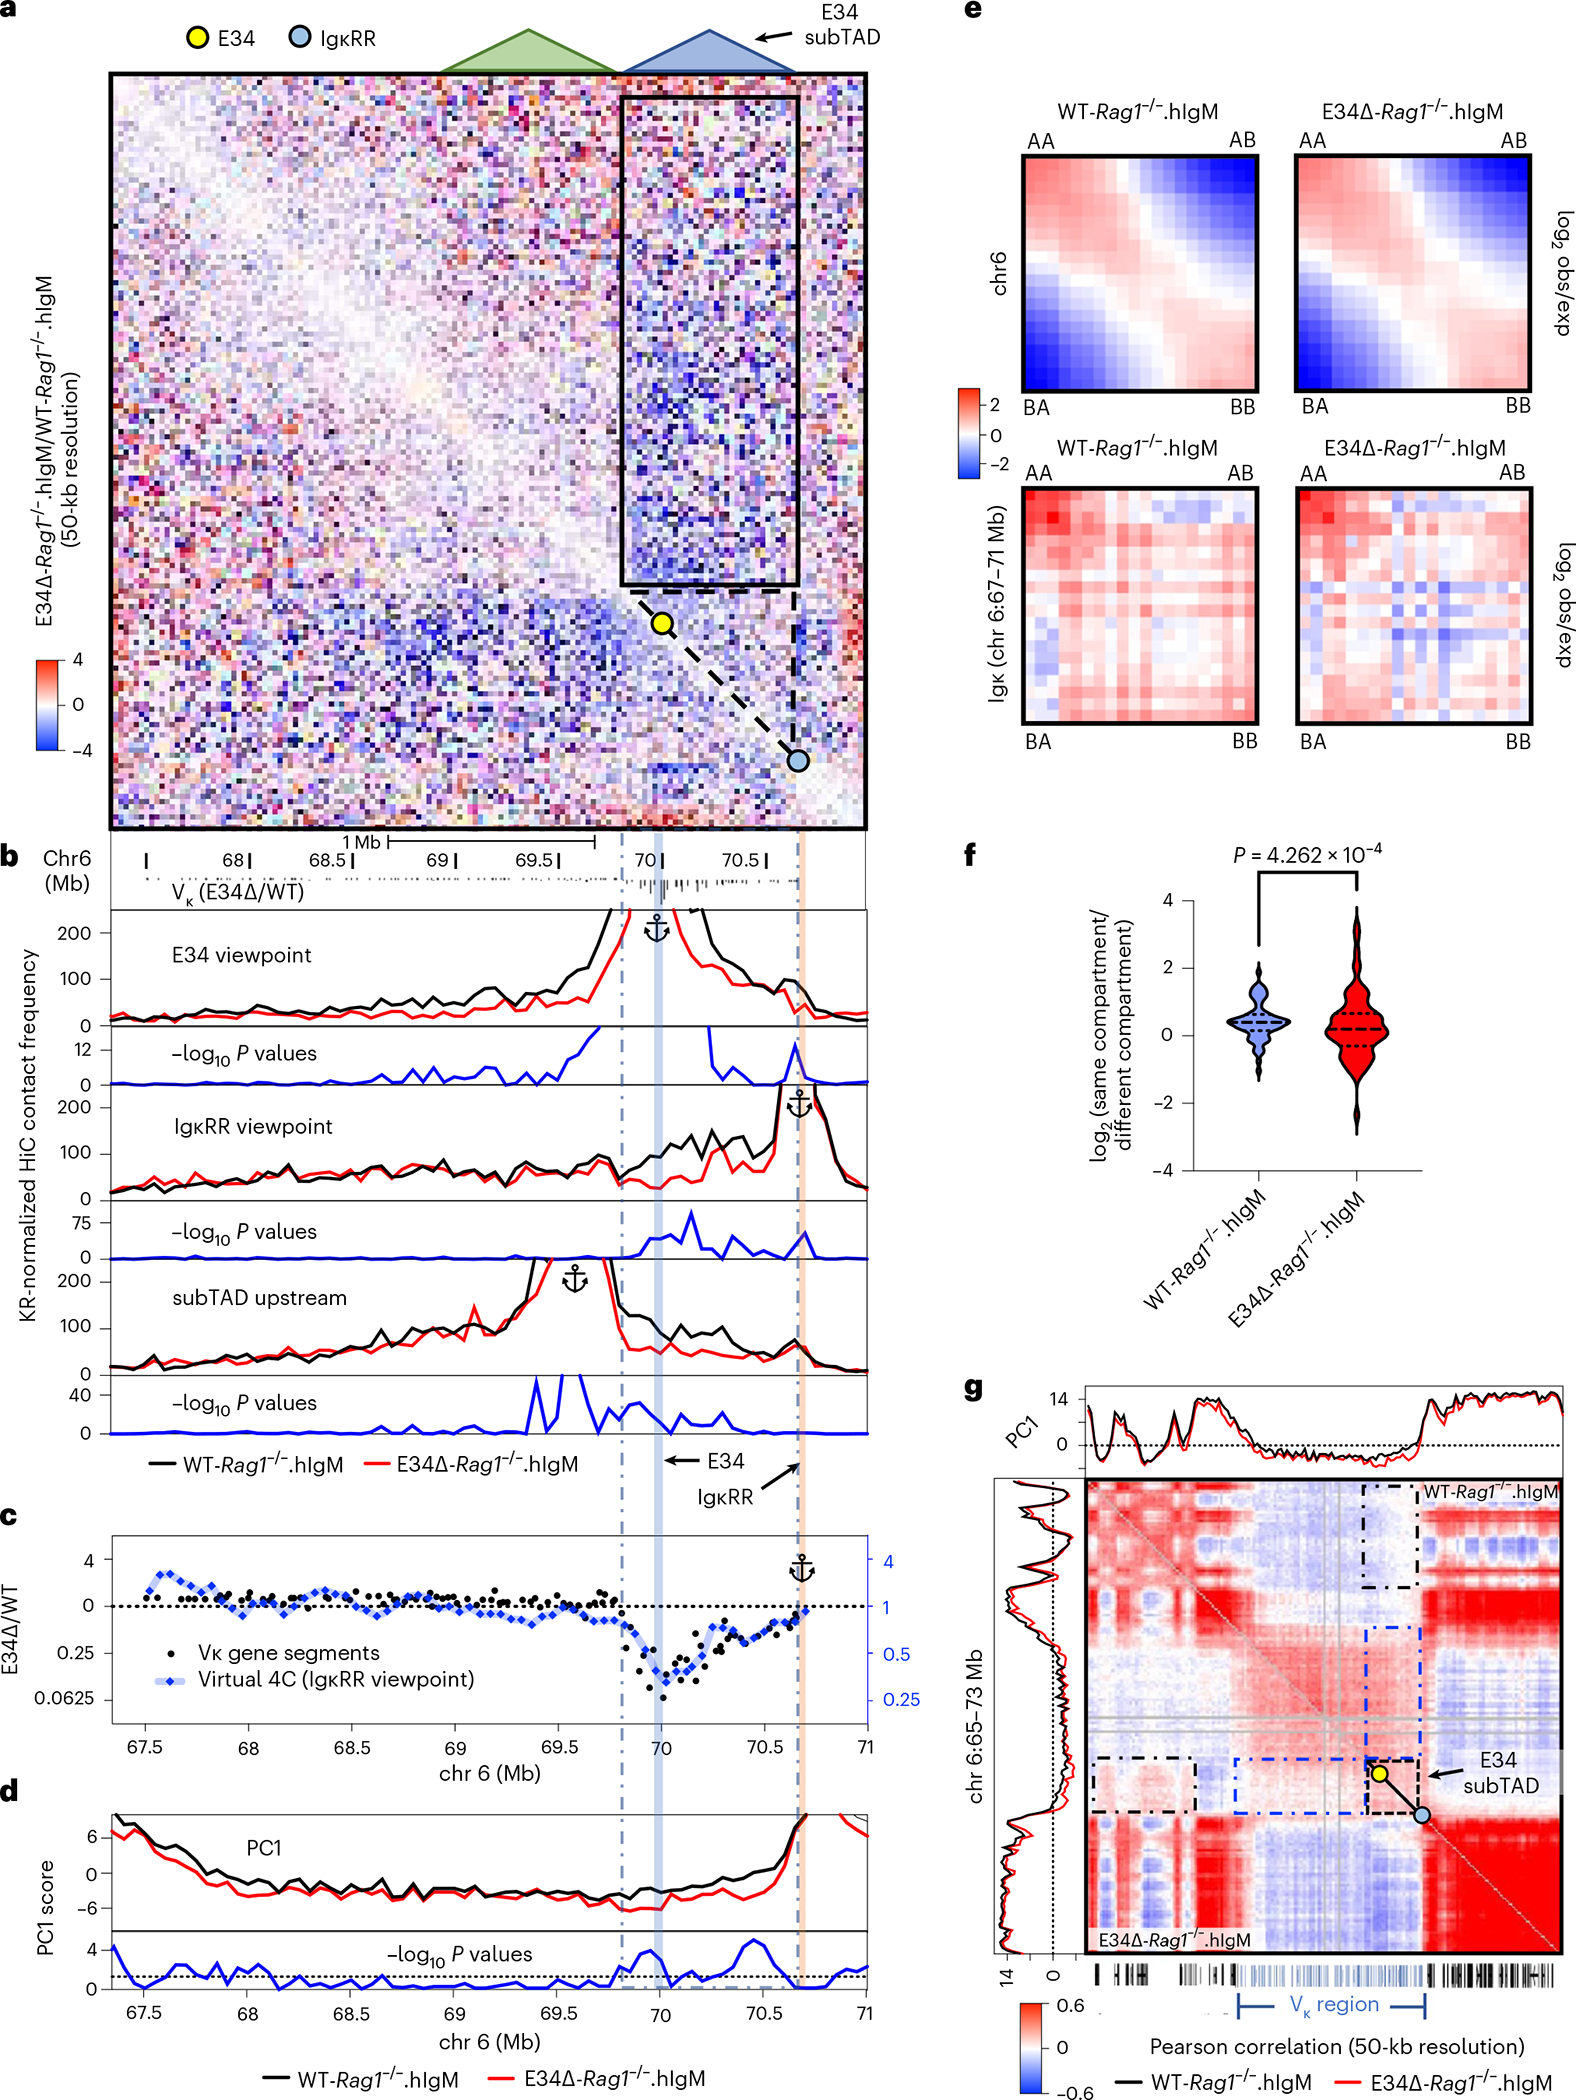
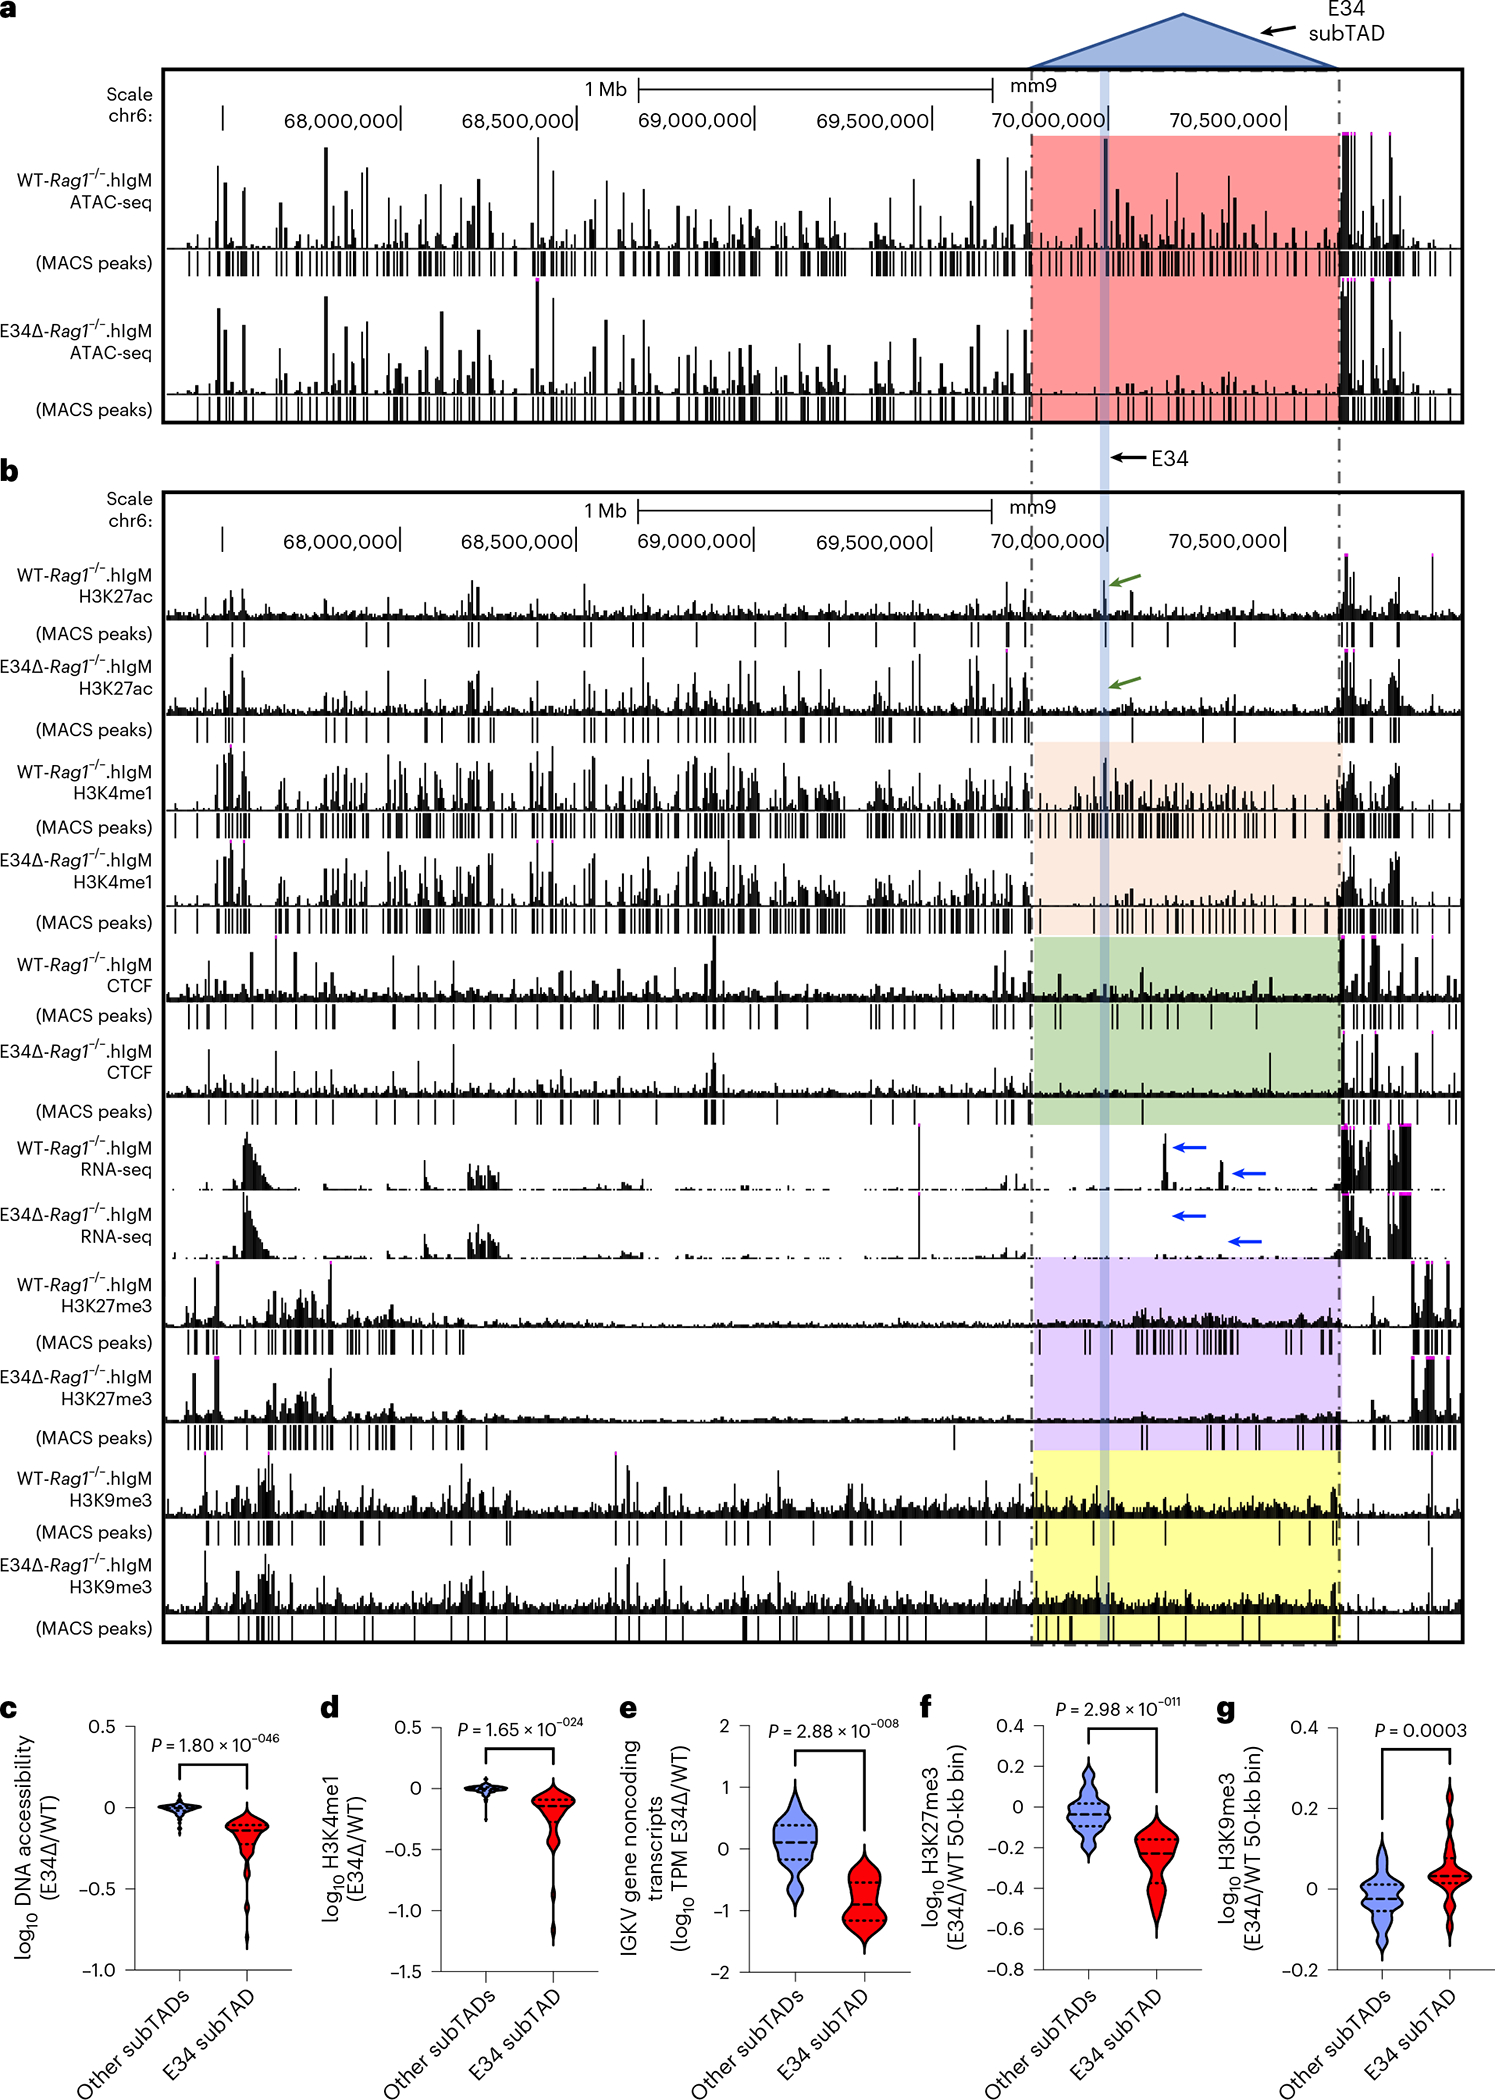
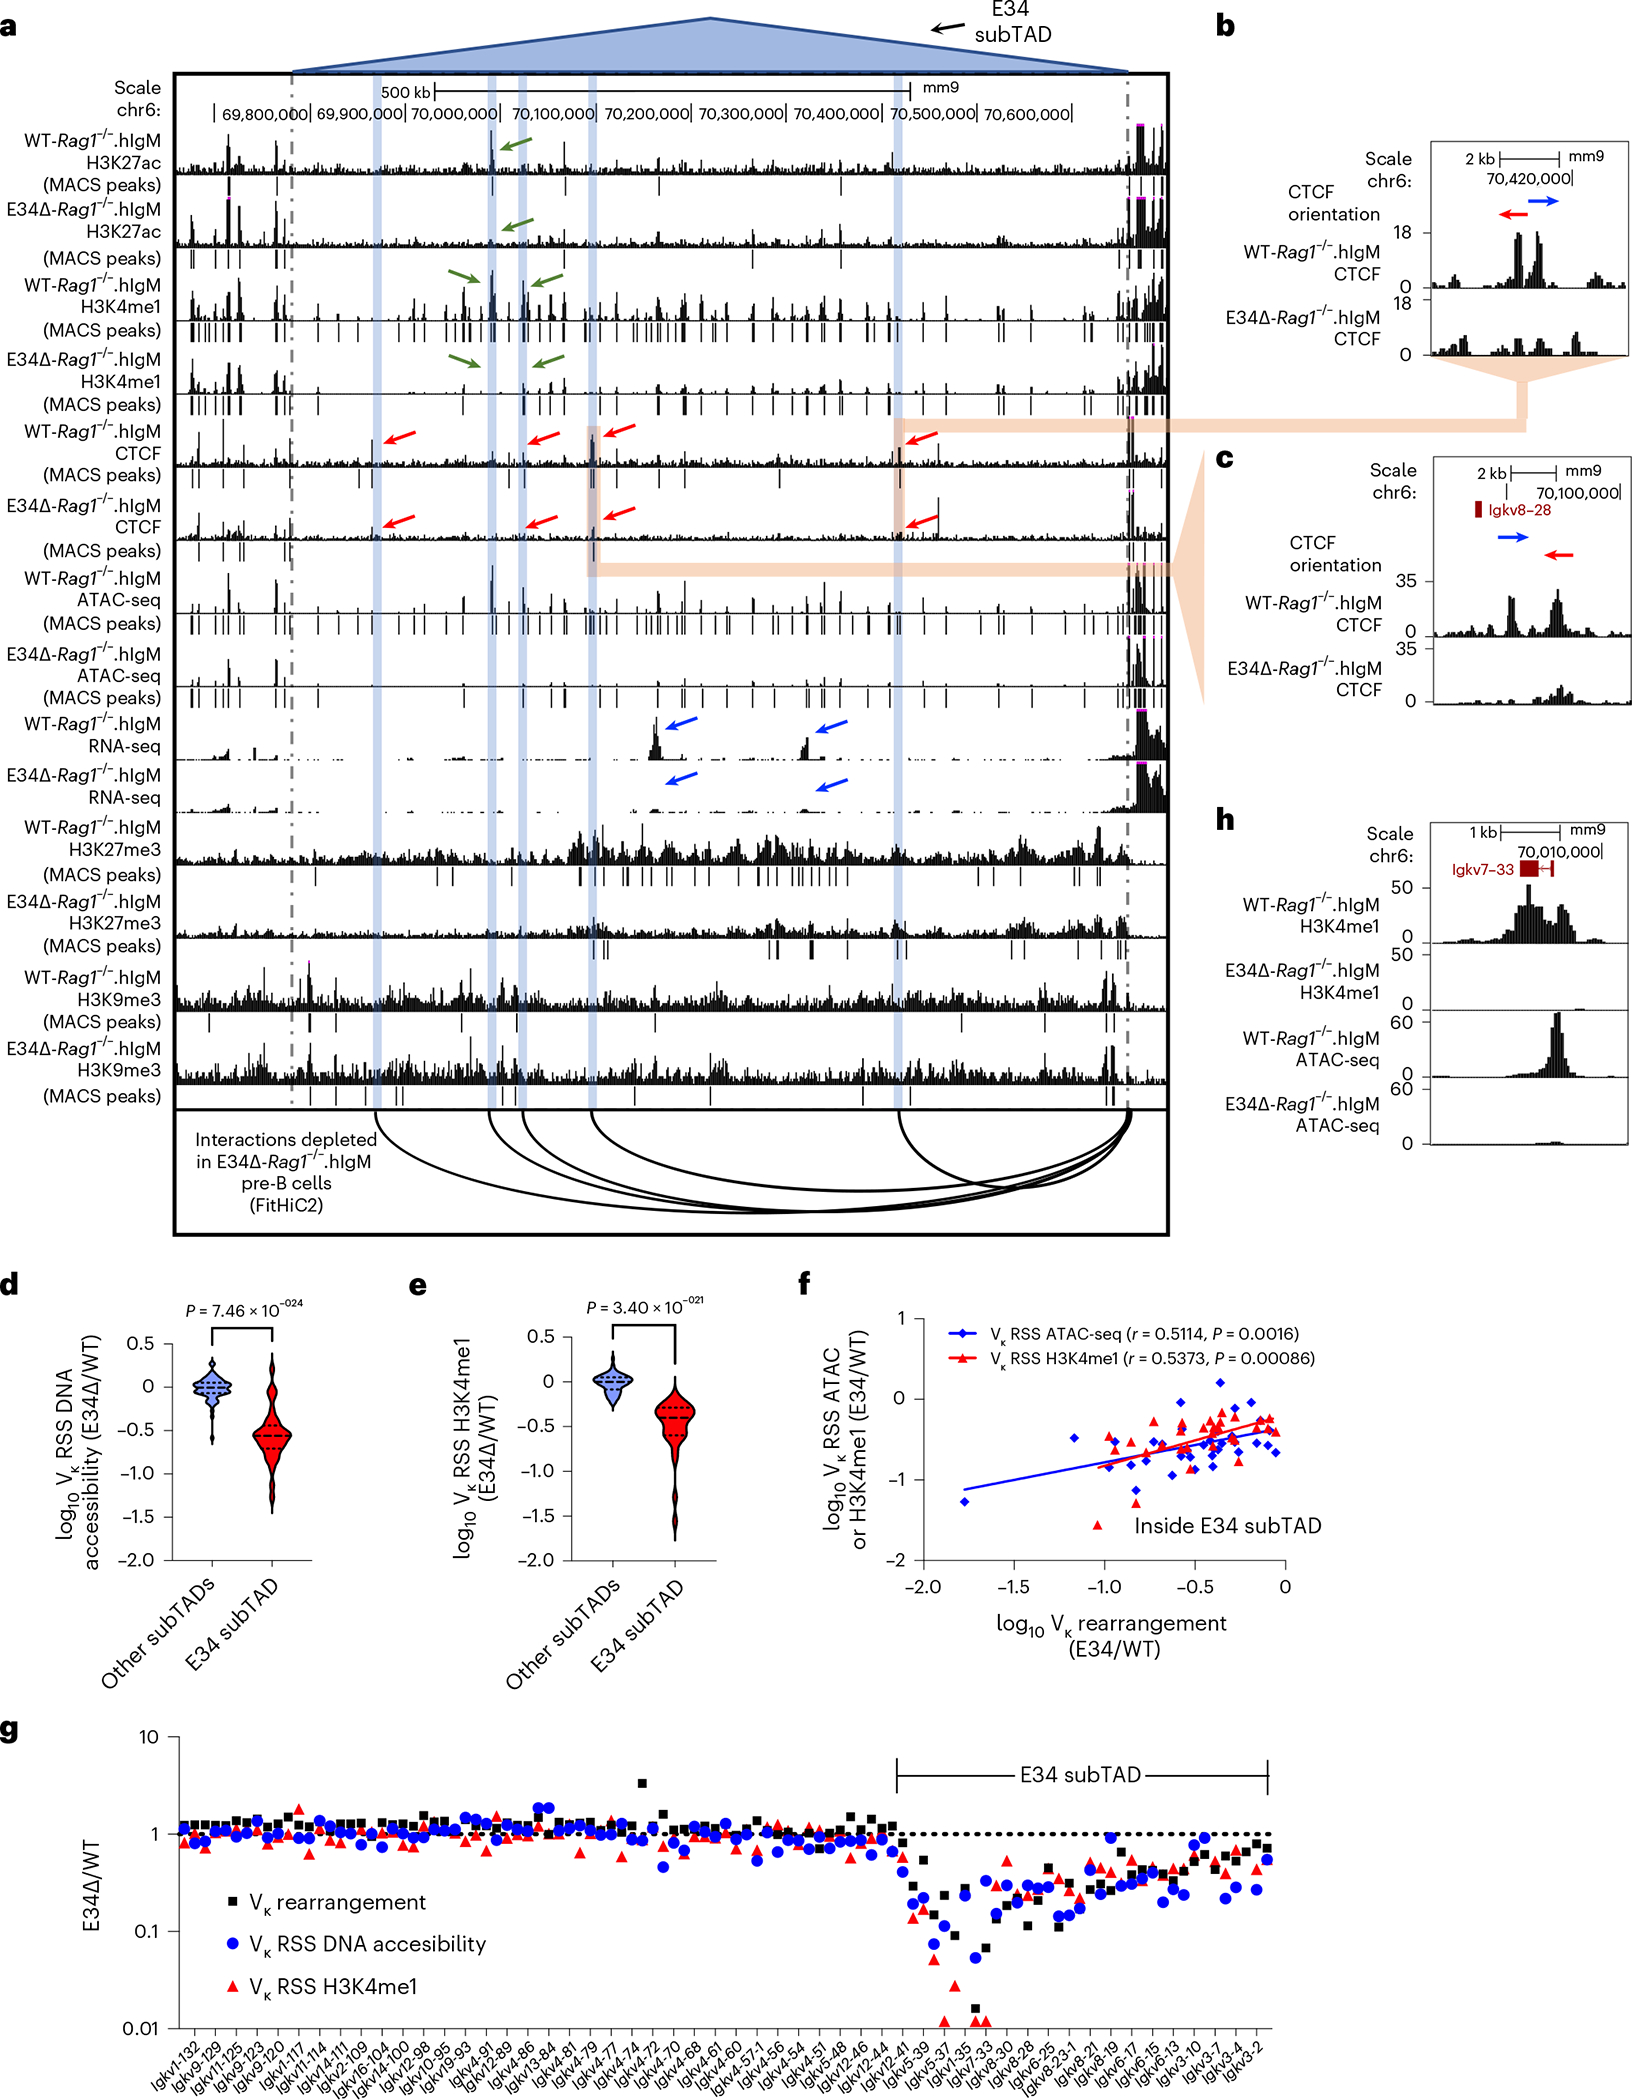
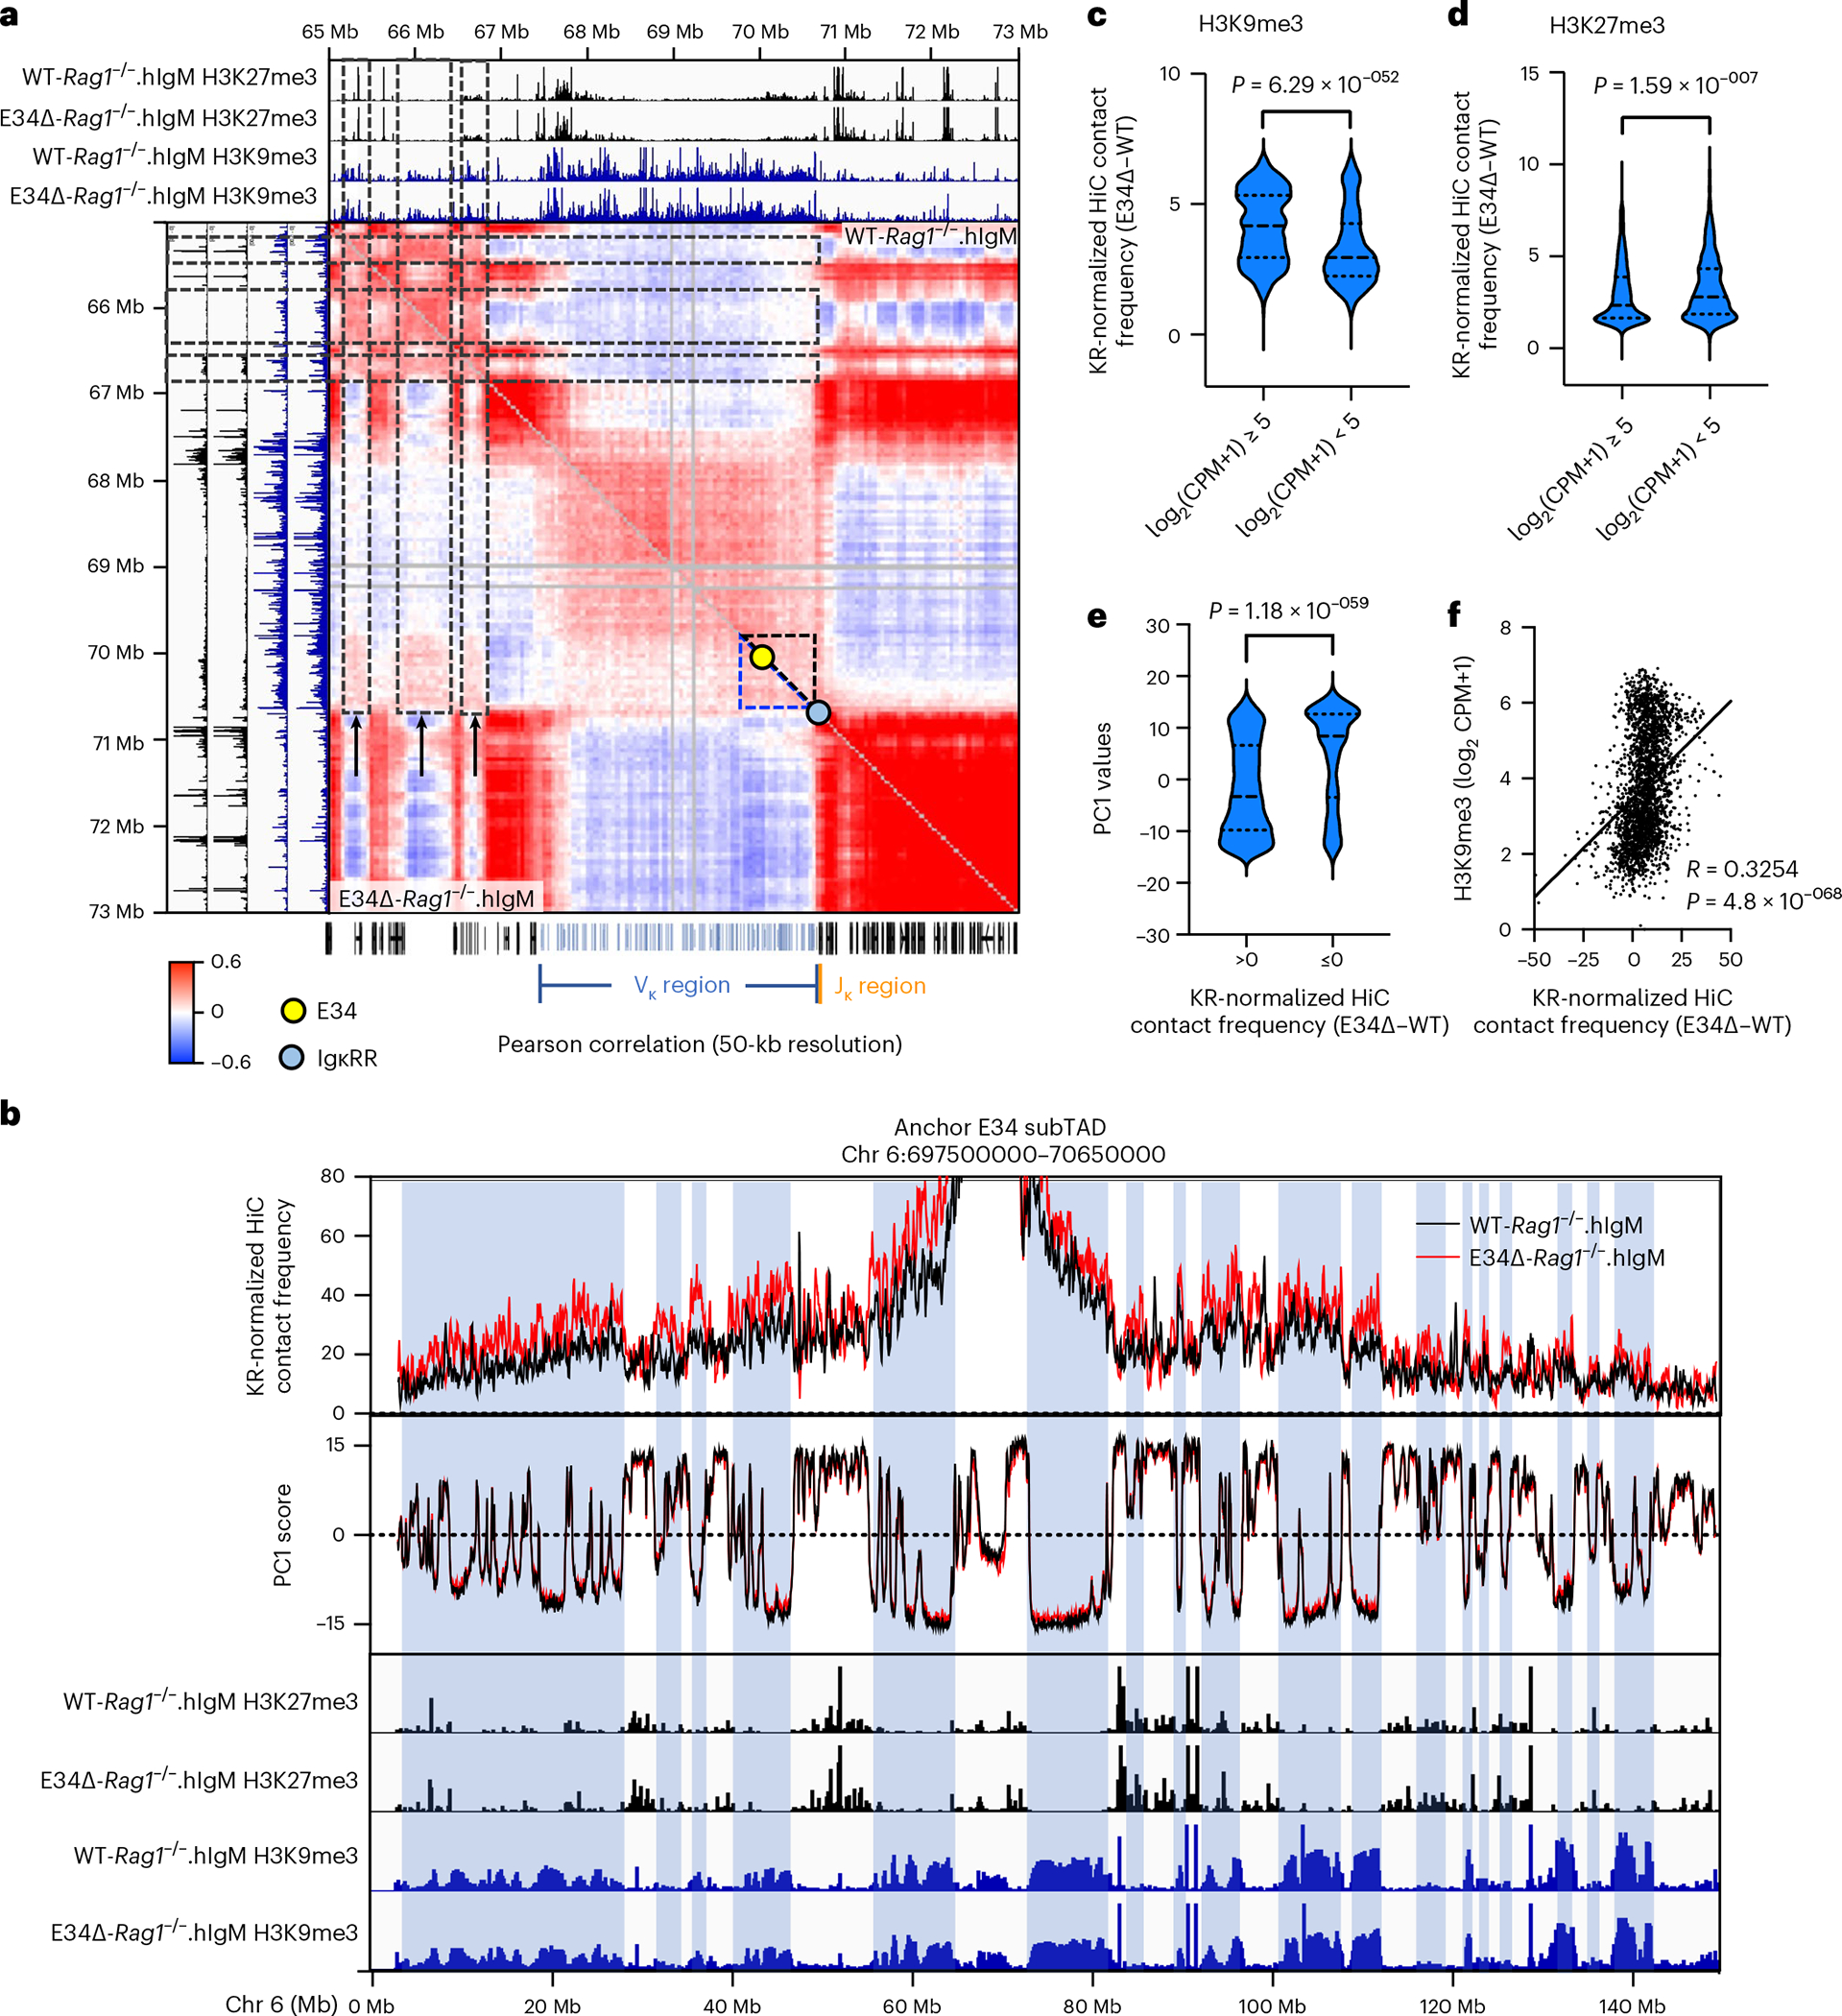
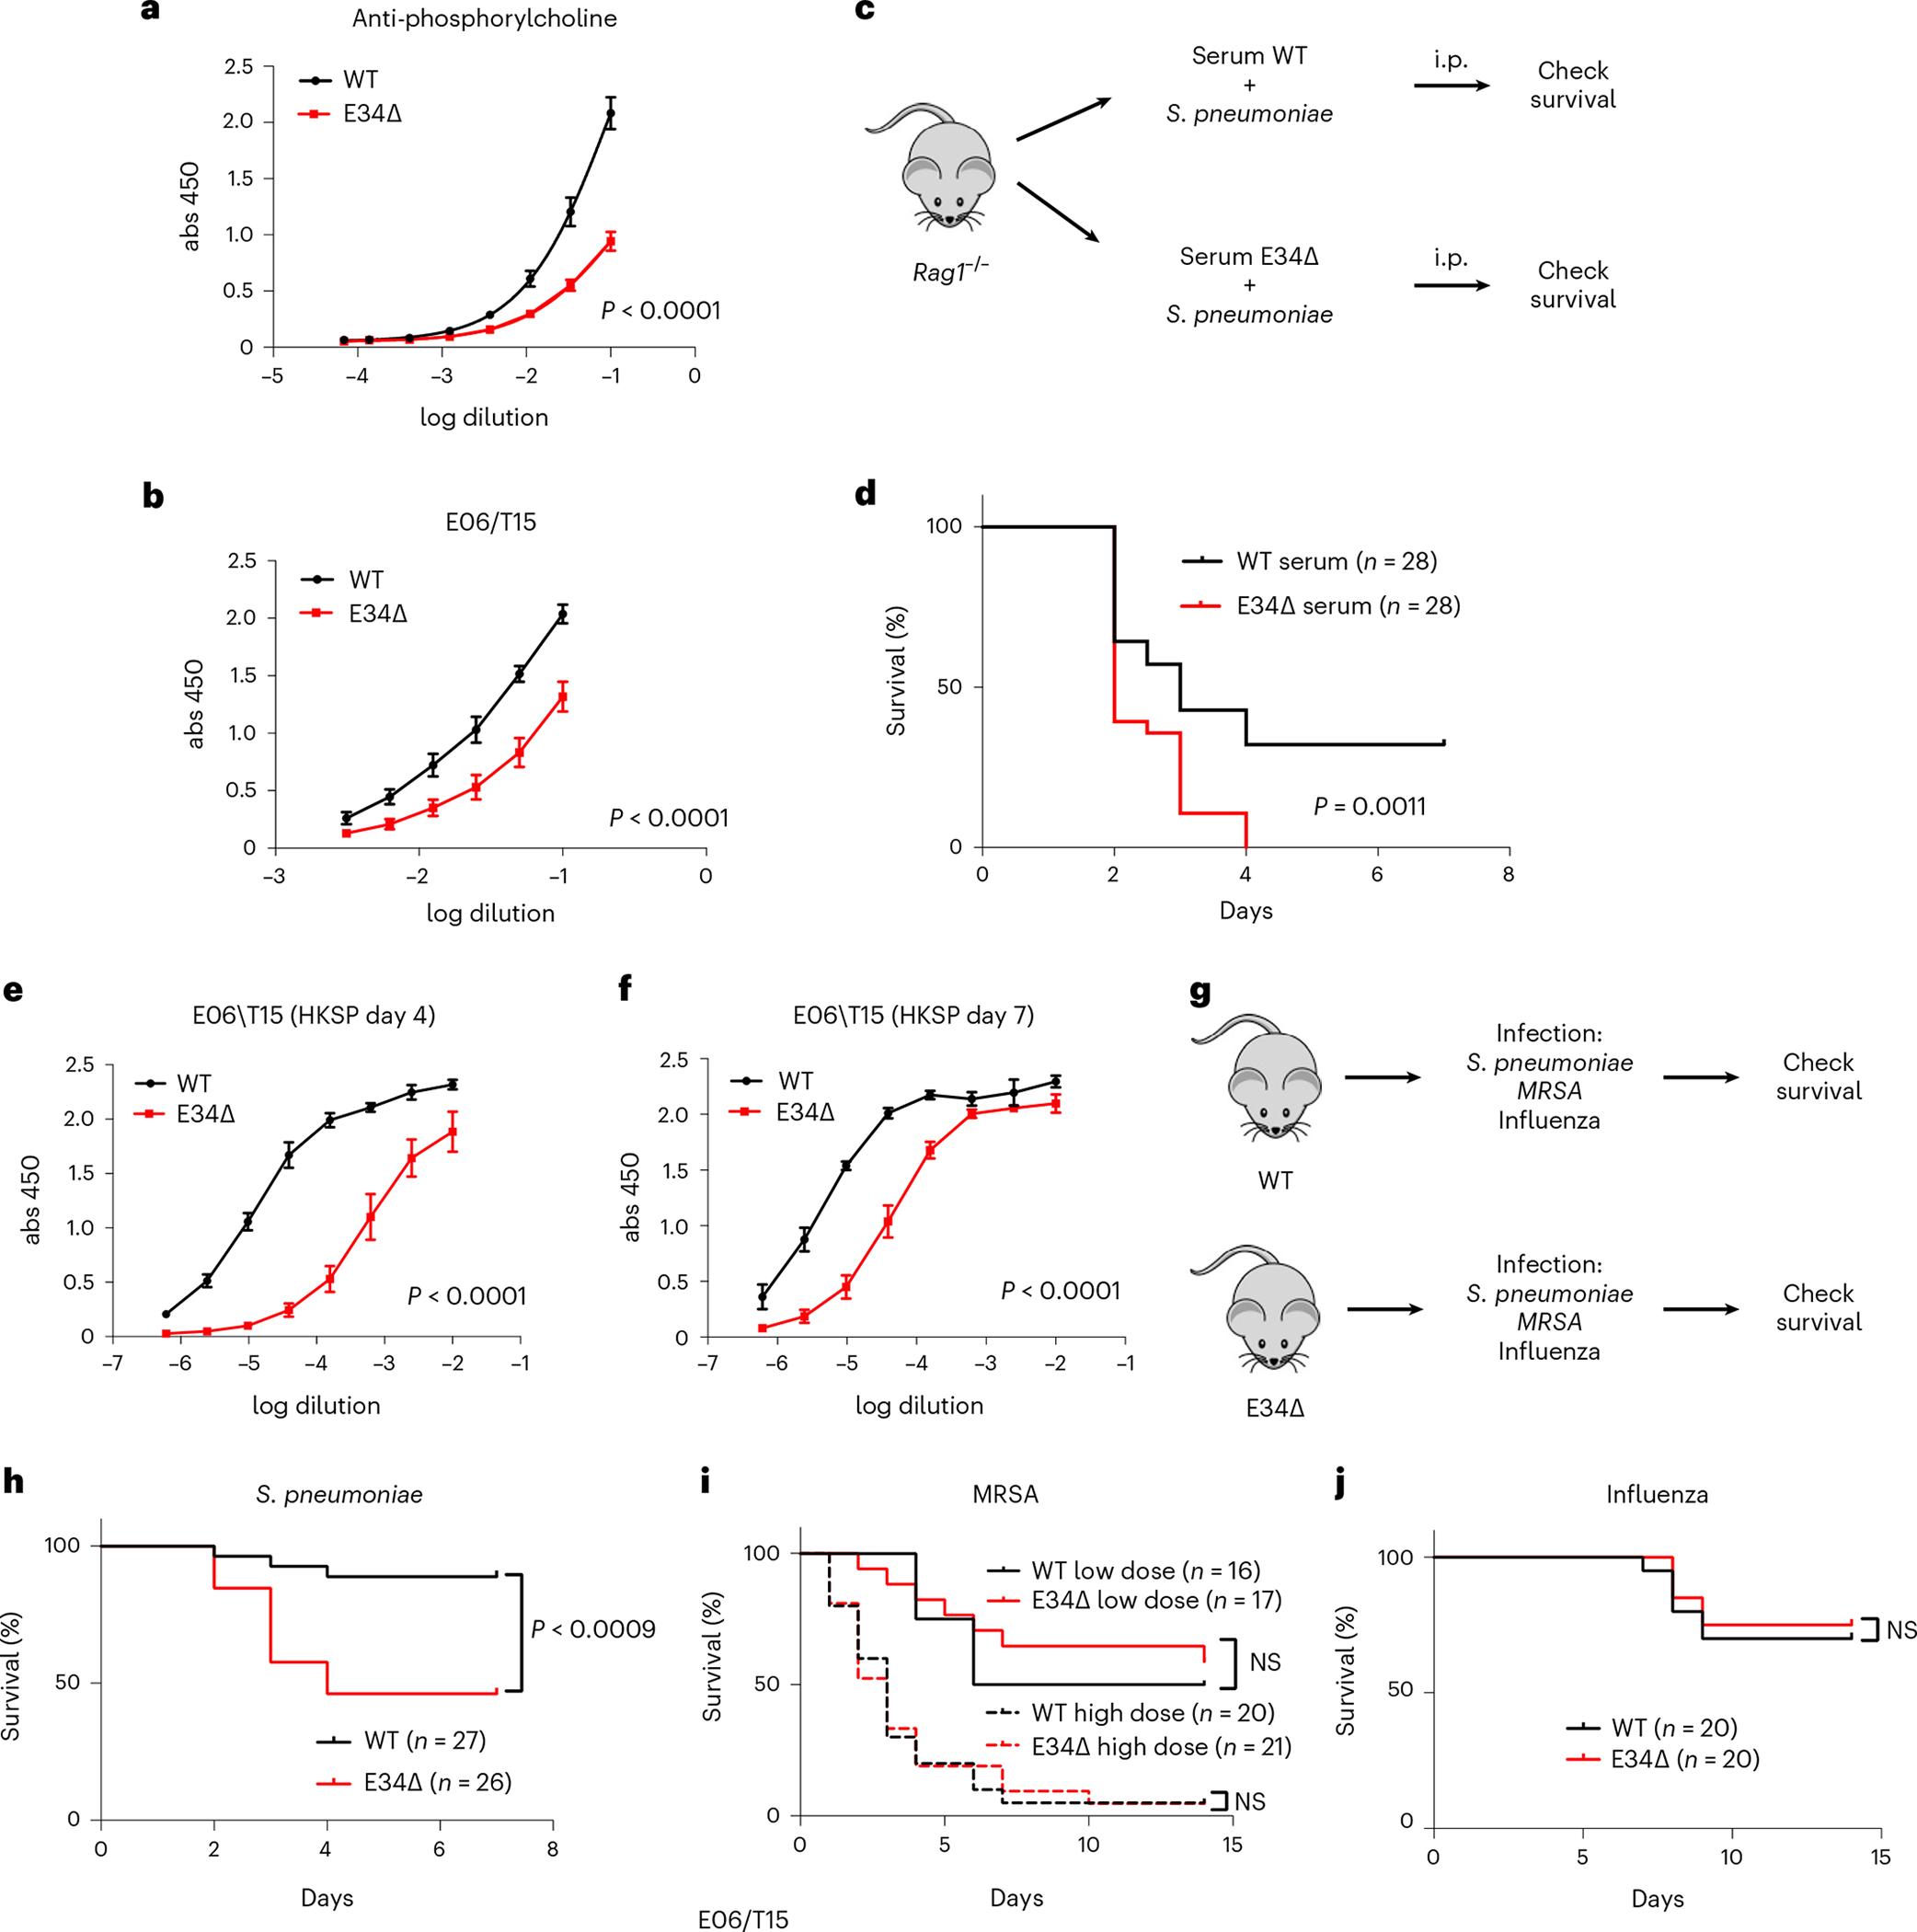
Antigen receptor loci are organized into variable (V), diversity (D) and joining (J) gene segments that rearrange to generate antigen receptor repertoires. Here, we identified an enhancer (E34) in the murine immunoglobulin kappa (Igk) locus that instructed rearrangement of Vκ genes located in a sub-topologically associating domain, including a Vκ gene encoding for antibodies targeting bacterial phosphorylcholine. We show that E34 instructs the nuclear repositioning of the E34 sub-topologically associating domain from a recombination-repressive compartment to a recombination-permissive compartment that is marked by equivalent activating histone modifications. Finally, we found that E34-instructed Vκ-Jκ rearrangement was essential to combat Streptococcus pneumoniae but not methicillin-resistant Staphylococcus aureus or influenza infections. We propose that the merging of Vκ genes with Jκ elements is instructed by one-dimensional epigenetic information imposed by enhancers across Vκ and Jκ genomic regions. The data also reveal how enhancers generate distinct antibody repertoires that provide protection against lethal bacterial infection.


Conflict of interest statement

Competing interests

The authors declare no competing interests.

Figures

Extended Data Fig. 1 |
Extended Data Fig. 1 |. Identification of an enhancer located nearby a Vκ gene encoding for the prototypical EO6/T15 antibody idiotype.
a, Genome browser view of the Igκ locus indicating the location of the Vκ gene segments and deposition of H3K27Ac (GSM3103098) and H3K4me1 (GSM2084579) in WT-Rag1−/−.hIgM pre-B cells. Blue and green highlights indicate a potential enhancer in the vicinity of the Igkv7–33 gene and the IgκRR, respectively. b, Genomic region spanning the Igkv7–33 gene is shown. CTCF (GSM2973687) occupancy and deposition of H3K27Ac and H3K4me1 (upper panel) are shown. Lower tracks show enrichment for the deposition of H3K27Ac and H3K4me1. E2A (GSM546523), EBF (GSM1296532), IRF4 (GSM1296534), PU.1 (GSM1296533), and Pax5 (GSM932924) occupancy across the Igkv7–33 genomic region is indicated. Bottom indicates genomic position of gRNAs used to excise the E34 enhancer. c, p300 (GSM987808), Brg1 (GSM1635413), and Mediator (GSM1038263) occupancy across a genomic region spanning the E34 enhancer. d, Genotyping of DNA derived from wild-type (WT) cells and cells carrying the E34-targeted deletion is shown. Indicated are representatives from two independent experiments.
Extended Data Fig. 2 |
Extended Data Fig. 2 |. Flow cytometric analysis of B cell populations in WT and E34Δ mice.
Gating strategy to identify B cell populations in bone marrow (a), peritoneal cavity (b), and spleen (c) is shown. Forward scatter (FSC) and side scatter (SSC) areas are shown. Quantification of the flow cytometry data for B cell populations derived from bone marrow (d), peritoneal cavity (e), and spleen (f) are indicated. Data was derived from 4 mice for each genotype and expressed as a percentage of the parental population. Data are presented as mean values +/− SEM. Significant differences between populations were assessed using two-tailed t-test. Small (Sm), Large (Lg), follicular (Fo), marginal zone (MZ), recirculating (rec), and transitional (Tr) B cells are indicated. n.s.=not significant.
Extended Data Fig. 3 |
Extended Data Fig. 3 |. Relative Vκ rearrangement frequencies in B1 cell subpopulations derived from WT and E34Δ mice.
Relative Vκ rearrangement frequencies in (a) B1a B cells, and (b) B1b B cells derived from WT and E34Δ mice are shown. Data was derived from four independent experiments (one mouse per group per genotype) and is expressed as the average of the ratio of E34Δ mice over littermate controls (WT) ± SEM.
Extended Data Fig. 4 |
Extended Data Fig. 4 |. HiC, virtual 4 C, Vκ rearrangement and contact frequency correlation analyses.
Pearson correlation assessing the reproducibility of the HiC data for WT-Rag1−/−.hIgM and E34Δ-Rag1−/−.hIgM pre-B cells are indicated. Stratum adjusted correlation coefficients (SCC) are shown. b, Average contact probability as a function of genomic distance for compiled WT-Rag1−/−.hIgM and E34Δ-Rag1−/−.hIgM pre-B cells samples. c,d, HiC contact matrices for WT-Rag1−/−.hIgM (c) and E34Δ-Rag1−/−.hIgM (d) pre-B cells across chromosome 6 are shown. The location of the Igk locus is indicated. e, HiC contact matrices for WT-Rag1−/−.hIgM and E34Δ-Rag1−/−.hIgM pre-B cell across the Igk locus. f, HiC contact matrices for WT-Rag1−/−.hIgM and E34Δ-Rag1−/−. hIgM pre-B cells for a genomic region that spans the E34 enhancer. Yellow and blue dots indicate the E34 enhancer and the IgκRR, respectively. The location of the Vκ (blue), Jκ (orange), and other genes (black) is shown at the bottom. Location of the affected genomic region is indicated by black and blue triangles in WT-Rag1−/−.hIgM and E34Δ-Rag1−/−.hIgM pre-B cells. g, Significant differences between Vκ gene rearrangement frequencies were computed within and outside of the E34 subTAD assessed using two tailed t-tests.
Extended Data Fig. 5 |
Extended Data Fig. 5 |. Chromatin interactions involving the CER and the iEκ/Jκ elements in WT-Rag1−/−.hIgM and E34Δ-Rag1−/−.hIgM pre-B cells.
a, HiC matrix heatmaps showing chromatin interaction frequencies involving a genomic region that spans the E34 subTAD in WT-Rag1−/−.hIgM and E34Δ-Rag1−/−. hIgM pre-B cells. Close-up views of HiC matrices heatmap that span a genomic region harboring the CER and the iEκ/Jκ elements are indicated. Blue and black rectangles indicate a 10 kbp genomic region that show interactions involving the CER and iEκ/Jκ elements, respectively. Black and blue squares represent significant chromatin interactions detected by FitHiC2 in WT-Rag1−/−.hIgM and E34Δ-Rag1−/−.hIgM pre-B cells, respectively. Bottom tracks indicate Rad21 and CTCF occupancy as well as the deposition of H3K27Ac and H3K4me1 in a genomic region that spans the CER element and iEκ/Jκ region. b, Virtual 4 C plots spanning a 10 kbp genomic region contain the CER and the iEκ/Jκ element in the vicinity of the E34 enhancer in WT-Rag1−/−.hIgM and E34Δ-Rag1−/−.hIgM pre-B cells. Significant differences were calculated using a two-sided Z-test. The negative log10 p-values indicating significant differences between WT-Rag1−/−.hIgM and E34Δ-Rag1−/−.hIgM cells are shown at the bottom tracks.
Extended Data Fig. 6 |
Extended Data Fig. 6 |. Igk locus non-coding transcription and epigenetic profiling at the 5′ boundary of the E34 subTAD in WT-Rag1−/−.hIgM and E34Δ-Rag1−/−.hIgM pre-B cells.
a, UCSC genome browser tracks spanning the Igk locus showing the deposition of CTCF, H3K27ac, H3K4me1, H3K27me3, and H3K9me3, as well as ATAC-seq reads in WT-Rag1−/−.hIgM and E34Δ-Rag1−/−.hIgM pre-B cells. Vκ rearrangement is also shown (E34Δ/WT). Significant peaks were called using MACS2 (Cutoff FDR < 0.05). The p-values cutoff for H3K9me3 reads was 0.001. Blue highlight indicates a genomic region downstream of the CTCF binding site affected by the E34 deletion. b, Genome browser view of the Igk locus centered on the E34 enhancer shows RNA-seq reads in WT-Rag1−/−.hIgM and E34Δ-Rag1−/−. hIgM pre-B cells. Blue arrows indicate affected transcripts. Tracks showing the deposition of H3K27Ac (GSM3103098) and H3K4me1 (GSM2084579) are shown. c, Non-coding transcripts expressed within the E34 subTAD with statistically significant changes are indicated. Data is expressed as Transcripts Per Million (TPM). DEseq analysis was used to calculate statistically significant changes for biological replicates. p-values are indicated. DEseq uses a negative binomial generalized linear model to determine significance of differences between transcript abundance. Data is derived from two independent experiment (two mice per group per genotype). d, Non-coding transcripts expressed in genomic regions located across the Igk locus but away from the E34 subTAD are shown. Data is derived from two independent experiment (two mice per group per genotype). DEseq analysis was used to calculate statistically significant changes in terms of p-values for biological replicates. p-values are indicated. DEseq uses a negative binomial generalized linear model to determine significance of differences between transcript abundance. e, Correlation between enrichment of H3K27me3 and KR-normalized interaction frequencies (E34Δ-WT) involving the E34 subTAD when compared to other genomic regions spanning chromosome 6 are indicated. Correlation coefficient (r) and p-values were calculated using simple linear regression.
Fig. 1 |
Fig. 1 |. An enhancer that instructs Igkv7–33 gene rearrangement.
a, Relative Vκ gene rearrangement frequencies, using genomic DNA (gDNA) as starting material, in WT and E34Δ adult bone marrow pre-B cells are shown. b, Relative Vκ gene rearrangement frequencies, using RNA as starting material, in WT and E34Δ adult bone marrow pre-B cells are shown. RNA and gDNA were derived from WT and E34Δ adult bone marrow pre-B cells and analyzed for Vκ gene usage. Data were derived from three (gDNA) and four (RNA) independent experiments using one mouse for each genotype per experiment and are expressed as the ratio of gene usage in E34Δ versus WT pre-B cells ± s.e.m. c, Levels of Igkv7–33 rearrangements in pro-B, pre-B, B1a and B1b B cells derived from E34Δ or littermate (WT) mice. Data were derived from three (pro-B) and four (pre-B, B1a and B1b) independent experiments and are expressed as a percentage of the total number of reads ± s.e.m. Significant differences between groups were assessed using an unpaired t-test. d, Violin plots show relative rearrangement frequencies in E34Δ and littermate (WT) pre-B cells for indicated Vκ gene families. Dashes and dotted lines represent means and quartiles, respectively. Significant differences between each group with reduced rearrangement and the combined data from all groups were assessed using an unpaired t-test. e, Phylogenetic analysis of functional Vκ genes. Indicated are families most affected by the E34 deletion with the exception of the Igkv18 family. The distance scale represents the percentage of genetic variation between the sequences. f, Correlation between the genomic distance and relative levels of rearrangement among the Vκ gene families that showed significantly reduced rearrangement frequencies. Correlation coefficient (r) and P values were calculated using simple linear regression. g, Violin plots showing the relative frequencies of rearrangements between genetically Igkv7–33-related Vκ genes (green), non-Igkv7–33-related Vκ genes associated with reduced rearrangement frequencies (orange) and Vκ genes linked with increased rearrangement frequencies (purple). Significant differences between groups were assessed using an unpaired t-test. Dashes and dotted lines represent means and quartiles, respectively. Rearrangement frequencies for a, b and f are shown as averages of the ratio of E34Δ versus littermate controls (WT).
Fig. 2 |
Fig. 2 |. The E34 enhancer instructs changes in chromatin folding and boundary elements.
ac, HiC matrix differential contact heatmaps showing chromatin interaction frequencies in WT-Rag1−/−.hIgM and E34Δ-Rag1−/−. hIgM pre-B cells for: chromosome 6 (a), the Igk locus (b) and a genomic region spanning the E34 enhancer (c). Indicated are the locations of the E34 enhancer (yellow dot) and the IgκRR (blue dot). Data are derived from two independent experiments using four mice each in experiment 1 and two mice each for experiment 2. d, HiC contact matrices for WT-Rag1−/−.hIgM (top) and E34Δ-Rag1−/−.hIgM (bottom) pre-B cells. Heatmaps indicate normalized interaction frequencies. Indicated are the locations of the E34 enhancer (yellow dot) and the IgκRR (blue dot). Black lines indicate IS and DI scores associated with the genomes derived from WT-Rag1−/−.hIgM pre-B cells. Red lines indicate IS and DI scores associated with the genomes derived from E34Δ-Rag1−/−.hIgM pre-B cells. Shown are tracks indicating Vκ rearrangement (E34Δ/WT), Rad21 occupancy (GSM2973688), CTCF occupancy (GSM2973687) and CTCF binding orientation (blue and red arrows). Shown are IS and the DI. Brown arrows indicate unaltered DI scores or potential boundaries segregating subTADs for WT-Rag1−/−.hIgM versus E34Δ-Rag1−/−.hIgM pre-B cells. Black and red arrows indicate a boundary element segregating two subTADs in WT-Rag1−/−.hIgM and E34Δ-Rag1−/−.hIgM pre-B cells, respectively. SubTADs were identified using DI and IS as well as CTCF-marked boundary elements. SubTADs are highlighted by color. The genomic region spanning the E34 subTAD in WT-Rag1−/−.hIgM pre-B cells is highlighted in light and dark blue. Light-blue highlight indicates the E34 subTAD in E34Δ-Rag1−/−.hIgM pre-B cells. Tracks show −log10 P values for IS and DI scores for WT-Rag1−/−.hIgM versus E34Δ-Rag1−/−.hIgM pre-B cells (blue lines). A two-sided Z-test was used to calculate P values.
Fig. 3 |
Fig. 3 |. The E34 enhancer instructs the chromatin interaction landscape across the Igk locus.
a, HiC matrix contact heatmaps for a genomic region around the Igk locus in WT-Rag1−/−.hIgM and E34Δ-Rag1−/−.hIgM pre-B cells are shown. b, HiC matrix contact heatmaps for a genomic region located in the vicinity of the E34 enhancer in WT-Rag1−/−.hIgM and E34Δ-Rag1−/−.hIgM pre-B cells are shown. Tracks show the deposition of H3K27ac, H3K4me1, Rad21 and CTCF as well as relative Vκ rearrangement frequencies (E34Δ/WT). Indicated are chromatin interactions detected by FitHiC2 in WT-Rag1−/−.hIgM (black dots) and E34Δ-Rag1−/−.hIgM (blue dots) cells. Bottom shows the location of the Vκ (blue), Jκ (orange) and other gene segments (black). Yellow and blue dots indicate the genomic locations of the E34 enhancer and the IgκRR, respectively. c, Chromatin interactions affected by the E34 deletion across the Igk locus were analyzed using EdgeR (50-kb resolution). The E34 enhancer, the IgκRR and subTADs that span the Igk locus are indicated. Tracks show relative Vκ rearrangement frequencies (E34Δ/WT) and the deposition of H3K27ac, H3K4me1, Rad21 and CTCF. Gray scale represents negative log10 P values for each interaction as revealed using EdgeR. FIRE scores calculated for WT-Rag1−/−.hIgM and E34Δ-Rag1−/−.hIgM pre-B cells are indicated. Significant differences for FIRE scores between WT-Rag1−/−.hIgM and E34Δ-Rag1−/−.hIgM pre-B cells are shown as negative log10 P values and were calculated using a two-sided Z-test. FDR, false discovery rate.
Fig. 4 |
Fig. 4 |. The E34 enhancer instructs insulation and compartmentalization of the E34 subTAD.
a, HiC contact matrix heatmap for contact frequencies (E34Δ/WT) for WT-Rag1−/−.hIgM versus E34Δ-Rag1−/−.hIgM pre-B cells. Indicated are the Igk subTADs. b, Virtual 4C plots are shown for WT-Rag1−/−.hIgM and E34Δ-Rag1−/−.hIgM pre-B cells. Interactions emanating from the E34, IgκRR and a subTAD located adjacent to the E34 subTAD are shown. Indicated are the locations of the E34 (blue highlight) and IgκRR (beige highlight). Negative log10 P values indicating significant differences between WT-Rag1−/−.hIgM versus E34Δ-Rag1−/−.hIgM pre-B cells are shown (blue lines). c, Correlations between the relative chromatin contact frequencies involving the IgκRR (Jκ genes), Vκ gene segment location and Vκ rearrangement levels are indicated. Virtual 4C track emanating from the IgκRR viewpoint (50-kb resolution) using a moving average of three genomic regions from the ratio of WT-Rag1−/−.hIgM versus E34Δ-Rag1−/−.hIgM is shown (right y axis in blue). Vκ gene rearrangement is expressed as the ratio of WT versus E34Δ pre-B cells. d, PC1 scores of HiC data derived from WT-Rag1−/−.hIgM and E34Δ-Rag1−/−.hIgM pre-B cells are shown. Negative log10 P values indicating significant differences between WT-Rag1−/−. hIgM and E34Δ-Rag1−/−.hIgM pre-B cells are shown (blue lines). e, Saddle plots indicating compartmentalization strength in WT-Rag1−/−.hIgM and E34Δ-Rag1−/−.hIgM pre-B cells spanning chromosome 6 (top matrices) and the Igk locus (bottom matrices) are shown. Averaged distance-normalized contact frequencies between cis pairs of genomic bins were arranged by changing PC1 values. f, Violin plots comparing distributions of log2 ratios for averaged genomic interaction frequencies involving different compartments are shown for WT-Rag1−/−.hIgM and E34Δ-Rag1−/−.hIgM pre-B cells. Statistical analyses of changes were calculated using a paired t-test. g, Pearson correlation matrices for HiC reads derived from WT-Rag1−/−.hIgM and E34Δ-Rag1−/−.hIgM pre-B cells are shown at 50-kb resolution. Blue and black dashed interrupted rectangles indicate changes in compartment association involving the E34 subTAD (black triangles) with genomic regions located across the Igk locus and genomic regions positioned outside the Igk locus, respectively. Yellow and blue dots indicate the E34 enhancer and the IgκRR, respectively. obs/exp, observed divided expected.
Fig. 5 |
Fig. 5 |. The E34 enhancer instructs chromatin accessibility, the deposition of activating histone marks, CTCF occupancy and noncoding transcription across the E34 subTAD.
a, UCSC Genome Browser tracks spanning the Igk locus showing ATAC-seq reads for WT-Rag1−/−.hIgM and E34Δ-Rag1−/−.hIgM pre-B cells. b, UCSC Genome Browser tracks spanning the Igk locus show the deposition of H3K27ac, H3K4me1, H3K27me3 and H3K9me3 in WT-Rag1−/−.hIgM and E34Δ-Rag1−/−.hIgM pre-B cells. CTCF occupancy and RNA-seq reads are also shown for WT-Rag1−/−.hIgM and E34Δ-Rag1−/−.hIgM pre-B cells. Significant peaks were called using MACS2 (cutoff FDR < 0.05). The P value threshold for H3K9me3 abundance was 0.001. Indicated (dashed lines) is the location of the E34 subTAD. Blue arrows indicate noncoding transcripts associated with the E34 subTAD expressed in WT-Rag1−/−.hIgM and E34Δ-Rag1−/−.hIgM pre-B cells, respectively. c, Fold changes in peak enrichment for chromatin accessibility (ATAC-seq reads) across the E34 subTAD and the rest of the lgk locus are indicated. d, Fold changes in peak enrichment for H3K4me1 abundance across the E34 subTAD and the rest of the lgk locus are indicated. e, Fold changes in V-gene noncoding transcript abundance, expressed as transcripts per million (TPM), within the E34 subTAD as well as other subTADs that span the rest of the lgk locus are indicated. f, Fold changes in H3K27me3 enrichment per 50-kb bin within the E34 subTAD and the rest of the lgk locus are shown. g, Fold changes in H3K9me3 enrichment per 50-kb bin within the E34 subTAD and the rest of the lgk locus are shown. Significant differences between groups in cg were computed using an unpaired Student’s t-test. Data shown were derived from two independent experiments using four mice per group.
Fig. 6 |
Fig. 6 |. The E34 enhancer instructs the deposition of epigenetic marks at genomic regions associated with Igk locus chromatin folding and Vκ-Jκ rearrangement.
a, UCSC Genome Browser tracks show the deposition of H3K27ac, H3K4me1, CTCF, H3K27me3 and H3K9me3 across the E34 subTAD in WT-Rag1−/−.hIgM and E34Δ-Rag1−/−.hIgM pre-B cells. ATAC-seq and RNA-seq reads for WT-Rag1−/−.hIgM and E34Δ-Rag1−/−.hIgM pre-B cells are also shown. Significant peaks were called using MACS2 (cutoff FDR < 0.05). The P value threshold for H3K9me3 abundance was 0.001. Blue highlights indicate the location of the chromatin interactions depleted in E34Δ-Rag1−/−.hIgM pre-B cells as compared with WT-Rag1−/−.hIgM pre-B cells using the IgκRR as a viewpoint. b, Shown are CTCF binding sites involved in chromatin interactions proximal to the CER element affected in E34Δ-Rag1−/−.hIgM pre-B cells when compared with WT-Rag1−/−.hIgM pre-B cells. c, Shown are CTCF binding sites involved in chromatin interactions near the Igkv8–28 gene segment affected in E34Δ-Rag1−/−. hIgM pre-B cells when compared with WT-Rag1−/−.hIgM pre-B cells. d, Fold changes in chromatin accessibility at the RSSs of Vκ genes located within the E34 subTAD and subTADs that span the rest of the lgk locus are shown. e, Fold changes in H3K4me1 enrichment at the RSSs of Vκ genes located within the E34 subTAD and subTADs that span the rest of the lgk locus are shown. Significant differences between groups in d and e were calculated using an unpaired Student’s t-test. f, Correlation between Vκ rearrangement frequencies, DNA accessibility and H3K4me1 enrichment at the Vκ RSS is indicated. Correlation coefficients (r) and P values were calculated using simple linear regression. g, Fold changes in Vκ rearrangement frequencies, DNA accessibility and H3K4me1 enrichment at the Vκ RSS are shown. h, Chromatin accessibility and H3K4me1 abundance across the Igkv7–33 gene are shown.
Fig. 7 |
Fig. 7 |. The E34 enhancer impedes recruitment of the E34 subTAD to pericentromeric heterochromatin.
a, HiC Pearson correlation matrices derived from WT-Rag1−/−.hIgM and E34Δ-Rag1−/−.hIgM pre-B cells are shown at 50-kb resolution. Included are tracks for H3K27me3 and H3K9me3 abundance in WT-Rag1−/−.hIgM and E34Δ-Rag1−/−.hIgM pre-B cells. Dashed black rectangles show correlation between de novo chromatin interactions emanating from the E34 subTAD in E34Δ-Rag1−/−.hIgM pre-B cells (black arrows) and genomic regions deposited by transcriptionally repressive epigenetic marks. The E34 subTAD is shown as dashed triangles. Yellow and blue dots indicate the locations of the E34 enhancer and the IgκRR. b, Virtual 4C plots using the E34 subTAD as a viewpoint across chromosome 6 are indicated. PC1 scores and deposition of H3K27me3 and H3K9me3 are shown. Blue highlights indicate correlation between chromatin interactions emanating from the E34 subTAD, negative PC1 values and genomic regions associated with the deposition of transcriptional repressive marks. Virtual 4C plots were plotted at 50-kb resolution using a moving average of three genomic (50-kb) regions. One representative set of H3K27me3 and H3K9me3 reads derived from two independent experiments was plotted. c, Statistical analyses correlating enrichment of H3K9me3 abundance in counts per million (CPM) and KR-normalized HiC contact frequencies are shown. d, Statistical analyses correlating enrichment of H3K27me3 abundance in counts per million (CPM) and KR-normalized HiC contact frequencies are shown. e, Statistical analyses of correlation between PC1 values and the KR-normalized HiC contact frequencies (E34Δ–WT) are indicated. Significant differences between groups in ce were calculated using an unpaired t-test. f, Correlations between H3K9me3 abundance and KR-normalized HiC contact frequencies (E34Δ–WT) are shown. Correlation coefficient (r) and P values were calculated using simple linear regression.
Fig. 8 |
Fig. 8 |. Impaired natural antibody responses and increased S. pneumoniae lethality in E34Δ mice.
a, Quantification of anti-phosphorylcholine antibodies using ELISA for serum isolated from WT and E34Δ mice (n = 4) presented as mean ± s.e.m. b, Quantification of EO6/T15 IgM antibodies using ELISA for serum isolated from WT (n = 6) and E34Δ mice (n = 7) presented as mean ± s.e.m. c, Infection strategy to assess impact of changes in anti-phosphorylcholine antibody levels in mice survival. d, Effects on lethality after transfer of a mixture of serum derived from WT and E34Δ mice and S. pneumoniae (50 colony-forming units) into Rag1−/− mice (n = 3). e, Quantification of EO6/T15 IgM using ELISA for serum isolated from WT and E34Δ mice after i.p. immunization with 108 heat-killed S. pneumoniae (HKSP) (n = 3). Serum was collected 4 d post-inoculation. Data are presented as mean ± s.e.m. Significant differences between WT and E34Δ ELISA data were determined using an extra sum-of-squares F test. f, Quantification of EO6/T15 IgM using ELISA for serum isolated from WT and E34Δ mice after i.p. immunization with 108 HKSP (n = 3). Serum was collected 7 d post-inoculation. Data are presented as mean ± s.e.m. Significant differences between WT and E34Δ ELISA data were determined by an extra sum-of-squares F test. g, Strategy to assess lethality of WT and E34Δ mice after infection with S. pneumoniae (50 colony-forming units), MRSA (low dose = 0.8 × 10⁸ and high dose = 1.7 × 10⁸ colony-forming units) and influenza virus (50 PFU). Data are derived from three independent experiments for S. pneumoniae and two independent experiments for MRSA and influenza. h, Lethality of WT and E34Δ mice after intravenous infection with S. pneumoniae (50 colony-forming units). i. Lethality of WT and E34Δ mice after intravenous infection with MRSA (low dose = 0.8 × 10⁸ and high dose = 1.7 × 10⁸ colony-forming units). j, Lethality of WT and E34Δ mice after intranasal infection with influenza virus. To analyze ELISA data, a four-parameter logistic (4PL) curve regression model was used. Significant differences between WT and E34Δ ELISA data (a, b, e, f) were determined using an extra sum-of-squares F test. Significant differences in survival in d and hj were analyzed using a log-rank (Mantel–Cox) test. abs, absorbance; i.p., intraperitoneal; NS, not significant.

References

    1. Schatz DG & Ji Y Recombination centres and the orchestration of V(D)J recombination. Nat. Rev. Immunol. 11, 251–263 (2011). - PubMed
    1. Novobrantseva TI et al. Rearrangement and expression of immunoglobulin light chain genes can precede heavy chain expression during normal B cell development in mice. J. Exp. Med. 189, 75–88 (1999). - PMC - PubMed
    1. Wong JB et al. B-1a cells acquire their unique characteristics by bypassing the pre-BCR selection stage. Nat. Commun. 10, 4768 (2019). - PMC - PubMed
    1. Nemazee D Mechanisms of central tolerance for B cells. Nat. Rev. Immunol. 17, 281–294 (2017). - PMC - PubMed
    1. Dixon JR et al. Topological domains in mammalian genomes identified by analysis of chromatin interactions. Nature 485, 376–380 (2012). - PMC - PubMed

Publication types