. 2023 Feb;5(2):314-330.
doi: 10.1038/s42255-022-00730-6. Epub 2023 Jan 30.

Extracellular acidosis restricts one-carbon metabolism and preserves T cell stemness

Affiliations

Extracellular acidosis restricts one-carbon metabolism and preserves T cell stemness

Hongcheng Cheng et al. Nat Metab. 2023 Feb.

Abstract

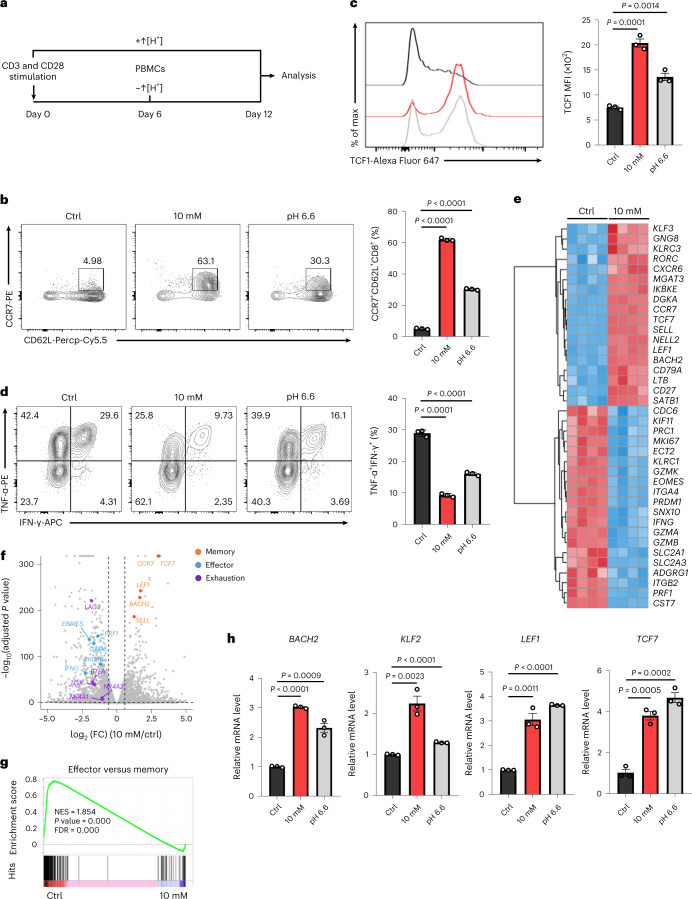
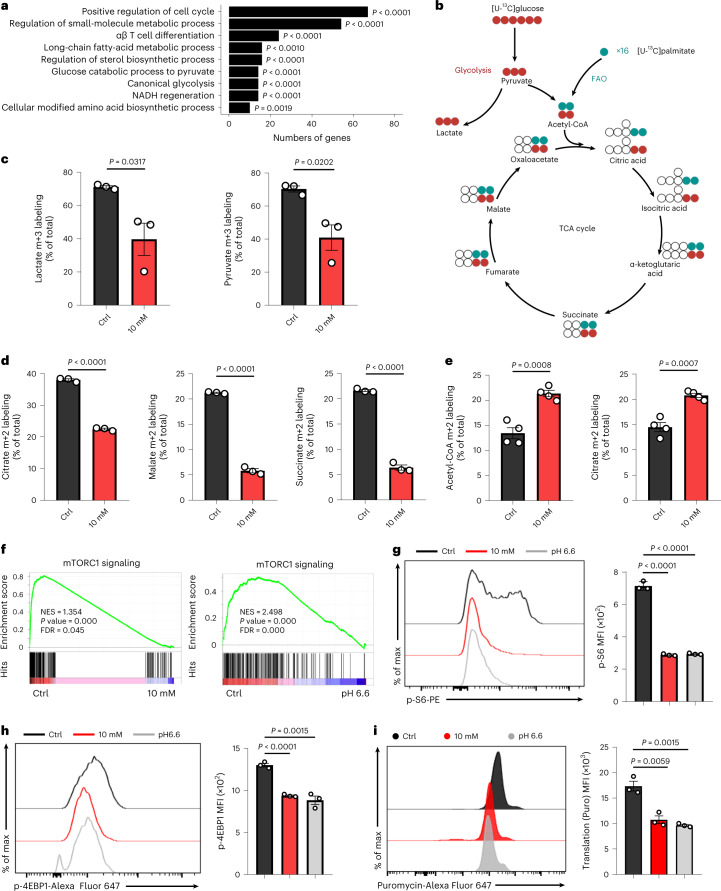
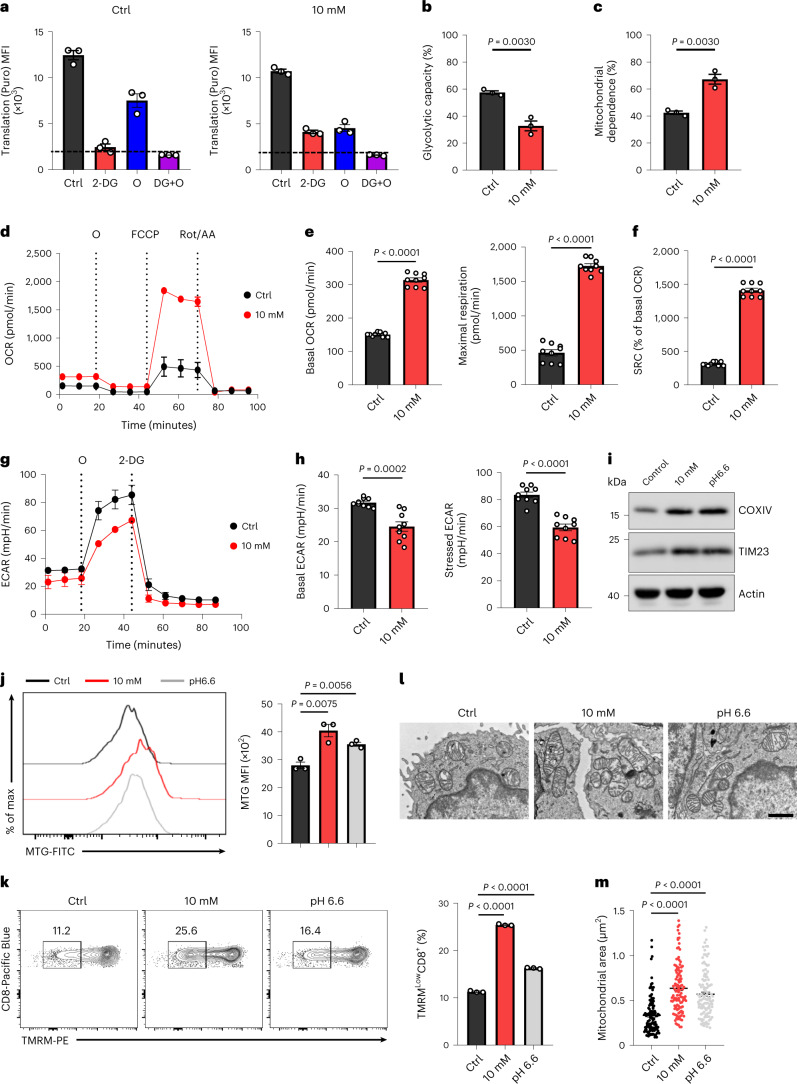
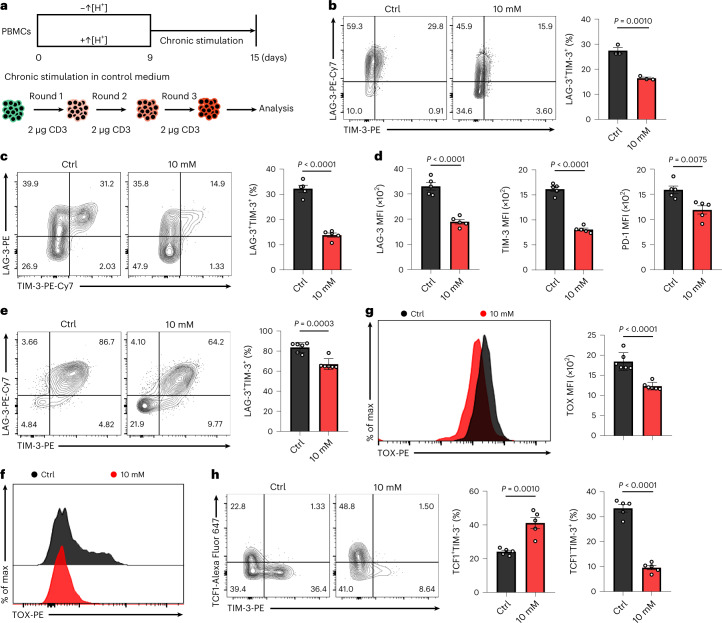
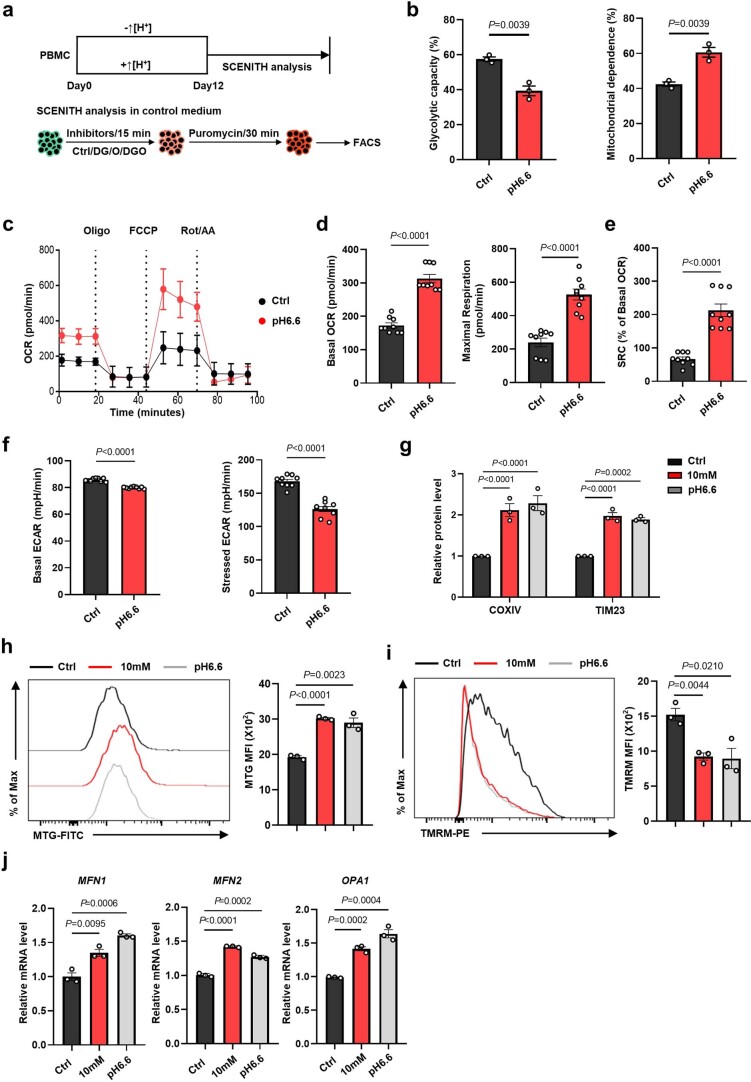
The accumulation of acidic metabolic waste products within the tumor microenvironment inhibits effector functions of tumor-infiltrating lymphocytes (TILs). However, it remains unclear how an acidic environment affects T cell metabolism and differentiation. Here we show that prolonged exposure to acid reprograms T cell intracellular metabolism and mitochondrial fitness and preserves T cell stemness. Mechanistically, elevated extracellular acidosis impairs methionine uptake and metabolism via downregulation of SLC7A5, therefore altering H3K27me3 deposition at the promoters of key T cell stemness genes. These changes promote the maintenance of a 'stem-like memory' state and improve long-term in vivo persistence and anti-tumor efficacy in mice. Our findings not only reveal an unexpected capacity of extracellular acidosis to maintain the stem-like properties of T cells, but also advance our understanding of how methionine metabolism affects T cell stemness.


Conflict of interest statement

The authors declare no competing interests.

Figures

Fig. 1
Fig. 1. ↑[H+] exposure facilitates the differentiation of stem-like CD8+ T cells.
a, Schematic of human T cell activation in the indicated conditions: pH 7.4 (–↑[H+], control), pH 6.6 (+↑[H+], hydrochloric acid), or 10 mM lactic acid (+↑[H+]). PBMCs, peripheral blood mononuclear cells. b, Representative CCR7 and CD62L expression profiles in human CD8+ T cells under different conditions at day 12. n = 3 independent samples. c, Representative histograms and quantification of TCF1 expression in human CD8+ T cells under different conditions at day 12. n = 3 independent samples. MFI, mean fluorescence intensity. d, Human T cells were expanded as in a for 12 days and stimulated with phorbol 12-myristate 13-acetate (PMA) containing brefeldin A (BFA) for 4.5 h. The intracellular expression profile of IFN-γ and TNF-α is depicted for T cells in the pH 7.4 (left), 10 mM lactic acid (middle) or pH 6.6 (right) condition. n = 3 independent samples. e,f, RNA-seq analysis of human T cells that were expanded in control (pH 7.4) or lactic acid (10 mM). Heat map of selected genes (e) and volcano plot of all genes in which genes associated with memory, effector and exhausted T cells were labeled (f). In the volcano plot, the x axis represents the log2-transformed fold change (FC) values for cells treated with lactic acid relative to controls at day 12, and the y axis represents the adjusted P values. n = 4 independent samples. g, GSEA plot comparing control with lactic-acid-conditioned T cells for effector versus memory enrichment. NES, normalized enrichment score. h, Quantitative mRNA expression of transcription factors associated with T cell stemness (BACH2, KLF2, LEF1, TCF7) in T cells under the indicated conditions. n = 3 independent samples. Data are presented as mean ± s.e.m. Statistical analyses were determined by unpaired two-tailed Student’s t-test (bd,h). Nominal P values and false-discovery rates (FDRs) were calculated with default method of the GSEA software (g). Source data
Fig. 2
Fig. 2. ↑[H+] exposure triggers metabolic reprogramming and suppresses mTOR signaling.
a, GO analysis using RNA-seq data, showing representative differentially expressed metabolic genes in control and lactic-acid-conditioned human T cells (adjusted P value < 4.23 × 10⁻²). b, Schematic of [13C6]glucose or [13C16]palmitate labeling patterns. c, Percentage of the indicated m+3 lactate out of total lactate or of m+3 pyruvate out of total pyruvate in T cells. n = 3 independent samples. d, Percentage of isotopomer for the TCA intermediates, such as citrate (m+2), malate (m+2) and succinate (m+2), derived from [13C6]glucose. n = 3 independent samples. e, Percentage of the indicated m+2 acetyl-CoA out of total acetyl-CoA or of m+2 citrate isotope out of total citrate in T cells from [13C16]palmitate. n = 4 independent samples. f, GSEA with statistical analysis of the gene set associated with mTORC1 signaling in control versus lactic-acid-conditioned (left) or pH 6.6-conditioned (right) human T cells. g,h, Flow cytometric analysis and quantification for S6 phosphorylated at Ser235 and Ser236 (g) and 4EBP1 phosphorylated at Thr37 and Thr46 (h) in human CD8+ T cells under the indicated conditions. n = 3 independent samples. i, Flow cytometric analysis and quantification of energy-intensive protein synthesis in controls or lactic-acid- or pH 6.6-conditioned human T cells. n = 3 independent samples. Data are presented as mean ± s.e.m. Statistical analyses were determined by one-sided Fisher exact test with Benjamini–Hochberg multiple-comparisons test (a) or unpaired two-tailed Student’s t-test (ce,gi). Nominal P values and FDRs were calculated with the default method in the GSEA software (f). Source data
Fig. 3
Fig. 3. Increased [H+] alters T cell methionine metabolism to preserve epigenetic stemness.
a, GSEA plot of the gene set associated with one-carbon metabolism and cysteine and methionine metabolism in control versus lactic-acid-conditioned human T cells. b, Schematic of [13C5]methionine labeling patterns. c, Percentage of intracellular SAM (m+5), SAH (m+4) and MTA (m+1) derived from [13C5]methionine, out of their respective total pools, in T cells cultured in control conditions or with 10 mM lactic acid or 10 mM lactic acid supplemented with methionine (10 mM + Met). n = 3 independent samples. d, Relative abundance of [12C5]methionine and [13C5]methionine in T cells. e, Representative histogram and quantification of TCF1 in human CD8+ T cells cultured in various conditions. n = 3 independent samples. f, Effects of methionine supplementation on histone methylation in human T cells. H3K4me3, histone H3 trimethylated at K4; H3K79me2, H3 dimethylated at K79; H3K27me3, H3 trimethylated at K27; H3K9me2, H3 dimethylated at K9. n = 3 independent samples. g, Genome track view of representative gene loci showing H3K27me3 (red, above the line) or H3K4me3 (blue, below the line) peaks. CUT&Tag-seq data are from two independent samples. Data are presented as mean ± s.e.m. Nominal P values and FDRs were calculated with the default method of the GSEA software (a). Statistical analyses were done using two-way analysis of variance (ANOVA) with Tukey’s multiple-comparisons test (cf). Source data
Fig. 4
Fig. 4. Mitochondrial fitness is sustained in T cells exposed to ↑[H+].
a, SCENITH analysis of the human T cells in control or lactic-acid-conditioned T cells. Representative translation level (anti-Puro) is shown (n = 3 independent samples). The dashed line represents the background level obtained after 2-deoxy-d-glucose + oligomycin (2-DG+O) treatment. b,c, Quantitative analysis of glycolytic capacity (b) and mitochondrial dependence (c) within a. n = 3 independent samples. df, OCR (d) of control and lactic-acid-conditioned T cells was measured in real-time under basal conditions in response to the indicated inhibitors. FCCP, carbonyl cyanide-p-trifluoromethoxyphenylhydrazone; ROT/AA, rotenone and antimycin A. Representative statistical analysis of basal OCR (e), maximal respiration (e) and SRC (f). n = 9 tests; 3 independent samples were analyzed and each sample was measured 3 times. g,h, ECAR (g) of control or lactic-acid-conditioned T cells measured in response to the indicated inhibitors. Representative statistical analysis of basal ECAR and stressed ECAR (h). n = 9 tests; 3 independent samples were detected and each sample was measured 3 times. i, Immunoblot analysis of COXIV and TIM23 in human T cells under the indicated conditions. Actin was used as a loading control. j,k, Representative histograms or contour plots and statistical analysis of mitochondrial mass (MTG) (j) and mitochondrial membrane potential (TMRM) (k), respectively, in the control or lactic-acid- or pH 6.6-conditioned human T cells. n = 3 independent samples. l,m, Representative mitochondrial morphology of T cells cultured in the control condition, lactic acid or the pH 6.6 condition for 12 days, analyzed by EM (scale bar, 1 μM) (l). The area of individual mitochondria in T cells (m), n = 45 cells. Data are presented as mean ± s.e.m. Statistical analyses were done using unpaired two-tailed Student’s t-test. Source data
Fig. 5
Fig. 5. ↑[H+]-expanded T cells display enhanced anti-tumor activity.
a,b, Control or lactic-acid-expanded CD8+ T cells were analyzed for persistence after adoptive transfer (n = 6 mice). Freshly isolated mouse CD45.1+ OT-I T cells were activated with mouse IL-2 and plate-bound anti-mouse CD3 and anti-mouse CD28 antibodies for 2 days and then maintained in a culture medium with mouse IL-2 until adoptive transfer (CD3&CD28+IL-2). A schematic of the animal experiment (a) as well as representative FACS plots and statistical analysis of CD45.1+ and CD45.2+ T cells in the blood are shown in (b). cg, CD45.1+ OT-I T cells were expanded in control or lactic acid medium for 7 days and transferred into B16-OVA-tumor-bearing mice, and the infiltration of ratio was evaluated (n = 5 mice). A schematic of animal experiment using B16-OVA tumor-bearing mice (c), as well as representative FACS plots (left) and statistics for the number (right) of transferred CD45.1+ OT-I T cells in the tumor (d). s.c., subcutaneous injection. Statistics for the percentage of CD45.1+ T cells (e) and representative data (left) and statistics for the percentage (right) of CD62L+CD44+CD45.1+ T cells (f) in the spleen are shown. Tumor growth curve (g) (n = 5 mice, day 14). hj, CD19-CAR T cells were expanded in control or lactic acid medium for 12 days and transferred into CD19-overexpressing K562 tumor-bearing NCG mice, and the infiltration ratio in tumor and spleen were evaluated (n = 6 mice). A schematic of the animal experiment (h), representative percentage of transferred T cells in the tumor and spleen (i) and tumor growth curves (j) are shown (n = 6 mice, day 10). Data are presented as mean ± s.e.m. Statistical analyses were done using unpaired two-tailed Student’s t-test. Source data
Fig. 6
Fig. 6. ↑[H+] exposure restricts T cell exhaustion.
a, Schematic of chronic stimulation of human T cells in vitro. b, Representative FACS plots for LAG-3 and TIM-3 in chronic stimulated human T cells cultured in control or lactic acid conditions. n = 3 independent samples. c, The expression of LAG-3 and TIM-3 in CD45.1+ TILs from B16-OVA tumor-bearing C57BL/6N mice (n = 5 mice). d, Quantification of the expression of LAG-3, TIM-3 and PD-1 in CD45.1+ TILs from B16-OVA-tumor-bearing C57BL/6N mice (n = 5 mice). e, The expression of LAG-3 and TIM-3 in tumor-infiltrating CD19-CAR T cells from CD19-K562 tumor-bearing NCG mice, as determined by flow cytometry (n = 6 mice). f, The expression of TOX in CD45.1+ TILs from B16-OVA tumor-bearing C57BL/6N mice (n = 5 mice). g, The histograms and statistical analysis of TOX in tumor-infiltrating CD19-CAR T cells from CD19-K562 tumor-bearing NCG mice (n = 6 mice). h, Left, representative flow cytometry plots for TIM-3 and TCF1 in CD45.1+ TILs from B16-OVA tumor-bearing C57BL/6N mice (n = 5 mice). Right, the percentage of TCF1+TIM-3 or TCF1TIM-3+ populations. Data are presented as mean ± s.e.m. Statistical analyses were done using unpaired two-tailed Student’s t-test. Source data
Extended Data Fig. 1
Extended Data Fig. 1. Elevated [H+] promotes T cell differentiation to memory state.
(a) Representative FACS plots of CD45RO/CD27 human CD8+ T cells under different conditions at day 12. n = 3 independent samples. (b) Representative histograms of TCF1 expression in OT-I CD8+ T cells cultured in indicated conditions for 6 days. n = 3 independent samples. (c) Expression of CCR7 (purple) and TCF1 (blue) in human CD8+ T cells that were activated and expanded in indicated concentration of lactic acid medium for 12 days. (d) Principal component analysis (PCA) of RNA-seq data from control and lactic acid conditioned human T cells. (e) RNA-seq analysis of control (pH 7.4) and hydrochloric acid (pH 6.6) expanded human T cells. Differentially expressed genes associated with memory, effector, and exhaustion of T cells are depicted. Volcano plot with the x-axis representing the log2-transformed fold changes for cells treated with pH 6.6 (hydrochloric acid) relative to control at day 12 and y-axis representing the adjusted P values. (f) GSEA plots comparing control and hydrochloric acid conditioning T cells for effector versus memory enrichment. (g,h) OT-I CD8+ T cells were expanded in control medium for 5 days and transferred in pH 6.6 or 10 mM lactic acid conditions for 24 h, and then cultured within the indicated conditions for 12 h and stimulated with PMA containing BFA for 4.5 h (g). The percentages of IFN-γ+TNF-α+ population under different conditions are shown (h). n = 3 independent samples. (i) OT-I CD8+ T cells were expanded in control medium for 5 days and transferred in pH 6.6 or 10 mM lactic acid conditions from day 5–6 and then detected the expression of TCF1. n = 3 independent samples. (j) Expression of TCF1 in human CD8+ T cells that were activated and expanded at indicated concentration of sodium lactate medium for 12 days. (k) Statistical analysis of TCF1 expression in human CD8+ T cells conditioned with either 10 mM of lactic acid (red) or 10 mM of sodium lactate (black). n = 3 independent samples. Data are presented as mean ± SEM. Statistical analyses were determined by two-way ANOVA with Dunnett’s multiple-comparisons test (a), unpaired two-tailed Student’s t-test (b,i) or two-way ANOVA with Tukey’s multiple-comparisons test (h,k). Nominal P value and FDR were calculated with default method of GSEA software (f). ns, non-significant. Source data
Extended Data Fig. 2
Extended Data Fig. 2. ↑[H+] exposure limits nutrient uptake and results in T cell metabolic alterations.
(a) GSEA plot of gene set associated with glycolysis in control versus lactic acid conditioned human T cells. (b) GSEA plots comparing enrichment of amino acid metabolism and fatty acid metabolism in control and lactic acid conditioned human T cells. (c) Quantitative mRNA expression of genes associated with glycolysis (SLC2A1, SLC2A3, LDHA) and fatty acid metabolism (CPT1α) in control and lactic acid conditioned human T cells. n = 3 independent samples. (d) Heat map showing the relative abundance of differential metabolites in human T cells under control and lactic acid conditions. (e,f) Quantification of glycolytic intermediates (e) and FAO metabolites (f) by liquid chromatography and mass spectrometry in human T cells under the indicated conditions (Data are from 4 replicates per condition). (g) Heat map depicting the abundance of metabolites of amino acid metabolism in control and lactic acid conditioned human T cells. (h) Relative glucose consumption by assessing the [13C6] glucose in the supernatant under control or lactic acid treatment. n = 3 independent samples. (i) Flow cytometric analysis and quantification for BODIPY FL C16 uptake in the indicated conditions. n = 3 independent samples. Data are presented as mean ± SEM. Statistical analyses were determined by unpaired two-tailed Student’s t-test (c,e,f,h,i). Nominal P value and FDR were calculated with default method of GSEA software (a,b). Source data
Extended Data Fig. 3
Extended Data Fig. 3. ↑[H+] exposure suppresses mTOR signaling.
(a) Gene ontology (GO) analysis from RNA-seq data showing several differentially expressed genes associated with signaling pathways in control versus lactic acid conditioned human T cells (P value adjusted < 4.27×10⁻²). (b) GSEA plots with statistical analysis of gene sets associated with NF-кB (left) and PI3K-AKT (right) signaling comparing control versus lactic acid conditioned human T cells. (c) Assessment and quantification of p-AKT (Ser473) and p-NF-кB (Ser536) by western blot in control, lactic acid and pH 6.6 conditioned human T cells. n = 3 independent samples. (d) Flow cytometric analysis and quantification of forward scatter in control, lactic acid and pH 6.6 conditioned human CD8+ T cells. n = 3 independent samples. (e) Representative histogram and quantification of TCF1 in Rapa-treated (10 nM) and control human T cells. n = 3 independent samples. (f) Quantitative mRNA expression of BACH2 and KLF2 in Rapa-treated human T cells. n = 3 independent samples. Data are presented as mean ± SEM. Statistical analyses were determined by one-sided Fisher exact test with Benjamini & Hochberg multiple-comparisons (a), two-way ANOVA with Tukey’s multiple-comparisons test (c) or unpaired two-tailed Student’s t-test (d-f). Nominal P value and FDR were calculated with default method of GSEA software (b). Source data
Extended Data Fig. 4
Extended Data Fig. 4. Exogenous methionine supplementation reprograms ↑[H+]-induced restriction of methionine metabolism and stemness-like phenotype.
(a) GSEA plot of genes set associated with one-carbon metabolism and cysteine and methionine metabolism in control versus pH 6.6 conditioned human T cells. (b) Quantitative mRNA expression of genes associated with one-carbon metabolism (MTR, AHCY, BHMT, SHMT1, SHMT2) in control and 10 mM lactic acid conditioned human T cells. n = 3 independent samples. (c) Quantification of methionine metabolic intermediates (Methionine, SAM, SAH, Serine, Homocysteine) by liquid chromatography and mass spectrometry under the indicated conditions (Data are from 4 replicates per condition). (d) Relative methionine uptake by assessing the [13C5] methionine in the supernatant in different conditions. n = 3 independent samples. (e) Left: Representative histogram of TCF1 in Ctrl (100 μM methionine) and -Met (20 μM methionine) conditioned human CD8+ T cells. Right: The statistical percentage of TCF1+CD8+ T cells population. n = 3 independent samples. (f) Flow cytometric analysis of CD44+CD62L+ population in Ctrl (100 μM methionine) and -Met (20 μM methionine) conditioned T cells. (g) Representative FACS plots show percentage of CCR7+CD62L+ population in human CD8+ T cells cultured with the indicated conditions. (h) Representative histogram and quantification of TCF1 in human CD8+ T cells cultured with control, pH 6.6 or pH 6.6 supplemented with methionine conditions. n = 3 independent samples. (i) Representative histogram and quantification of TCF1 in human CD8+ T cells cultured with control, 10 mM lactic acid, or 10 mM lactic acid supplemented with SAM or SAH conditions. n = 3 independent samples. Data are presented as mean ± SEM. Nominal P value and FDR were calculated with default method of GSEA software (a). Statistical analyses were determined by unpaired two-tailed Student’s t-test (b,c,e) or two-way ANOVA with Tukey’s multiple-comparisons test (d,h,i). ns, non-significant. Source data
Extended Data Fig. 5
Extended Data Fig. 5. ↑[H+] exposure triggers the changes of epigenetic patterns in T cells.
(a) Schematic of the methionine cycle. (b) Effects of methionine supplementation on histone methylation in human T cells. n = 3 independent samples. (c) Heat map of genes associated with histone methyltransferases in control or lactic acid conditioned human T cells. (d) EZH2 expression in ↑[H+]-exposed T cells. n = 3 independent samples. (e,f) T cells were activated for 3 days and then treated with EZH2 inhibitor (GSK126, 10 μM) for 9 days. Effects of GSK126 treatment on the TCF1 expression (e) and generation of CCR7+CD62L+ T cell population (f). n = 3 independent samples. (g) Bar plot showing the percentage of H3K4me3 or H3K27me3 peaks at promoter regions (±1 kb from the TSS), gene body regions, or intergenic regions. UTR, untranslated region; TSS, transcription start site. (h) Quantitative mRNA expression of transcription factors associated with T cell stemness (BACH2, KLF2, LEF1, TCF7) under the indicated conditions. n = 3 independent samples. Data are presented as mean ± SEM. Statistical analyses were determined by two-way ANOVA with Tukey’s multiple-comparisons test (b,h) or unpaired two-tailed Student’s t-test (d-f). ns, non-significant. Source data
Extended Data Fig. 6
Extended Data Fig. 6. MYC-SLC7A5 axis is involved in the direct regulation of ↑[H+]-induced methionine restriction and stemness-like status.
(a) Quantitative mRNA expression of methionine transporters (SLCs) in control and lactic acid conditioned human T cells. Box plots include minima, maxima and the centre line (median); box limits show the upper and lower quartiles; whiskers are 1.5× the interquartile range. Data are from 4 replicates per condition. (b) Assessment and quantification of the expression of methionine transporters in ↑[H+]-exposed T cells. n = 3 independent samples. (c) GSEA plot of genes set associated with MYC activity pathways in control versus lactic acid conditioned human T cells. (d) Assessment and quantification of the expression of MYC in ↑[H+]-exposed T cells. n = 3 independent samples. (e) Binding of MYC to the promoter of SLC7A5, SLC38A2, SLC38A1 and NCL (a well-known MYC target used as a positive control), analyzed by ChIP assays in T cells cultured with control or lactic acid conditions. n = 3 independent samples. (f) Effects of overexpression of MYC on methionine transporters under ↑[H+] exposure. n = 3 independent samples. (g) Methionine supplementation in ↑[H+] conditions for 12 days to assess the expression of MYC and methionine transporters in T cells. n = 3 independent samples. (h,i) Transfected T cells were cultured in different conditions for 9 days. Effects of overexpression of SLC7A5 on the generation of TCF1 expression (h) and CCR7+CD62L+ population (i). n = 3 independent samples. Data are presented as mean ± SEM. Statistical analyses were determined by two-way ANOVA with Sidak’s multiple-comparisons test (a), two-way ANOVA with Tukey’s multiple-comparisons test (b,f,gi) or unpaired two-tailed Student’s t-test (d,e). Nominal P value and FDR were calculated with default method of GSEA software (c). ns, non-significant. Source data
Extended Data Fig. 7
Extended Data Fig. 7. The expression of MYC and SLC7A5 in different subpopulations of CD8+ T cells within tumors.
(a) MYC expression in tumoral LY108+TIM-3- and LY108TIM-3+ CD8+ T cell populations from B16-OVA tumor-bearing C57BL/6N mice (n = 7 mice). (b) The mRNA level of SLC7A5 in LY108+TIM-3- and LY108TIM-3+ populations from B16-OVA tumor (n = 7 mice). Data are presented as mean ± SEM. Statistical analyses were determined by unpaired two-tailed Student’s t-test. Source data
Extended Data Fig. 8
Extended Data Fig. 8. Increased [H+] enhances mitochondrial activity.
(a) Outline of the SCENITH method. (b) Representative statistical analysis of glycolytic capacity and mitochondrial dependence in control and pH 6.6 conditioned human T cells. n = 3 independent samples. (c-e) OCR (c) of control and pH 6.6 conditioned T cells were measured in real time under basal conditions in response to the indicated inhibitors. Representative statistical analysis of basal OCR (d), maximal respiration (d) and SRC (e). n = 9, 3 independent samples were detected and each sample was measured three times. (f) Representative statistical analysis of basal ECAR and stressed ECAR in control and pH 6.6 conditioned T cells. n = 9, 3 independent samples were detected and each sample was measured three times. (g) Statistics of COXIV and TIM23 in human T cells under indicated conditions. n = 3 independent samples. (h,i) Representative histograms and statistical analysis of mitochondrial mass (h) and mitochondrial membrane potential (i) in the control, lactic acid or pH 6.6 conditioned mouse OT-I T cells. n = 3 independent samples. (j) Quantitative mRNA expression of MFN1, MFN2, OPA1 in T cells. n = 3 independent samples. Data are presented as mean ± SEM. Statistical analyses were determined by unpaired two-tailed Student’s t-test (b,df,hj) or two-way ANOVA with Tukey’s multiple-comparisons test (g). Source data
Extended Data Fig. 9
Extended Data Fig. 9. Exposure to ↑[H+] enhances T cell persistence.
(a) Representative data and statistical analysis used to define the percentages of live (Annexin VPI), early apoptotic (Annexin V+PI) and late apoptotic and necrotic populations (Annexin V+PI+) of OT-I T cells expanded in indicated conditions at day 7. (b,c) Splenocytes and lymphocytes from mice that received control or lactic acid expanded CD8+ T cells were analyzed for persistence after adoptive transfer (n = 6 mice). Representative percentage and statistics analysis of CD45.1+ T cell in the spleen (b) and lymph nodes (c) are shown. (d,e) Draining lymph nodes from B16-OVA tumor-bearing mice that received control or lactic acid expanded CD8+ T cells were analyzed for persistence after adoptive transfer. (n = 5 mice). Representative percentage and statistics analysis of CD45.1+ (d) and CD62L+CD44+ (e) T cells in the lymph nodes are shown. (f) Representative data and statistical analysis used to define the percentages of live (Annexin VPI), early apoptotic (Annexin V+PI) and late apoptotic and necrotic populations (Annexin V+PI+) of CD19-CAR transduced human T cell expanded in indicated conditions for 12 days. (g,h) Representative FACS plots of CD62L+CCR7+ (g) and histograms and statistical analysis of TCF1 (h) in CD19-CAR transduced human T cell expanded in indicated conditions for 12 days. n = 3 independent samples. Data are presented as mean ± SEM. Statistical analyses were determined by unpaired two-tailed Student’s t-test. Source data
Extended Data Fig. 10
Extended Data Fig. 10. ↑[H+]-expanded T cells are less exhausted.
(a) Quantification of LAG-3, TIM-3 and PD-1 on chronic stimulated human T cells under control or lactic acid conditions. n = 3 independent samples. (b) The gating strategy on CD8+CD45.1+ T cells from B16-OVA tumor-bearing C57BL/6N mice. (c) The statistical analysis of TOX in CD45.1+ TILs from Fig. 6F. n = 3 independent samples. (d) Representative histograms and statistical analysis of TOX in chronic stimulated human T cells cultured in control or lactic acid conditions. n = 3 independent samples. (e) Left: Representative FACS plots of LY108 and TIM-3 on CD45.1+ TILs from B16-OVA tumor-bearing C57BL/6N mice (n = 5 mice). Right: The statistical percentage of LY108+TIM-3- population. (f) After stimulating 4.5 h with PMA in the presence of BFA, the expression of IFN-γ and TNF-α in CD45.1+ TILs from B16-OVA tumor-bearing C57BL/6N mice were determined by flow cytometry (n = 5 mice). Left: Representative FACS plots of IFN-γ and TNF-α. Right: The statistical percentage of IFN-γ+TNF-α+ population. Data are presented as mean ± SEM. Statistical analyses were determined by unpaired two-tailed Student’s t-test. ns, non-significant. Source data

Comment in

  • CD8+ T cells pass the acid test.
    Oh JH, Archambault AS, Klein Geltink RI. Oh JH, et al. Nat Metab. 2023 Feb;5(2):201-202. doi: 10.1038/s42255-023-00738-6. Nat Metab. 2023. PMID: 36717750 No abstract available.

References

    1. Gattinoni L, Speiser DE, Lichterfeld M, Bonini C. T memory stem cells in health and disease. Nat. Med. 2017;23:18–27. doi: 10.1038/nm.4241. - DOI - PMC - PubMed
    1. Gao S, et al. Stem cell-like memory T cells: a perspective from the dark side. Cell Immunol. 2021;361:104273. doi: 10.1016/j.cellimm.2020.104273. - DOI - PubMed
    1. Rosenberg SA, Restifo NP. Adoptive cell transfer as personalized immunotherapy for human cancer. Science. 2015;348:62–68. doi: 10.1126/science.aaa4967. - DOI - PMC - PubMed
    1. Ribas A, Wolchok JD. Cancer immunotherapy using checkpoint blockade. Science. 2018;359:1350–1355. doi: 10.1126/science.aar4060. - DOI - PMC - PubMed
    1. Lugli E, Galletti G, Boi SK, Youngblood BA. Stem, effector, and hybrid states of memory CD8+ T cells. Trends Immunol. 2020;41:17–28. doi: 10.1016/j.it.2019.11.004. - DOI - PMC - PubMed

Publication types