. 2023 Jan 30;23(1):34.
doi: 10.1186/s12866-023-02774-4.

Human liver microbiota modeling strategy at the early onset of fibrosis

Affiliations

Human liver microbiota modeling strategy at the early onset of fibrosis

Camille Champion et al. BMC Microbiol. .

Abstract

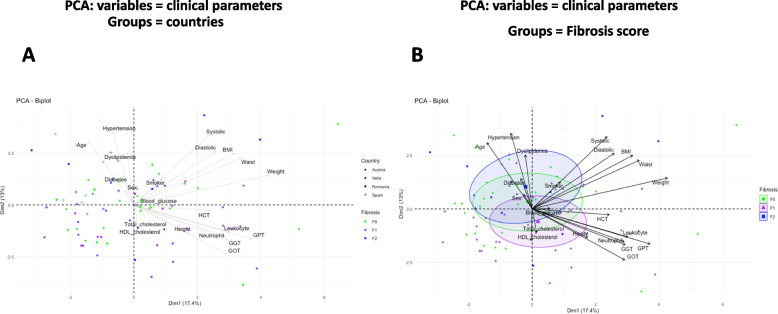
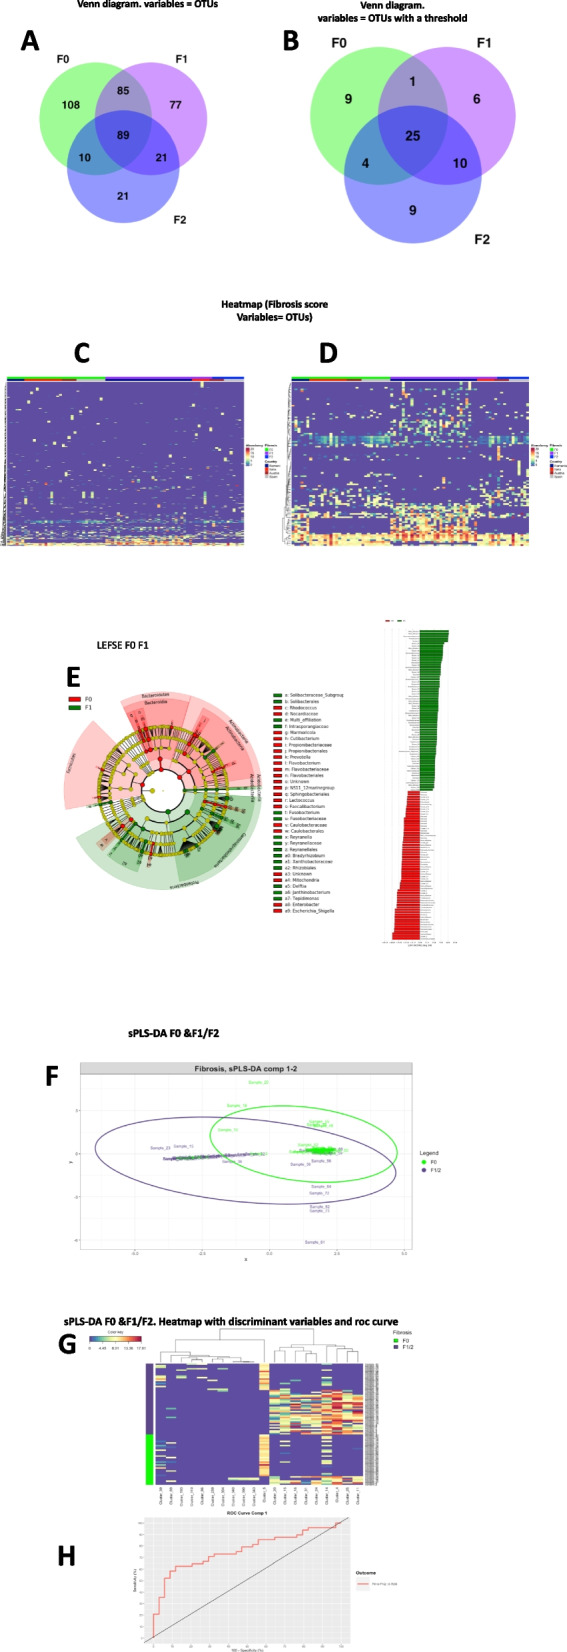
Background: Gut microbiota is involved in the development of liver diseases such as fibrosis. We and others identified that selected sets of gut bacterial DNA and bacteria translocate to tissues, notably the liver, to establish a non-infectious tissue microbiota composed of microbial DNA and a low frequency live bacteria. However, the precise set of bacterial DNA, and thereby the corresponding taxa associated with the early stages of fibrosis need to be identified. Furthermore, to overcome the impact of different group size and patient origins we adapted innovative statistical approaches. Liver samples with low liver fibrosis scores (F0, F1, F2), to study the early stages of the disease, were collected from Romania(n = 36), Austria(n = 10), Italy(n = 19), and Spain(n = 17). The 16S rRNA gene was sequenced. We considered the frequency, sparsity, unbalanced sample size between cohorts to identify taxonomic profiles and statistical differences.

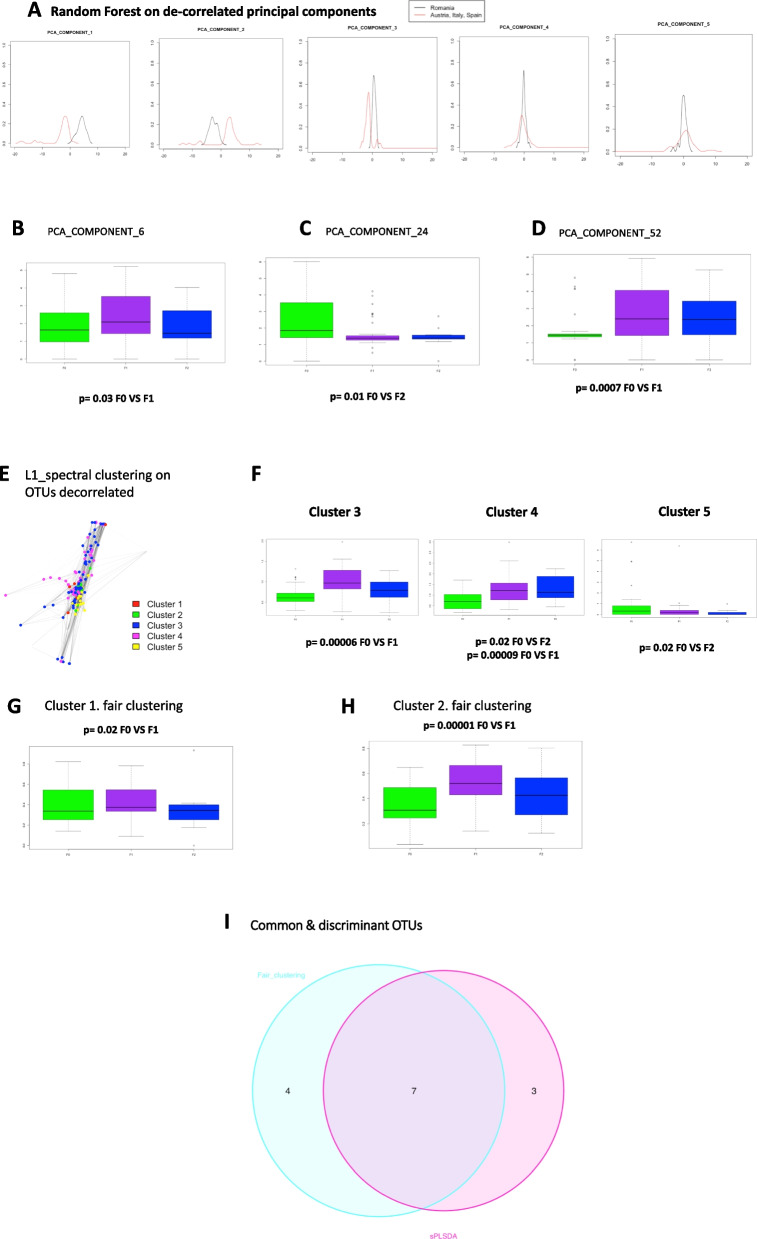
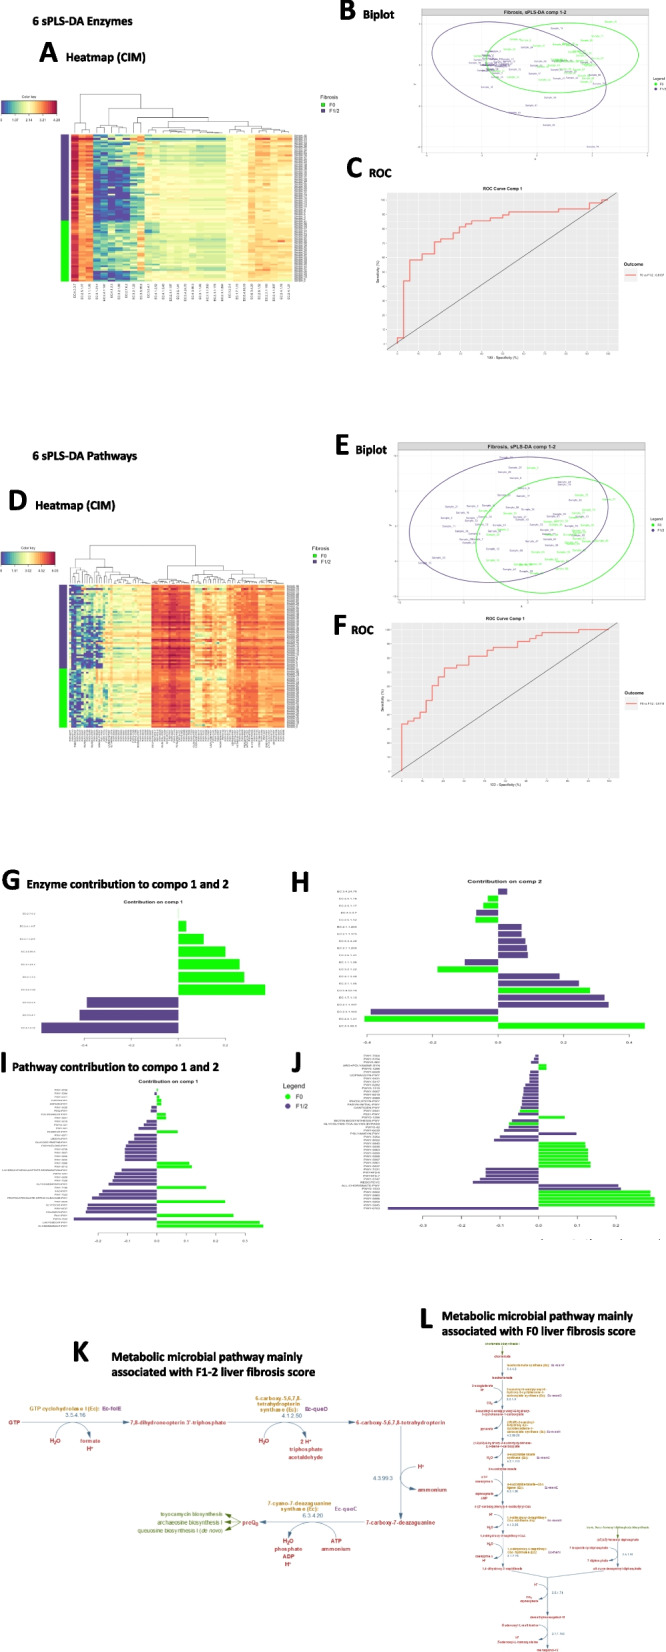
Results: Multivariate analyses, including adapted spectral clustering with L1-penalty fair-discriminant strategies, and predicted metagenomics were used to identify that 50% of liver taxa associated with the early stage fibrosis were Enterobacteriaceae, Pseudomonadaceae, Xanthobacteriaceae and Burkholderiaceae. The Flavobacteriaceae and Xanthobacteriaceae discriminated between F0 and F1. Predicted metagenomics analysis identified that the preQ0 biosynthesis and the potential pathways involving glucoryranose and glycogen degradation were negatively associated with liver fibrosis F1-F2 vs F0.

Conclusions: Without demonstrating causality, our results suggest first a role of bacterial translocation to the liver in the progression of fibrosis, notably at the earliest stages. Second, our statistical approach can identify microbial signatures and overcome issues regarding sample size differences, the impact of environment, and sets of analyses.

Trial registration: TirguMECCH ROLIVER Prospective Cohort for the Identification of Liver Microbiota, registration 4065/2014. Registered 01 01 2014.

Keywords: Biomathematics; Liver diseases; Metabolic disease; Microbiota; Tissue microbiota.


Conflict of interest statement

RB and JA receive honorarium from Vaiomer and have shares.

BL and FS are employees of Vaiomer.

The other authors have no competing interest.

Figures

Fig. 1
Fig. 1
Visualization of clinical variables by principal component analysis according to countries and fibrosis scores. The clinical variables were used as entries for a principal component analysis (PCA). PCA-biplot from package Factoextra and FactomineR of individuals for the first two principal components are shown. They sum up 30.4% of the total variance of the dataset. Patients were grouped by A, countries and fibrosis scores (shape and colours) and by B, fibrosis scores (green dots = F0, purple triangle = F1, blue square = F2). The vectors corresponding to the clinical variables are shown as arrows
Fig. 2
Fig. 2
Visualization of liver 16S rRNA gene sequences by principal component analyses according to countries and fibrosis scores. The 16S rRNA gene OTUs sequences were used as entries for a principal component analysis (PCA). PCA-biplot from package Factoextra and FactomineR of individuals for the first two principal components are shown. They sum up 10.0% of the total variance of the dataset. Patients were grouped by A, countries and fibrosis scores (shape and colour) and by B, fibrosis scores (green dots = F0, purple triangle = F1, blue square = F2). The vectors corresponding to the clinical variables are shown as arrows. C Barplot depicting the frequencies of liver microbial composition of each patient at the phylum level depending on their fibrosis stage or D as means of the phyla frequencies or E the family frequencies for the overall cohort (total) or according to the fibrosis scores (F0, F1, F2)
Fig. 3
Fig. 3
Discriminant analysis strategies of the liver microbiota 16S rRNA gene OTUs according to the fibrosis scores. Venn diagrams where A all the 16S rRNA gene taxa or B data after removing those extremely rare and with unbalanced distribution within the 3 groups of patients with liver fibrosis, were used as entry variables characterizing the 3 liver fibrosis scores (green = F0, purple = F1, blue = F2). C Heatmap of normalized OTU counts according to the 3 groups of patients with liver fibrosis scores and their geographical origin and D a corresponding subset of normalized OTU counts with groups of patients fixed. E LEfSe cladogram of taxonomic assignments from 16S rRNA gene sequence data of the two liver biopsy fibrosis groups (F0 and F1). The cladogram shows the taxonomic levels represented by rings with phyla at the innermost ring and genera at the outermost ring, and each circle is a member within that level. Taxa at each level are shaded according to the liver fibrosis group in which it is more abundant (P < 0.05; LDA score ≥ 2.0). LDA scores are shown on the right panel for each taxon. F sPLSDA classification performance on a CSS normalized microbial table count of the F0 versus F1/2 groups of patients. OTUs were labeled as “Cluster_i” with i from 1 to 411 (total number of variables in the normalized abundance matrix). Sample plot, each point corresponds to an individual and is colored according to its fibrosis score (green = F0, purple = F1/2). G Clustering Image Map (CIM) of the OTUs selected on each sPLS-DA component with groups of patients fixed. H ROC calculated on the predicted scores obtained from the sPLSDA model
Fig.4
Fig.4
Discriminant analyses of the 16S rRNA gene OTUs variables using fairness strategies. A Distribution curves (or densities) of the coordinate of individuals, split into two cohort types (black = Romania, red = the other countries: Italy, Austria, and Spain), when projected on the five first principal components built from the 16S rRNA gene OTUs normalized table count. The non-overlapping plots (for example components 1,2,3) correspond to cohort discriminant components and will be removed from the final analysis to identify the liver fibrosis discriminant variables. Boxplot representing the frequencies of the most significant OTUs contributing to B the 6th, C the 24th, D the 52.nd principal components for the different groups of liver fibrosis scores (green = F0, purple = F1, blue = F2). t Tests were performed for B-D, F–H. E Graphical representation of the normalized OTU table counts whose nodes are colored according to the 5 clusters identified by the l1-spectral clustering algorithm (red = 1, green = 2, blue, 3, pink = 4 and yellow = 5). F Boxplot representing the mean frequencies of the OTUs in cluster 3, 4 and 5, identified by the l1-spectral clustering algorithm, for the different groups of liver fibrosis scores (green = F0, purple = F1, blue = F2). G, H Boxplot representing the frequencies of OTUs in cluster 1, and 2, identified by fair-tree algorithm, for the different groups of liver fibrosis scores (green = F0, purple = F1, blue = F2). I Venn diagram depicting the liver microbial taxonomies of common OTUs identified by standard (sPLS-DA) and fair approaches (fairtree, random forest, l1-spectral clustering) as signatures of low fibrosis scores (blue = sPLSDA, pink = fair algorithms)
Fig. 5
Fig. 5
Identification of clusters by wordclouds representation with or without TFIDF normalization. Wordclouds representing taxa of all significant bacteria according to A, their frequencies at Family and Genus level or B, after TFIDF normalization at Family and Genus level. The size of the name of bacteria is proportional to the frequency of the cluster in the cohorts
Fig. 6
Fig. 6
Predicted functional metagenomics analyses of discriminant enzymes and according to the fibrosis score. A,D Heatmap (Clustering Image Map (CIM)), B,E Sample plot, each point corresponds to an individual and is colored according to its liver fibrosis score (green = F0, purple = F1/2), C,F ROC classification performances of A-C enzymes, and D-F pathways, on a CSS normalized enzyme table count of the F0 versus F1/2 groups of patients. G-I Loading plot representing the contribution of each enzyme (G,H), and pathways (I,J) selected to build the first and second components (green = F0, purple = F1/2). K,L main metabolic pathways from the MetaCyc database identified from the Loading plots for the K F1-2 and K F0 liver fibrosis scores

References

    1. Dim G, Pastore M, Marra F. Liver fibrosis in the context of nonalcoholic steatohepatitis: the role of adipokines. Minerva Gastroenterol Dietol. 2018;64(1):39–50. doi: 10.23736/s1121-421x.17.02427-8. - DOI - PubMed
    1. Rinella ME. Nonalcoholic fatty liver disease: a systematic review. JAMA. 2015;313(22):2263–2273. doi: 10.1001/jama.2015.5370. - DOI - PubMed
    1. Brandl K, Schnabl B. Intestinal microbiota and nonalcoholic steatohepatitis. Curr Opin Gastroenterol. 2017;33(3):128–133. doi: 10.1097/MOG.0000000000000349. - DOI - PMC - PubMed
    1. Hoyles L, Fernandez-Real JM, Federici M, Serino M, Abbott J, Charpentier J, Heymes C, Luque JL, Anthony E, Barton RH, Chilloux J, Myridakis A, Martinez-Gili L, Moreno-Navarrete JM, Benhamed F, Azalbert V, Blasco-Baque V, Puig J, Xifra G, Ricart W, Tomlinson C, Woodbridge M, Cardellini M, Davato F, Cardolini I, Porzio O, Gentileschi P, Lopez F, Foufelle F, Butcher SA, Holmes E, Nicholson JK, Postic C, Burcelin R, Dumas ME. Molecular phenomics and metagenomics of hepatic steatosis in non-diabetic obese women. Nat Med. 2018;24(7):1070–1080. doi: 10.1038/s41591-018-0061-3. - DOI - PMC - PubMed
    1. Denou E, Lolmede K, Garidou L, Pomie C, Chabo C, Lau TC, Fullerton MD, Nigro G, Zakaroff-Girard A, Luche E, Garret C, Serino M, Amar J, Courtney M, Cavallari JF, Henriksbo BD, Barra NG, Foley KP, McPhee JB, Duggan BM, O’Neill HM, Lee AJ, Sansonetti P, Ashkar AA, Khan WI, Surette MG, Bouloumie A, Steinberg GR, Burcelin R, Schertzer JD. Defective NOD2 peptidoglycan sensing promotes diet-induced inflammation, dysbiosis, and insulin resistance. EMBO Mol Med. 2015;7(3):259–274. doi: 10.15252/emmm.201404169. - DOI - PMC - PubMed

Publication types