

Associations of socioeconomic status with infectious diseases mediated by lifestyle, environmental pollution and chronic comorbidities: a comprehensive evaluation based on UK Biobank
- PMID: 36717939
- PMCID: PMC9885698
- DOI: 10.1186/s40249-023-01056-5
Associations of socioeconomic status with infectious diseases mediated by lifestyle, environmental pollution and chronic comorbidities: a comprehensive evaluation based on UK Biobank
Abstract
Background: Socioeconomic status (SES) inequity was recognized as a driver of some certain infectious diseases. However, few studies evaluated the association between SES and the burden of overall infections, and even fewer identified preventable mediators. This study aimed to assess the association between SES and overall infectious diseases burden, and the potential roles of factors including lifestyle, environmental pollution, chronic disease history.
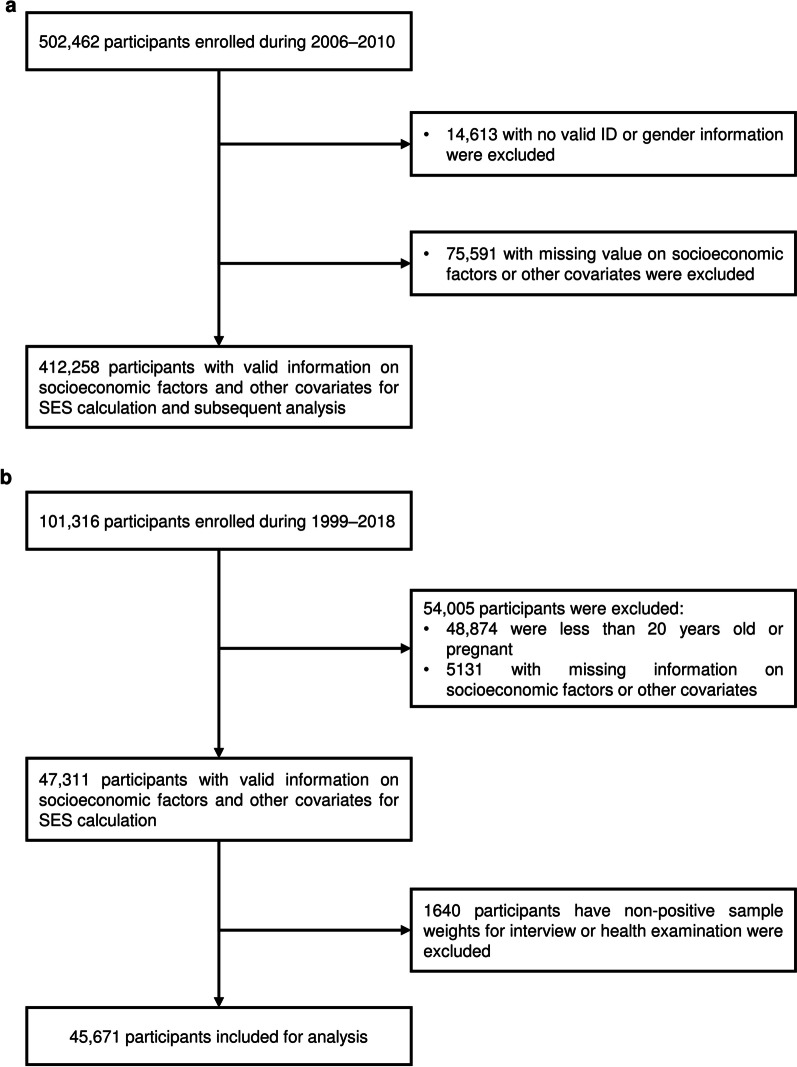
Methods: We included 401,009 participants from the UK Biobank (UKB) and defined the infection status for each participant according to their diagnosis records. Latent class analysis (LCA) was used to define SES for each participant. We further defined healthy lifestyle score, environment pollution score (EPS) and four types of chronic comorbidities. We used multivariate logistic regression to test the associations between the four above covariates and infectious diseases. Then, we performed the mediation and interaction analysis to explain the relationships between SES and other variables on infectious diseases. Finally, we employed seven types of sensitivity analyses, including considering the Townsend deprivation index as an area level SES variable, repeating our main analysis for some individual or composite factors and in some subgroups, as well as in an external data from the US National Health and Nutrition Examination Survey, to verify the main results.
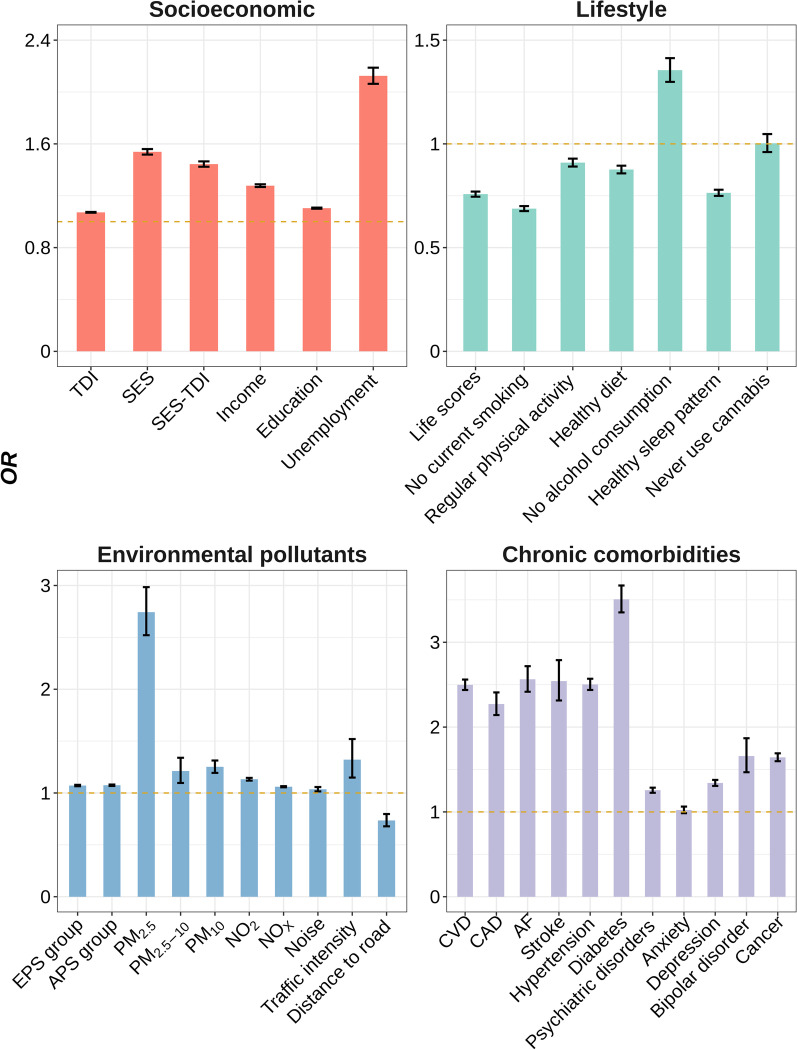
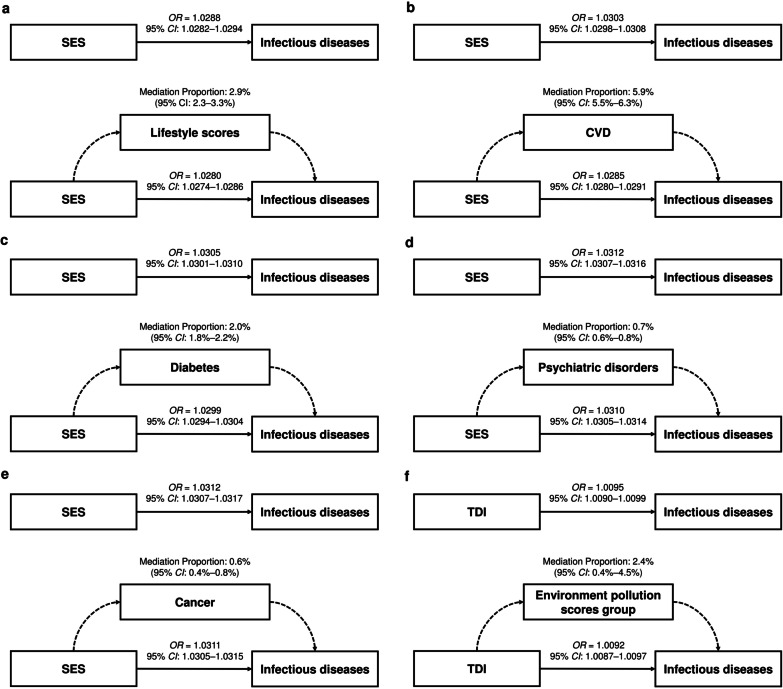
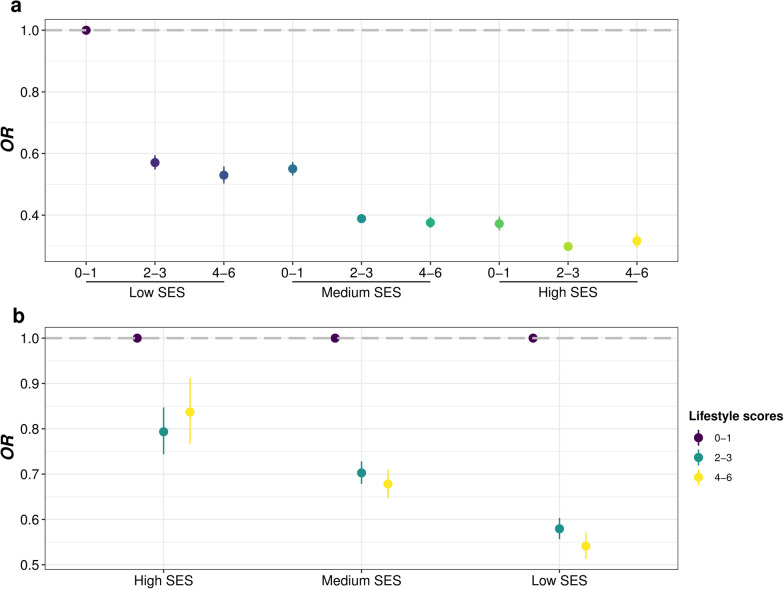
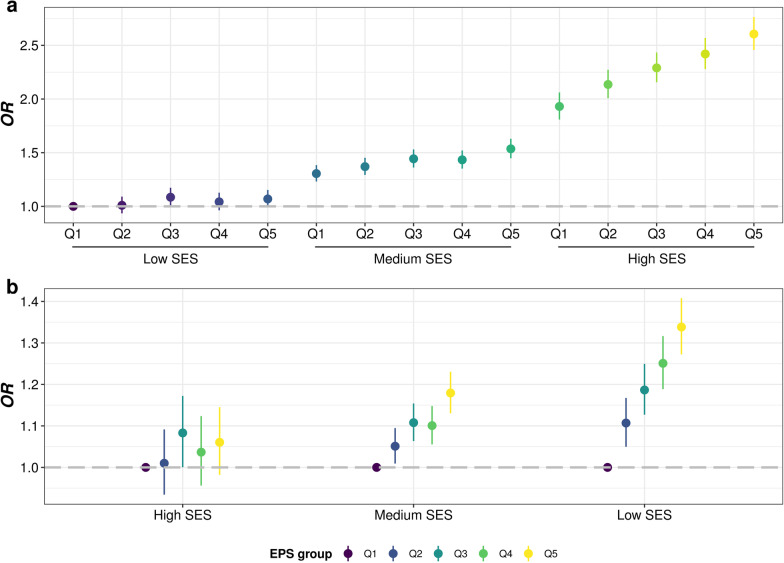
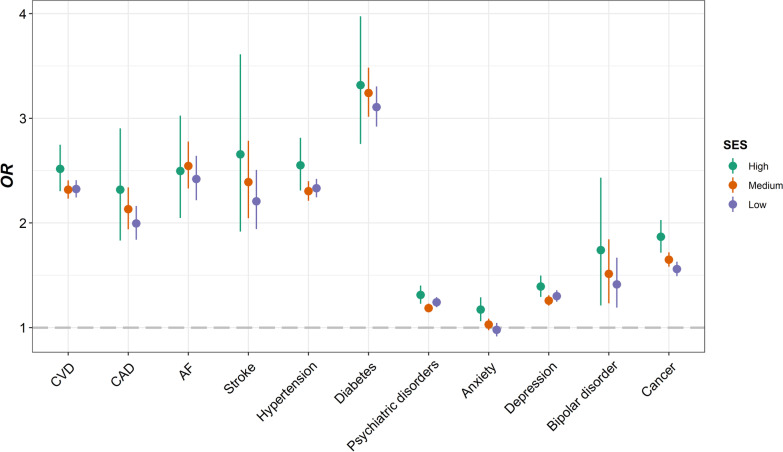
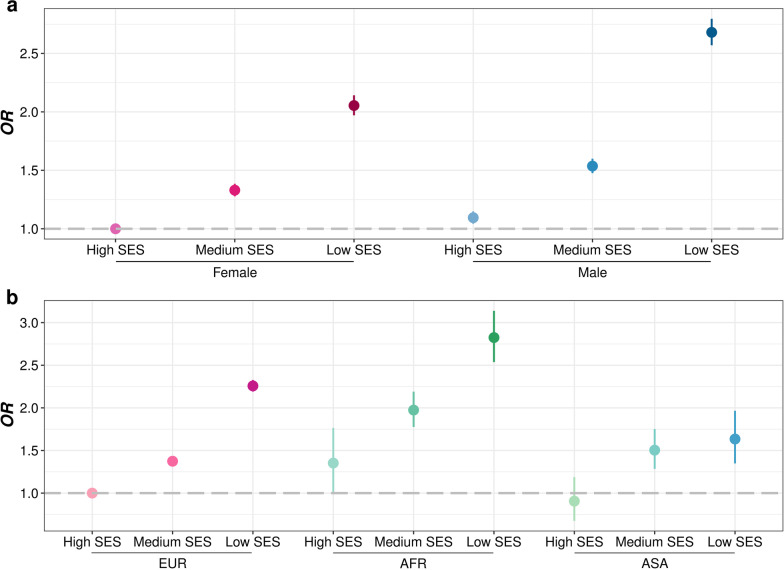
Results: In UKB, 60,771 (15.2%) participants were diagnosed with infectious diseases during follow-up. Lower SES [odds ratio (OR) = 1.5570] were associated with higher risk of overall infections. Lifestyle score mediated 2.9% of effects from SES, which ranged from 2.9 to 4.0% in different infection subtypes, while cardiovascular disease (CVD) mediated a proportion of 6.2% with a range from 2.1 to 6.8%. In addition, SES showed significant negative interaction with lifestyle score (OR = 0.8650) and a history of cancer (OR = 0.9096), while a significant synergy interaction was observed between SES and EPS (OR = 1.0024). In subgroup analysis, we found that males and African (AFR) with lower SES showed much higher infection risk. Results from sensitivity and validation analyses showed relative consistent with the main analysis.
Conclusions: Low SES is shown to be an important risk factor for infectious disease, part of which may be mediated by poor lifestyle and chronic comorbidities. Efforts to enhance health education and improve the quality of living environment may help reduce burden of infectious disease, especially for people with low SES.
Keywords: Chronic comorbidities; Environmental pollution; Healthy lifestyle; Infectious diseases; Socioeconomic status.
© 2023. The Author(s).
Conflict of interest statement
The authors declare no competing interests.
Figures
Similar articles
-
Associations of healthy lifestyle and socioeconomic status with mortality and incident cardiovascular disease: two prospective cohort studies.BMJ. 2021 Apr 14;373:n604. doi: 10.1136/bmj.n604. BMJ. 2021. PMID: 33853828 Free PMC article.
-
Folic acid supplementation and malaria susceptibility and severity among people taking antifolate antimalarial drugs in endemic areas.Cochrane Database Syst Rev. 2022 Feb 1;2(2022):CD014217. doi: 10.1002/14651858.CD014217. Cochrane Database Syst Rev. 2022. PMID: 36321557 Free PMC article.
-
Individual and area-level socioeconomic status, Life's Simple 7, and comorbid cardiovascular disease and cancer: a prospective analysis of the UK Biobank cohort.Public Health. 2024 Sep;234:178-186. doi: 10.1016/j.puhe.2024.06.028. Epub 2024 Jul 17. Public Health. 2024. PMID: 39024928
-
The association between a lifestyle score, socioeconomic status, and COVID-19 outcomes within the UK Biobank cohort.BMC Infect Dis. 2022 Mar 30;22(1):273. doi: 10.1186/s12879-022-07132-9. BMC Infect Dis. 2022. PMID: 35351028 Free PMC article.
-
The influence of socioeconomic status on the association between unhealthy lifestyle factors and adverse health outcomes: a systematic review.Wellcome Open Res. 2023 Dec 8;8:55. doi: 10.12688/wellcomeopenres.18708.2. eCollection 2023. Wellcome Open Res. 2023. PMID: 38533439 Free PMC article.
Cited by
-
Association of modifiable risk factors and infectious diseases among individuals with hypertension: a prospective cohort study.BMC Infect Dis. 2024 Oct 15;24(1):1162. doi: 10.1186/s12879-024-10064-1. BMC Infect Dis. 2024. PMID: 39407144 Free PMC article.
-
Knowledge and awareness of breast cancer signs and symptoms among Jordanian women.Future Sci OA. 2025 Dec;11(1):2510871. doi: 10.1080/20565623.2025.2510871. Epub 2025 May 28. Future Sci OA. 2025. PMID: 40435211 Free PMC article.
-
Associations of diet with infectious diseases in UK Biobank.J Biomed Res. 2024 May 29;38(6):597-612. doi: 10.7555/JBR.37.20230319. J Biomed Res. 2024. PMID: 38807412 Free PMC article.
-
Association between individual, household, and area-level socioeconomic status indicators with anthropometric indexes.Prev Med Rep. 2025 Mar 19;53:103036. doi: 10.1016/j.pmedr.2025.103036. eCollection 2025 May. Prev Med Rep. 2025. PMID: 40206845 Free PMC article.
-
Investigating the Sexual Dimorphism of Waist-to-Hip Ratio and Its Associations with Complex Traits.Genes (Basel). 2025 Jun 16;16(6):711. doi: 10.3390/genes16060711. Genes (Basel). 2025. PMID: 40565603 Free PMC article.
References
-
- Tetzlaff F, Epping J, Sperlich S, Tetzlaff J. Widening income inequalities in life expectancy? Analysing time trends based on German health insurance data. J Epidemiol Community Health. 2020;74(7):592–597. - PubMed
-
- Dickman SL, Himmelstein DU, Woolhandler S. Inequality and the health-care system in the USA. Lancet. 2017;389(10077):1431–1441. - PubMed
-
- Lago-Peñas S, Rivera B, Cantarero D, Casal B, Pascual M, Blázquez-Fernández C, et al. The impact of socioeconomic position on non-communicable diseases: what do we know about it? Perspect Public Health. 2021;141(3):158–176. - PubMed
MeSH terms
Grants and funding
LinkOut - more resources
Full Text Sources
Medical
Research Materials
