. 2023 Jan 9;164(3):bqad017.
doi: 10.1210/endocr/bqad017.

Follistatin Forms a Stable Complex With Inhibin A That Does Not Interfere With Activin A Antagonism

Affiliations

Follistatin Forms a Stable Complex With Inhibin A That Does Not Interfere With Activin A Antagonism

Emily C Kappes et al. Endocrinology. .

Abstract

Inhibins are transforming growth factor-β family heterodimers that suppress follicle-stimulating hormone (FSH) secretion by antagonizing activin class ligands. Inhibins share a common β chain with activin ligands. Follistatin is another activin antagonist, known to bind the common β chain of both activins and inhibins. In this study, we characterized the antagonist-antagonist complex of inhibin A and follistatin to determine if their interaction impacted activin A antagonism. We isolated the inhibin A:follistatin 288 complex, showing that it forms in a 1:1 stoichiometric ratio, different from previously reported homodimeric ligand:follistatin complexes, which bind in a 1:2 ratio. Small angle X-ray scattering coupled with modeling provided a low-resolution structure of inhibin A in complex with follistatin 288. Inhibin binds follistatin via the shared activin β chain, leaving the α chain free and flexible. The inhibin A:follistatin 288 complex was also shown to bind heparin with lower affinity than follistatin 288 alone or in complex with activin A. Characterizing the inhibin A:follistatin 288 complex in an activin-responsive luciferase assay and by surface plasmon resonance indicated that the inhibitor complex readily dissociated upon binding type II receptor activin receptor type IIb, allowing both antagonists to inhibit activin signaling. Additionally, injection of the complex in ovariectomized female mice did not alter inhibin A suppression of FSH. Taken together, this study shows that while follistatin binds to inhibin A with a substochiometric ratio relative to the activin homodimer, the complex can dissociate readily, allowing both proteins to effectively antagonize activin signaling.

Keywords: activin antagonism; antagonist complex; follistatin; heterodimer; inhibin.


Figures

Figure 1.
Figure 1.
(A) Schematic of activin ligand signal propagation through type II and type I serine/threonine kinase receptors. Follistatin antagonizes activin signaling by binding and surrounding the activin ligand, preventing receptor access. (B) SPR binding analysis of follistatin interactions using ligand-bound chips comparing InhA (red) to activin A (blue). SPR kinetic analysis and fit data (n = 2). Average values reported. (C) Size exclusion chromatography traces of InhA (red), Fst (dashed gray), InhA:Fst288 (black), and 1:2 InhA:Fst288 excess Fst (orange). The starting material prior to mixing of both proteins is shown via western blot using antibodies specific to InhA (left) and Fst (right). Sizing standards are marked at the top of the ultraviolet traces. Gel fractions of the complex peak are marked with a horizontal line. (D) SDS-PAGE of InhA, Fst288, and InhA:Fst288 pooled from the SEC peak run under nonreducing conditions. InhA is 31-34 kDa, and Fst is 34-38 kDa.
Figure 2.
Figure 2.
(A) Continuous sedimentation coefficient distributions obtained from InhA (red), Fst288 (gray), ActA (blue), and InhA:Fst288 or ActA:Fst288 complexes (black) by sedimentation velocity analytical ultracentrifugation. (B) Dimensionless Kratky plot of data collected via in-line SEC SAXS of InhA:Fst288 (red) and ActA:Fst288 (blue). Arrow denotes a shallower decline of the bell-shaped curve of InhA:Fst288 compared to ActA:Fst288. (C) Schematic and cartoon representation models of InhA in complex with 1 or 2 Fst288 molecules. InhA α chain and the β chain are labeled accordingly. The β chain and Fst288 are from the previously solved structure of ActA:Fst288 (PDB: 2B0U). The α chain was generated using AlphaFold. (D) Comparison of fits of the 2 proposed InhA:Fst288 models to the experimental SAXS data using the FoXS server, generating a goodness of fit score (χ2) for each model. Abbreviations: ActA, activin A; Fst288, follistatin 288; InhA, inhibin A; SAXS, small-angle X-ray scattering; SEC, size-exclusion chromatography.
Figure 3.
Figure 3.
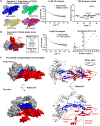
(A) Approach 1 for InhA:Fst288 model improvement utilized previously solved TGF-β ligand structures to place the α chain in a range of open to closed conformations with respect to the β chain. Activin A bound to Fst288 (PDB: 2B0U) was aligned to known TGF-β ligand structures (Supp. Fig. 4) (56). The second βA chain and Fst288 molecule were removed and the α chain model was aligned with the other “wing” of the TGF-β ligand. Each model was fitted to the experimental SAXS intensity data using the FoXS server and the summary is plotted on the right-hand graph. The center graph shows the best fit (TGFβ2) obtained with this approach. (B) Approach 2 for InhA:Fst288 model improvement utilized the command prompt in PyMOL (41) to rotate the α chain along the Z axis in 10-degree increments to determine the best placement of the α chain. The models were fitted to the experimental SAXS data as previously described, and the summary is plotted on the right-hand graph with the best fit (−40°) shown in the center graph. (C) Front and top view of the finalized InhA:Fst288 model seen as a surface representation model and a cartoon structure model with a final χ2 score of 2.26. Abbreviations: Fst288, follistatin 288; InhA, inhibin A; SAXS, small-angle X-ray scattering; TGF-β, transforming growth factor beta.
Figure 4.
Figure 4.
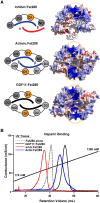
(A) Top-down schematics of each ligand-follistatin complex are shown as a reference to the surface representation of the APBS electrostatics map of each complex. The positive charge is denoted in blue, the negative charge in red, and the hydrophobic charge in white. Ligand complexes were colored on a scale of −5.0 to 5.0 kbT/ec. InhA does not appear to add to the positively charged surface required to bind heparin. The heparin-binding site (D1) is circled in orange. (B) Follistatin alone and follistatin-bound ligands were bound to a heparin column and eluted with a salt gradient, which is labeled along the line. ActA and GDF11 increased overall complex heparin affinity. InhA appeared to decrease retention time, thus decreasing the heparin affinity of the InhA:Fst288 complex.
Figure 5.
Figure 5.
(A) Schematic of the ActA (Smad 2/3) reporter assay set-up including A3CAT luciferase promoter and transcription factor FAST2. (B) Representative inhibition curves of InhA, Fst288, and InhA:Fst288 without coreceptor betaglycan present. Data are signal fold over background from 2-fold serial dilutions of antagonist (pM) plotted as log(M) concentrations. Error bars indicate the SD of the fold over background for each antagonist concentration. Data represent the average of at least 3 independent experiments performed in triplicate per plate. (C) Representative inhibition curves for antagonists in the presence of betaglycan. Values are reported in Table 2. The null hypothesis was that the LOGIC50 is the same for all data sets (Table 3) with the resultant P-value of 0.0026 (InhA:Fst288 IC50 58 pM). (D) Adult C57BL/6 female mice were ovariectomized and subsequently intravenously treated with PBS, Fst288, InhA, or the Fst288:InhA complex. Blood was collected before and 6 and 24 hours post-injection for measurement of serum FSH.
Figure 6.
Figure 6.
(A) SPR binding studies comparing type II receptor (ActRIIB-Fc) binding affinity for InhA and ActA (n = 2). (B) SPR binding studies comparing type II receptor (ActRIIB-Fc) binding affinity for InhA:Fst288 in red and ActA:Fst288 in blue (n = 2). The highest ligand concentration is 62.5 nM serially diluted 2-fold for 7 concentration points. Data are reported in Table 4.
Figure 7.
Figure 7.
Proposed mechanism incorporating Fst into the known InhA mechanism of action. (I) InhA:Fst288 localizes to the cell surface where the antagonists separate and act to inhibit activin signaling in a 2-step manner. (II) InhA antagonizes ActA by binding and sequestering type II receptors. (III) Fst antagonizes extracellular ActA by binding to each side of the ligand, occupying the receptor sites, blocking receptor access, thus decreasing ActA activity. (IV) With the assistance of coreceptor betaglycan, InhA outcompetes ActA for type II receptors, forming a nonsignaling complex, resulting in decreased ActA activity.

References

    1. Galat A. Common structural traits for cystine knot domain of the TGFβ superfamily of proteins and three-fingered ectodomain of their cellular receptors. Cell Mol Life Sci. 2011;68(20):3437–3451. 10.1007/s00018-011-0643-4 - DOI - PMC - PubMed
    1. MacFarlane EG, Haupt J, Dietz HC, Shore EM. TGF-β family signaling in connective tissue and skeletal diseases. Cold Spring Harb Perspect Biol. 2017;9(11):a022269. 10.1101/cshperspect.a022269 - DOI - PMC - PubMed
    1. Hinck AP, Mueller TD, Springer TA. Structural biology and evolution of the TGF-β family. Cold Spring Harb Perspect Biol. 2016;8(12):a022103. 10.1101/cshperspect.a022103 - DOI - PMC - PubMed
    1. Cash JN, Rejon CA, McPherron AC, Bernard DJ, Thompson TB. The structure of myostatin:follistatin 288: insights into receptor utilization and heparin binding. EMBO J. 2009;28(17):2662–2676. 10.1038/emboj.2009.205 - DOI - PMC - PubMed
    1. Goebel EJ, Corpina RA, Hinck CS, et al. . Structural characterization of an activin class ternary receptor complex reveals a third paradigm for receptor specificity. Proc Natl Acad Sci U S A. 2019;116(31):15505–15513. 10.1073/pnas.1906253116 - DOI - PMC - PubMed

Publication types