Review
. 2022 Nov 23;3(1):1-16.
doi: 10.1021/acsphyschemau.2c00050. eCollection 2023 Jan 25.

Multiple Facets of Modeling Electronic Absorption Spectra of Systems in Solution

Affiliations
Review

Multiple Facets of Modeling Electronic Absorption Spectra of Systems in Solution

Sara Gómez et al. ACS Phys Chem Au. .

Abstract

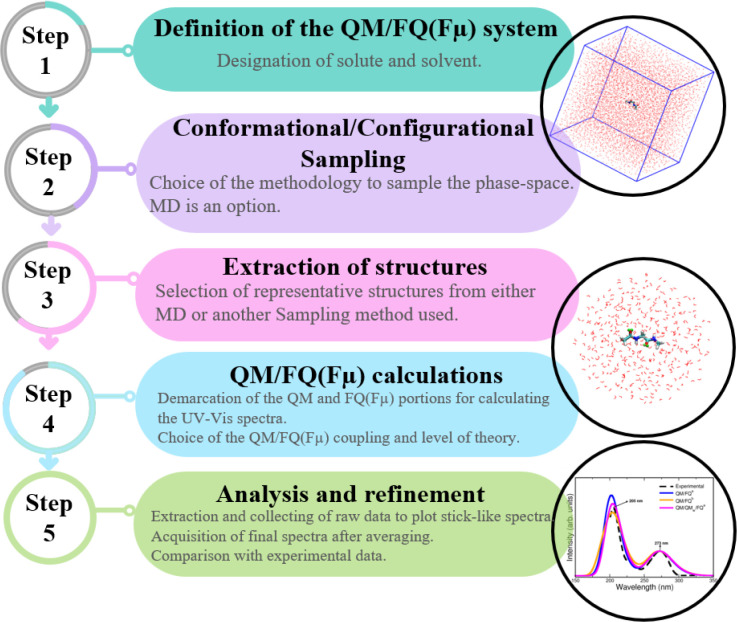
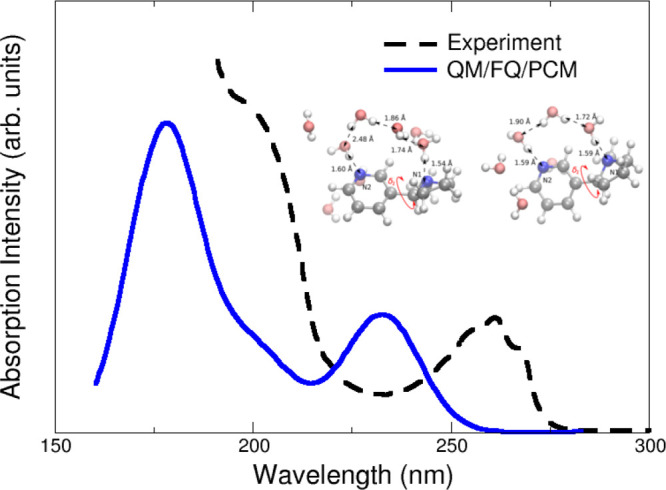
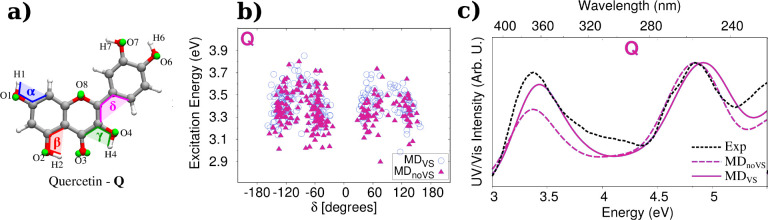
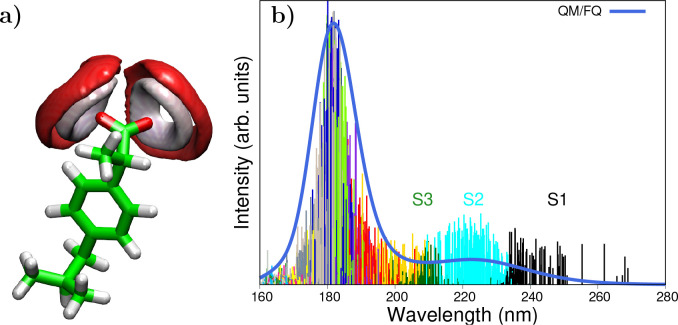
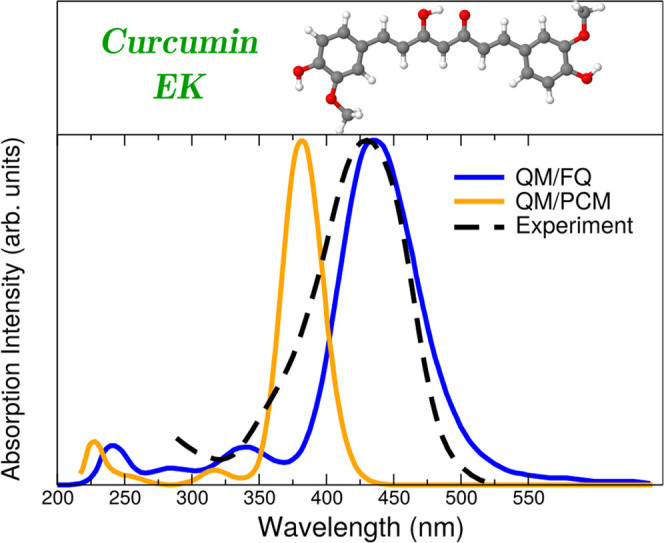
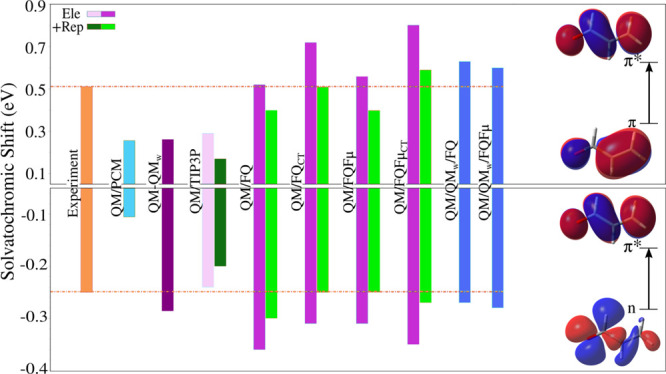
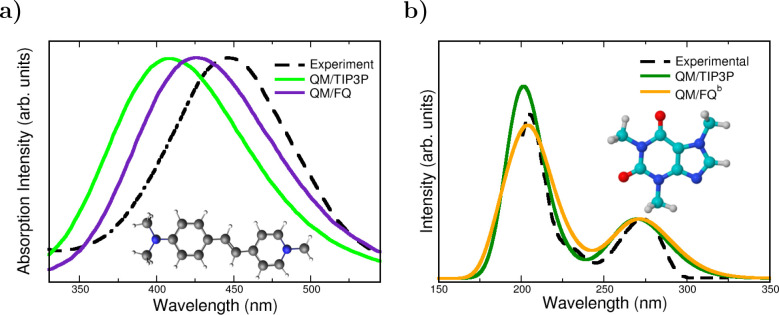
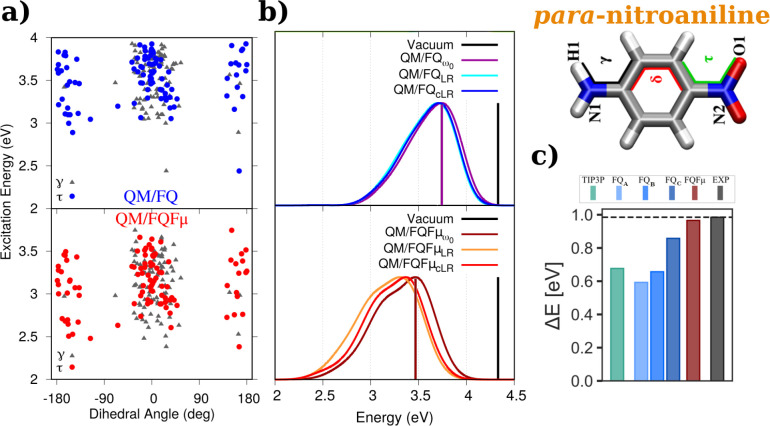
In this Perspective, we outline the essential physicochemical aspects that need to be considered when building a reliable approach to describe absorption properties of solvated systems. In particular, we focus on how to properly model the complexity of the solvation phenomenon, arising from dynamical aspects and specific, strong solute-solvent interactions. To this end, conformational and configurational sampling techniques, such as Molecular Dynamics, have to be coupled to accurate fully atomistic Quantum Mechanical/Molecular Mechanics (QM/MM) methodologies. By exploiting different illustrative applications, we show that an effective reproduction of experimental spectral signals can be achieved by delicately balancing exhaustive sampling, hydrogen bonding, mutual polarization, and nonelectrostatic effects.


Conflict of interest statement

The authors declare no competing financial interest.

Figures

Figure 1
Figure 1
Flowchart of the computational protocol followed in the simulation of absorption spectra.
Figure 2
Figure 2
Calculated QM/FQ/PCM absorption spectra of nicotine in aqueous solution. The experimental spectrum (black) taken from ref (58) is given for comparison. Nicotine was freely allowed to move during MD simulations. QM level: CAM-B3LYP/aug-cc-pVDZ. Image adapted from ref (58). Copyright 2015 American Chemical Society.
Figure 3
Figure 3
(a) Definition of dihedral angles and oxygen virtual sites of quercetin. (b) QM/FQ excitation energies of the first electronic transition of quercetin in water as a function of its δ dihedral angle. (c) Experimental and computed absorption spectra as calculated with QM/FQ when coupled to both MDVS and MDnoVS. Quercetin was freely allowed to move during MD simulations. QM level: B3LYP/6-311+G(d, p). Images adapted with permission under a Creative Commons CC BY License from ref (64). Copyright 2020 MDPI.
Figure 4
Figure 4
(a) Spatial distribution function of water oxygen (red) and hydrogen (white) atoms around ibuprofen. (b) Sticks and convoluted QM/FQ UV–vis absorption spectrum of anionic Ibuprofen in aqueous solution. Colored sticks stand for different excited states, from which S1, S2, and S3 are labeled. Ibuprofen was freely allowed to move during MD simulations. QM level: CAM-B3LYP/6-311++G(d, p). Images adapted with permission under a Creative Commons CC BY License from ref (67). Copyright 2022 MDPI.
Figure 5
Figure 5
Simulated QM/FQ and QM/PCM absorption spectra for the enol–keto (EK) tautomer of curcumin in aqueous solution. Curcumin was freely allowed to move during MD simulations. QM level: M06-2X/def2-TZVP. Experimental data taken from ref (99). Image reproduced and adapted with permission from ref (63). Copyright 2019 Royal Society of Chemistry.
Figure 6
Figure 6
Computed and experimental π → π* (top) and n → π* (bottom) vacuo-to-water solvatochromic shifts of acrolein. Acrolein was freely allowed to move during MD simulations. QM level: CAM-B3LYP/aug-cc-pVDZ. To get a better picture, experimental values taken from ref (101) extend along the whole results. Orbitals involved in both transitions are also included. Image adapted from ref (14). Copyright 2019 American Chemical Society.
Figure 7
Figure 7
QM/TIP3P, QM/FQ, and experimental UV–vis spectra of (a) pyridinium dye and (b) caffeine in aqueous solution. Experimental spectra from refs (105) and (106). The pyridinium dye was rigid whereas Caffeine was freely allowed to move during MD simulations. QM level: CAM-B3LYP/6-311++G(d, p) and B3LYP/6-311++G(d, p) for pyridinium dye and caffeine, respectively. Image (a) reproduced and adapted from ref (55). Copyright 2019 John Wiley & Sons publications. Image (b) reproduced and adapted with permission from ref (56). Copyright 2020 Royal Society of Chemistry.
Figure 8
Figure 8
QM/FQ (top) and QM/FQFμ (bottom) (a) cLR excitation energies of PNA in aqueous solution as a function of selected dihedral angles and (b) ω0, LR, and cLR spectra. Vertical bars mark the position of excitation energies in vacuum and those obtained with ω0, i.e., the frozen density approximation. c) PNA vacuo-to-water solvatochromic shifts, ΔE = EsolvEvac, in water computed with QM/EE and different QM/FQ parametrizations. PNA was freely allowed to move during MD simulations. QM level: CAM-B3LYP/aug-cc-pVDZ and CAMY-B3LYP/TZ2P. Images (a) and (b) reproduced and adapted from ref (13), with the permission of AIP Publishing, Copyright 2019 AIP Publishing. Image (c) reproduced and adapted with permission under a Creative Commons Attribution 4.0 International (CC BY 4.0) from ref (54). Copyright 2022 arXiv.
Figure 9
Figure 9
(a) Picture of one of the molecular orbitals involved in the UV–vis transitions of NO2 in water, obtained with the QM/QMw/FQ approach. FQ water molecules are omitted. (b) Distribution of DCT indices computed with QM/FQ and QM/QMw/FQ on 200 snapshots extracted from MD trajectories of solvated NO2. Twelve excited states are taken into account in each snapshot. NO2 was freely allowed to move during MD simulations. QM level: CAM-B3LYP/6-311++G(d, p). Numerical results are taken from ref (65).
Figure 10
Figure 10
Top panel: QM/EE, QM/FQ, and experimental PNA excitation energies as a function of the solvent polarity. Bottom panel: solvatochromic shifts in diverse solvents, computed with respect to gas-phase. PNA was kept frozen in its minimum energy structure during MD simulations. QM level: CAM-B3LYP/aug-cc-pVDZ. Image adapted from ref (42). Copyright 2021 American Chemical Society.

References

    1. Giovannini T.; Egidi F.; Cappelli C. Molecular spectroscopy of aqueous solutions: a theoretical perspective. Chem. Soc. Rev. 2020, 49, 5664–5677. 10.1039/C9CS00464E. - DOI - PubMed
    1. Morzan U. N.; Alonso de Armino D. J.; Foglia N. O.; Ramirez F.; Gonzalez Lebrero M. C.; Scherlis D. A.; Estrin D. A. Spectroscopy in complex environments from QM–MM simulations. Chem. Rev. 2018, 118, 4071–4113. 10.1021/acs.chemrev.8b00026. - DOI - PubMed
    1. Tomasi J.; Mennucci B.; Cammi R. Quantum mechanical continuum solvation models. Chem. Rev. 2005, 105, 2999–3094. 10.1021/cr9904009. - DOI - PubMed
    1. Provorse M. R.; Peev T.; Xiong C.; Isborn C. M. Convergence of excitation energies in mixed quantum and classical solvent: Comparison of continuum and point charge models. J. Phys. Chem. B 2016, 120, 12148–12159. 10.1021/acs.jpcb.6b09176. - DOI - PubMed
    1. Marenich A. V.; Cramer C. J.; Truhlar D. G. Sorting out the relative contributions of electrostatic polarization, dispersion, and hydrogen bonding to solvatochromic shifts on vertical electronic excitation energies. J. Chem. Theory Comput. 2010, 6, 2829–2844. 10.1021/ct100267s. - DOI - PubMed