. 2023 Jan 7;26(2):105938.
doi: 10.1016/j.isci.2023.105938. eCollection 2023 Feb 17.

CAMSAP2 localizes to the Golgi in islet β-cells and facilitates Golgi-ER trafficking

Affiliations

CAMSAP2 localizes to the Golgi in islet β-cells and facilitates Golgi-ER trafficking

Kung-Hsien Ho et al. iScience. .

Abstract

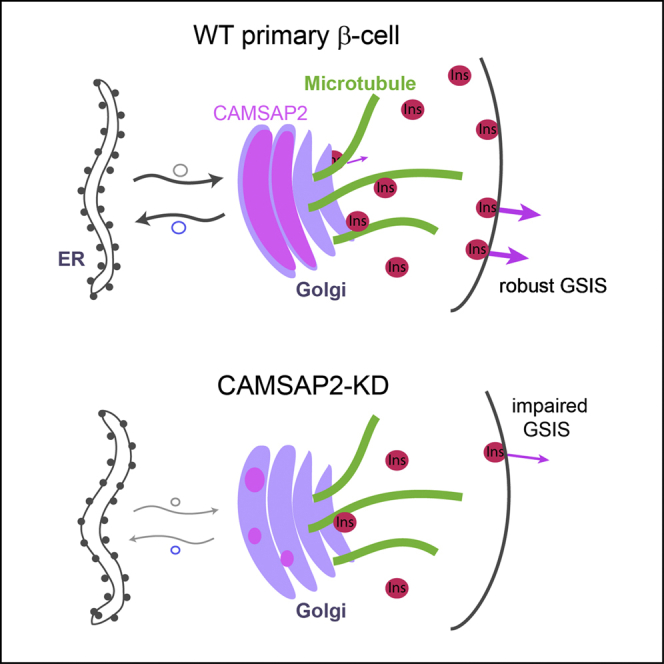
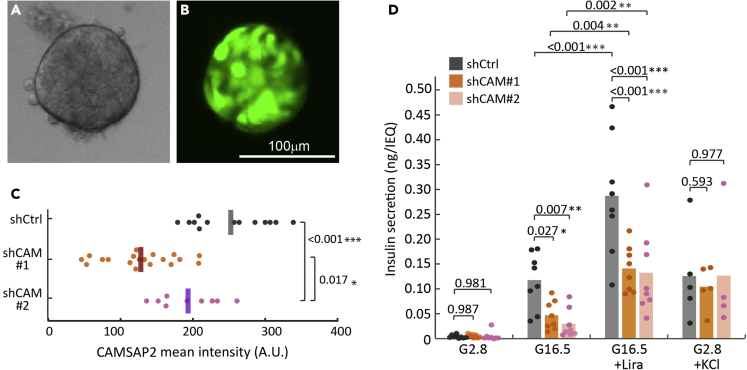
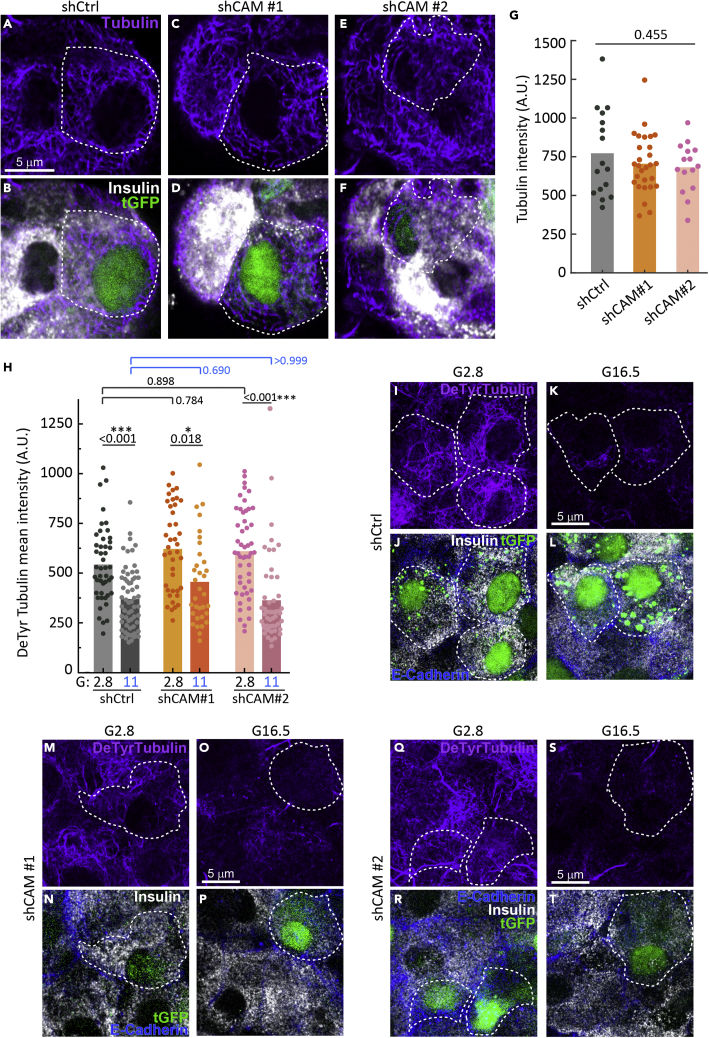
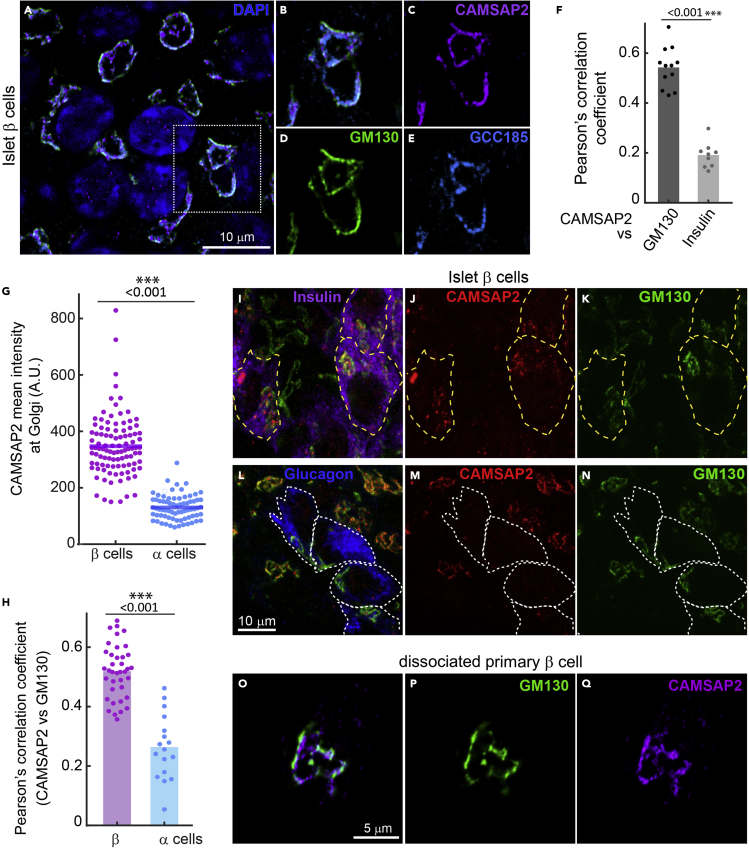
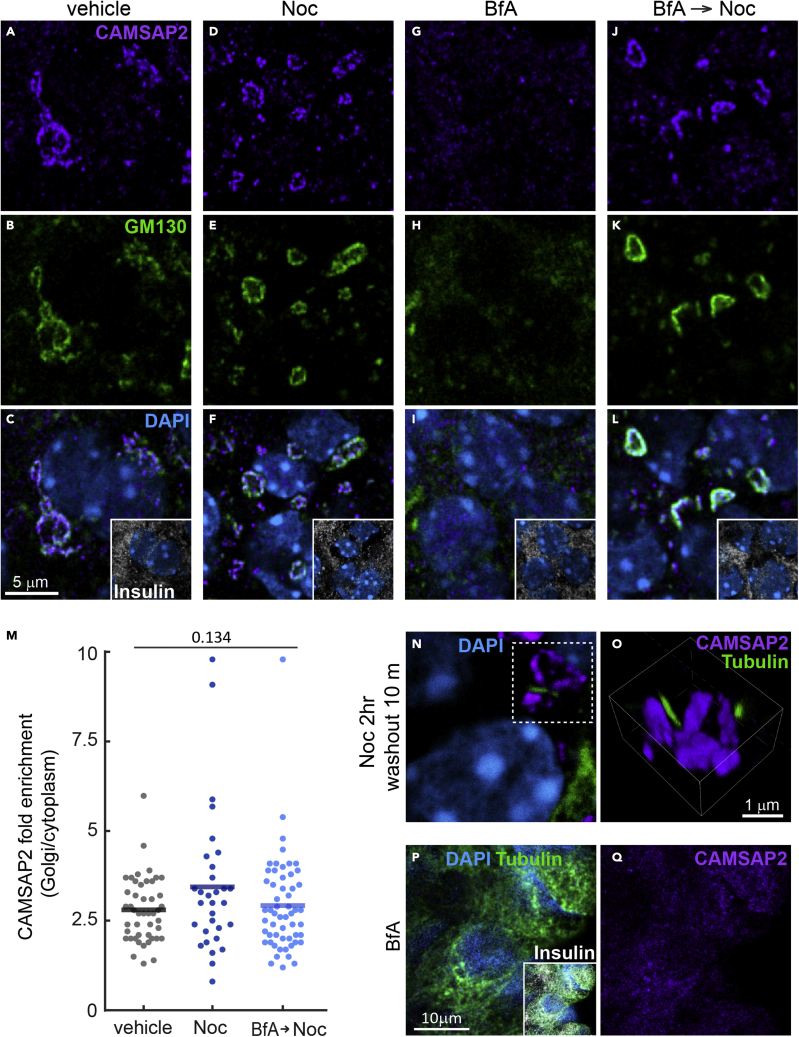
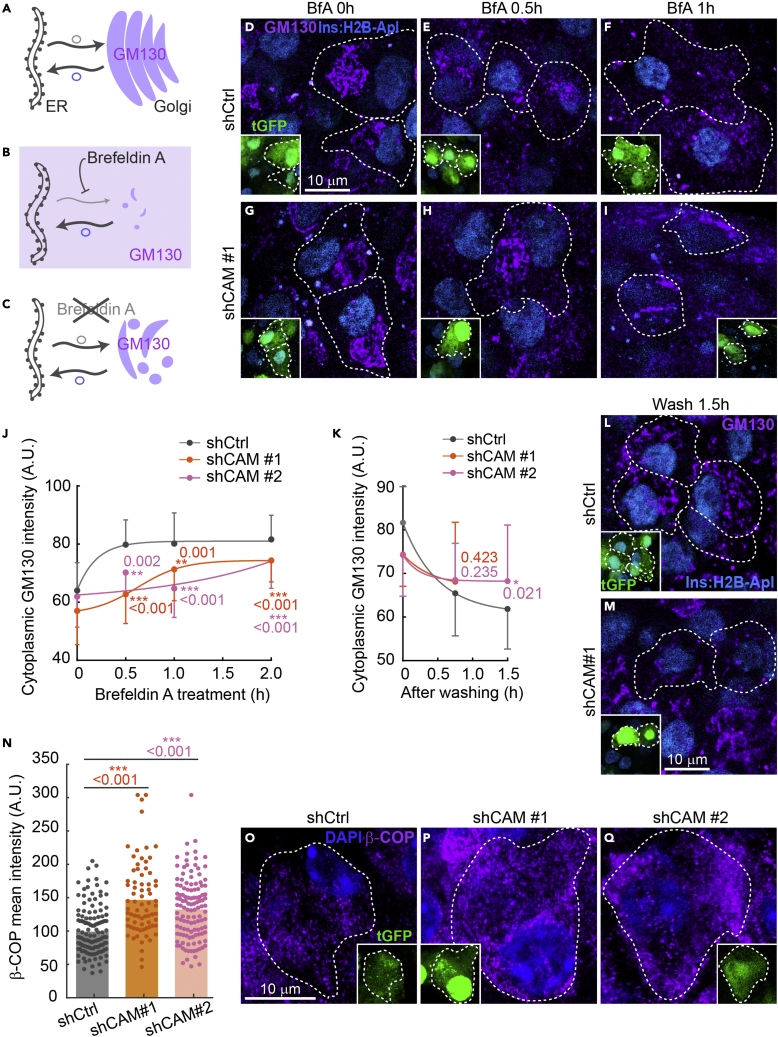
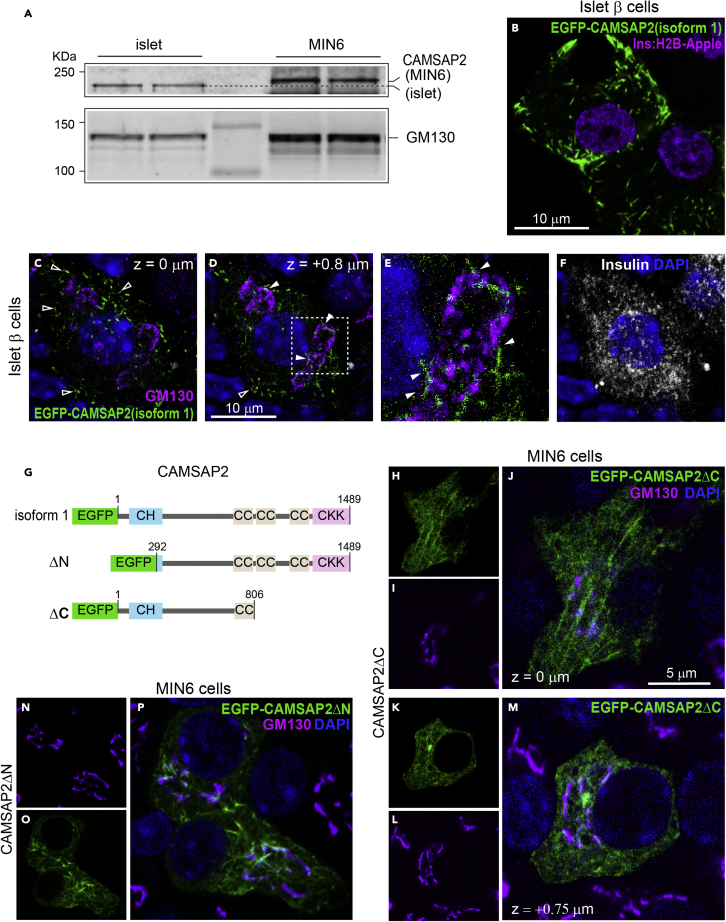
Glucose stimulation induces the remodeling of microtubules, which potentiates insulin secretion in pancreatic β-cells. CAMSAP2 binds to microtubule minus ends to stabilize microtubules in several cultured clonal cells. Here, we report that the knockdown of CAMSAP2 in primary β-cells reduces total insulin content and attenuates GSIS without affecting the releasability of insulin vesicles. Surprisingly, CAMSAP2 knockdown does not change microtubule stability. Unlike in cultured insulinoma cells, CAMSAP2 in primary β-cells predominantly localizes to the Golgi apparatus instead of microtubule minus ends. This novel localization is specific to primary β- but not α-cells and is independent of microtubule binding. Consistent with its specific localization at the Golgi, CAMSAP2 promotes efficient Golgi-ER trafficking in primary β-cells. Moreover, primary β-cells and insulinoma cells likely express different CAMSAP2 isoforms. We propose that a novel CAMSAP2 isoform in primary β-cells has a non-canonical function, which promotes Golgi-ER trafficking to support efficient production of insulin and secretion.

Keywords: Biological sciences; Cell biology; Diabetology.


Conflict of interest statement

The authors declare no conflicts of interest.

Figures

None
Graphical abstract
Figure 1
Figure 1
Knockdown of CAMSAP2 in primary β-cells impairs glucose-stimulated insulin secretion but not cAMP- or potassium-stimulated secretion (A and B) Representative fluorescence images of a pseudoislet generated from dissociated islet cells transduced with lentivirus containing shRNA and a tGFP expression cassette. (C) Quantification of CAMSAP2 intensity of transduced primary β-cells in mouse islets. Dots represent individual β-cells. ∗p < 0.05, ∗∗∗p < 0.001 (Dunnett’s multiple comparisons test). (D) Insulin secretion of pseudoislets expressing non-targeting (shCtrl) or CAMSAP2-targeting (shCAM) shRNA, shown as ng insulin secretion per IEQ within a 45 or 30 minutes window. Dots represent individual wells containing multiple pseudoislets. Columns represent the average of three animals ∗p < 0.05, ∗∗p < 0.01, ∗∗∗p < 0.001 (multiple comparisons corrected by the false discovery rate of Benjamini and Hochberg). Pseudoislets were incubated in 2.8 glucose for 60 min, in 16.5 mM glucose with or without 100 nM Liraglutide for 45 min, or in 2.8 mM glucose plus 30 mM KCl for 30 min. Secretion was normalized by the total pseudoislet volume presented in IEQ (defined as 1,767,146 μm3).
Figure 2
Figure 2
Knockdown of CAMSAP2 does not alter the amount and dynamics of microtubules in primary β-cells (A-F) Immunofluorescence staining of tubulin (magenta) and insulin (white) in CAMSAP2-KD and control β-cells in mouse islets. Green, tGFP to indicate successful transduction. Dashed lines delineate transduced β-cells. (G) Quantification of tubulin immunofluorescence intensity of CAMSAP2-KD and control β-cells in mouse islets. A.U., Arbitrary unit. Islets were extracted with methanol, which removed cytosolic free tubulin and the measured tubulin intensity represents polymerized tubulin. Dots represent individual β-cells. Bars represent the average of three animals (Dunnett’s multiple comparisons test). (H) Quantification of detyrosinated tubulin immunofluorescence intensity in CAMSAP2-KD and control β-cells in mouse islets. Dots represent individual β-cells. Bars represent the average of three animals. ∗p < 0.05, ∗∗∗p < 0.001 (Dunnett’s multiple comparisons test). (I-T) Immunofluorescence staining of detyrosinated tubulin (magenta), E-Cadherin (blue), and insulin (white) in CAMSAP2-KD and control β-cells in mouse islets incubated in media containing 2.8 or 11 mM glucose. Green, tGFP to indicate successful transduction. Dashed lines delineate transduced β-cells.
Figure 3
Figure 3
CAMSAP2 localizes to the Golgi in primary β-cells (A-E) Immunofluorescence staining of GM130 (green), CAMSAP2 (magenta), and GCC185 (cyan) in primary β-cells in mouse islets. Blue, DAPI. (F) Pearson’s correlation coefficient of the immunofluorescence signal of CAMSAP2 with GM130 (dark gray) and CAMSAP2 with insulin (light gray). Dots represent individual images of mouse islets. Columns represent the average of three animals. ∗∗∗p < 0.01 (t-test). (G) Quantification of CAMSAP2 immunofluorescence intensity at the Golgi in mouse islets. Dots represent individual β-cells. Bars represent the average of three animals. ∗∗∗p < 0.001 (t test). A.U., Arbitrary unit. (H) Pearson’s correlation coefficient of the immunofluorescence signal of CAMSAP2 with GM130 in primary β- and α-cells in mouse islets. Dots represent individual islet cells. Columns represent the average of three animals. ∗∗∗p < 0.01 (t test). (I-N) Immunofluorescence staining of insulin (magenta), glucagon (blue), CAMSAP2 (red), and GM130 (green) in mouse islets. (O-Q) Immunofluorescence staining of GM130 (green) and CAMSAP2 (magenta) in primary β-cells dissociated from mouse islets and cultured for one day.
Figure 4
Figure 4
The localization of CAMSAP2 to the Golgi in primary β-cells is independent of binding to microtubules (A-L) Immunofluorescence staining of GM130 (green), CAMSAP2 (magenta), and insulin (white) in mouse islets treated with nocodazole (D-F), Brefeldin A [BfA] (G-I), or BfA and then removed BfA in the presence of nocodazole (J-L). Cyan, DAPI. (M) Quantification of CAMSAP2 immunofluorescence intensity at the Golgi over that in the cytosol in primary β-cells in mouse islets. Dots represent individual β-cells. Columns represent the average of three animals (One-way ANOVA). (N and O) Immunofluorescence staining of CAMSAP2 (magenta) and tubulin (green) in mouse islets. Islets treated with nocodazole were then incubated in media without nocodazole to allow microtubule growth. Panel O is a 3D reconstituted image of Golgi mini-stacks. Cyan, DAPI. (P and Q) Immunofluorescence staining of tubulin (green), CAMSAP2 (magenta), and insulin (white) in mouse islets treated with Brefeldin A. Cyan, DAPI.
Figure 5
Figure 5
Knockdown of CAMSAP2 impairs the ER-to-Golgi trafficking in primary islet β-cells (A-C) Schematic of the dynamics of the Golgi and GM130 (magenta) localization before (A), after Brefeldin A addition (B), and after its removal (C). (D-I) Immunofluorescence staining of GM130 (magenta) in Brefeldin A (BfA)-treated islets β-cells expressing shRNAs. Dashed lines delineate transduced cells. Cyan, Ins2 promoter-driven H2B-mApple to label β-cells in islets; Green, tGFP to indicate successful transduction. (J-K) Quantification of cytoplasmic GM130 immunofluorescence intensity of transduced β-cells in mouse islets treated with Brefeldin A (J) and after Brefeldin A removal (K). The average GM130 intensity of the entire cell was used to normalize data across different time points. Dots represent the average of three animals. Bars represent SD. ∗∗p < 0.01, ∗∗∗p < 0.001 (Dunnett’s multiple comparisons test). A.U., Arbitrary unit. (L and M) Immunofluorescence staining of GM130 (magenta) in BfA-treated islets β-cells expressing shRNAs incubated in media without BfA for 90 min. Dashed lines delineate transduced cells. Cyan, Ins2 promoter-driven H2B-mApple to label β-cells in islets; Green, tGFP to indicate successful transduction. (N) Quantification of β-COP immunofluorescence intensity of CAMSAP2-KD and control β-cells in mouse islets. Dots represent individual β-cells. Bars represent the average of three animals. ∗∗∗p < 0.001 (Dunnett’s multiple comparisons test). (O-Q) Immunofluorescence staining of β-COP (magenta) in islets β-cells expressing shRNAs. Dashed lines delineate transduced cells. Blue, DAPI; green, tGFP to indicate successful transduction.
Figure 6
Figure 6
Primary islet β-cells express a different CAMSAP2 isoform compared to MIN6 cells (A) Immunoblotting against CAMSAP2 and GM130 in lysates from islets and from MIN6. The dashed line indicates the position of CAMSAP2 from islet lysates. (B) A fluorescence image of ectopically expressed EGFP-CAMSAP2 (human CAMSAP2 isoform 1, green) in mouse islets. Magenta, Ins2 promoter-driven H2B-mApple to label β-cells in islets. (C-F) Immunofluorescence staining of GM130 (magenta) and insulin (white) in primary β-cells expressing EGFP-CAMSAP2 (human CAMSAP2 isoform 1, green) in mouse islets. Blue, DAPI. Open arrow heads, CAMSAP2 stretches in cell periphery; closed arrow heads, CAMSAP2 stretches associated with the Golgi. Panel C and D are at the same x-y position and 0.8 μm apart on the z axis. (G) Schematic of the tested EGFP fusions of full-length or truncated CAMSAP2. (H-P) Immunofluorescence images of GM130 (magenta) in MIN6 cells ectopically expressed truncated EGFP-CAMSAP2 (green). Blue, DAPI. Panel H-J and K-L are confocal images of the same cells at focal planes 0.75 μm apart on the z axis.

References

    1. Ashcroft F.M., Harrison D.E., Ashcroft S.J. Glucose induces closure of single potassium channels in isolated rat pancreatic beta-cells. Nature. 1984;312:446–448. doi: 10.1038/312446a0. - DOI - PubMed
    1. Cook D.L., Hales C.N. Intracellular ATP directly blocks K+ channels in pancreatic B-cells. Nature. 1984;311:271–273. doi: 10.1038/311271a0. - DOI - PubMed
    1. Satin L.S., Cook D.L. Voltage-gated Ca2+ current in pancreatic B-cells. Pflügers Archiv. 1985;404:385–387. doi: 10.1007/BF00585354. - DOI - PubMed
    1. Dean P.M., Matthews E.K. Electrical activity in pancreatic islet cells: effect of ions. J. Physiol. 1970;210:265–275. doi: 10.1113/jphysiol.1970.sp009208. - DOI - PMC - PubMed
    1. Malaisse W.J. Insulin secretion: multifactorial regulation for a single process of release. The Minkowski award lecture delivered on September 7, 1972 before the European Association for the study of Diabetes at Madrid, Spain. Diabetologia. 1973;9:167–173. doi: 10.1007/BF01219778. - DOI - PubMed

LinkOut - more resources