. 2023 Jul 3;192(3):1928-1946.
doi: 10.1093/plphys/kiad050.

The transcription factor VviNAC60 regulates senescence- and ripening-related processes in grapevine

Affiliations

The transcription factor VviNAC60 regulates senescence- and ripening-related processes in grapevine

Erica D'Incà et al. Plant Physiol. .

Abstract

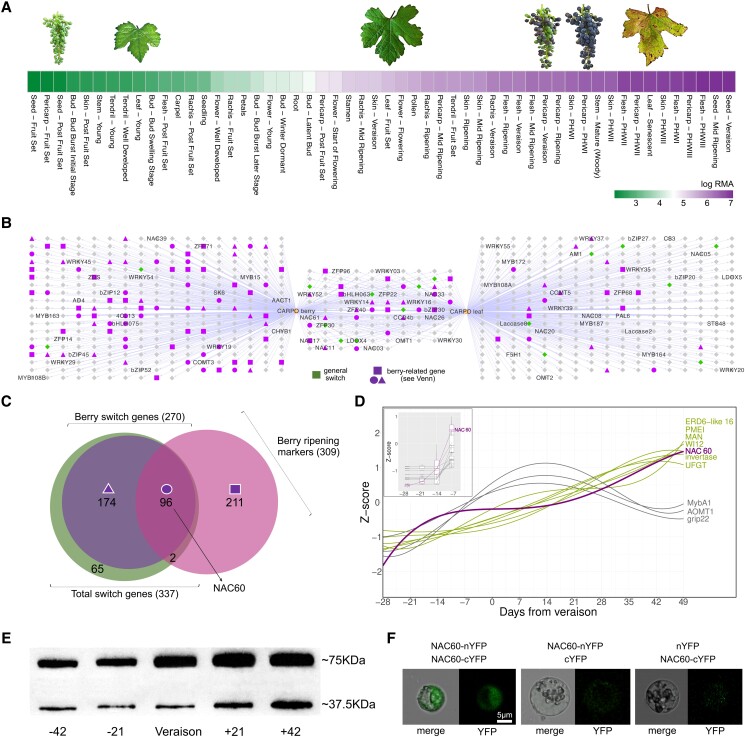
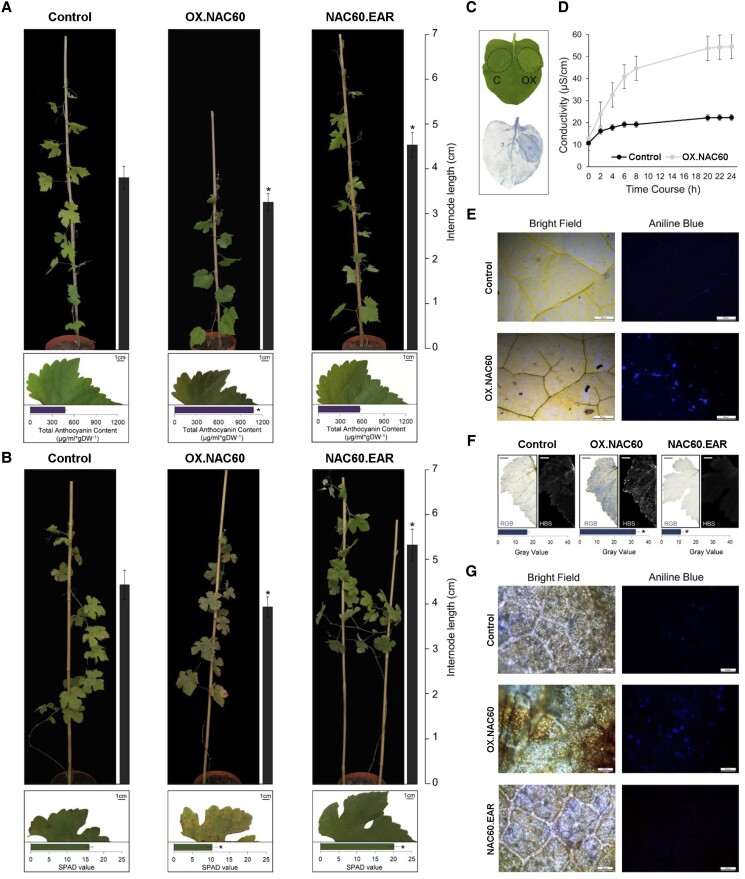
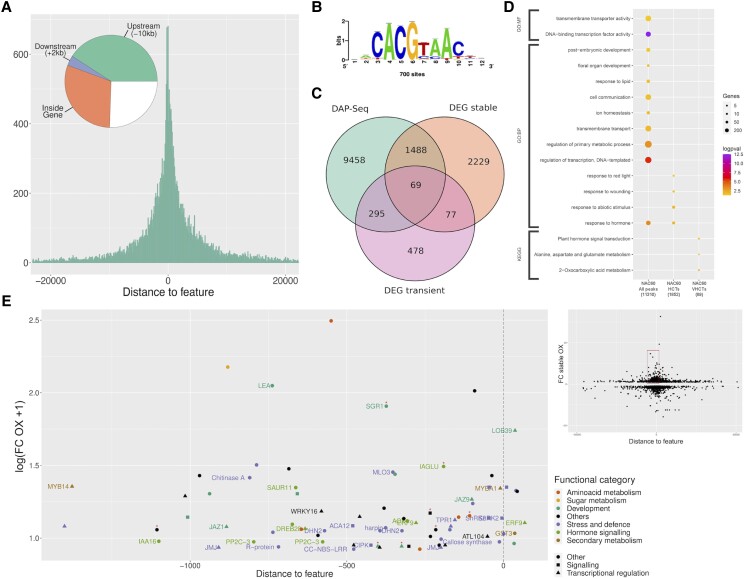
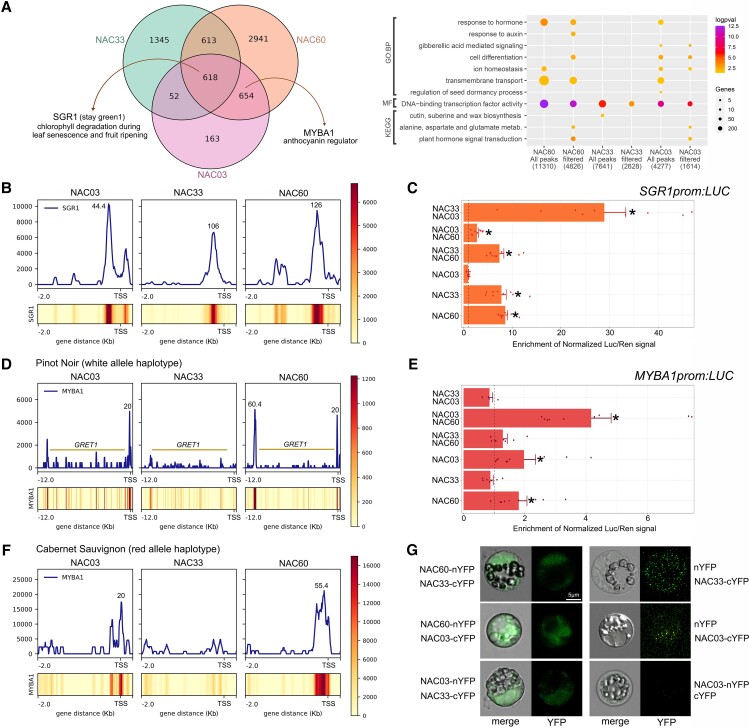
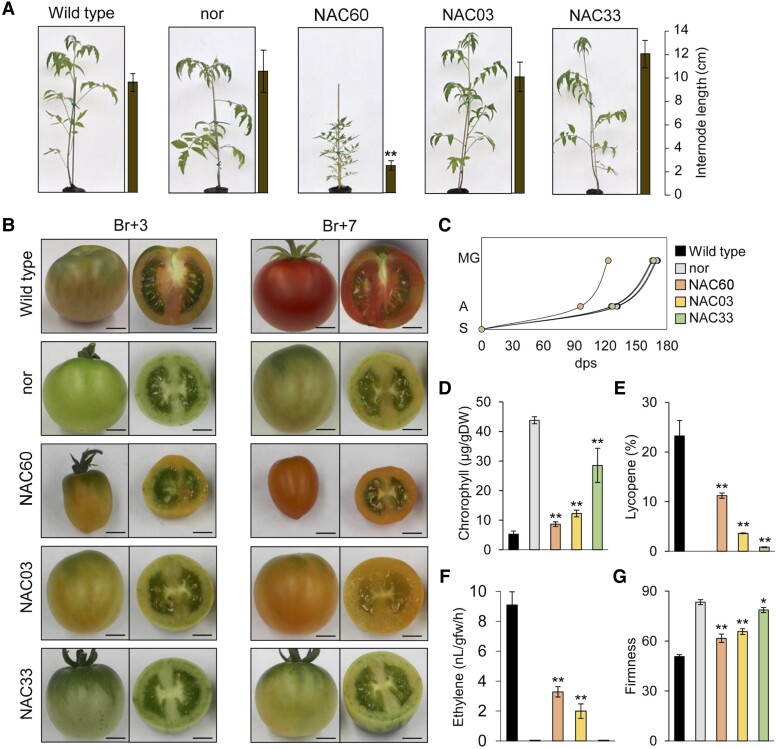
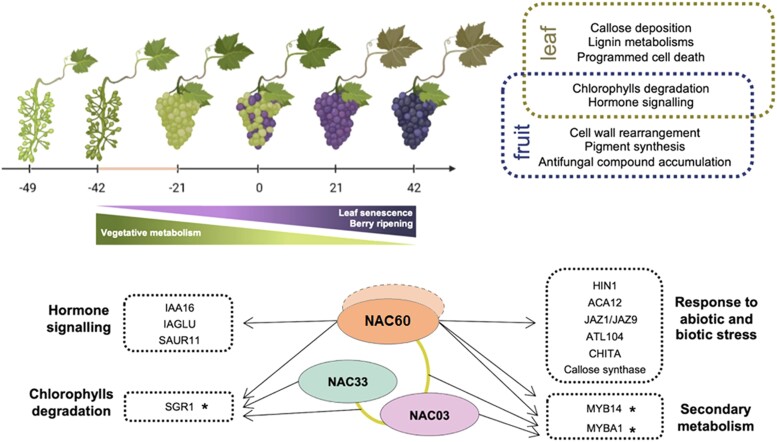
Grapevine (Vitis vinifera L.) is one of the most widely cultivated fruit crops because the winemaking industry has huge economic relevance worldwide. Uncovering the molecular mechanisms controlling the developmental progression of plant organs will prove essential for maintaining high-quality grapes, expressly in the context of climate change, which impairs the ripening process. Through a deep inspection of transcriptomic data, we identified VviNAC60, a member of the NAC transcription factor family, as a putative regulator of grapevine organ maturation. We explored VviNAC60 binding landscapes through DNA affinity purification followed by sequencing and compared bound genes with transcriptomics datasets from grapevine plants stably and transiently overexpressing VviNAC60 to define a set of high-confidence targets. Among these, we identified key molecular markers associated with organ senescence and fruit ripening. Physiological, metabolic, and promoter activation analyses showed that VviNAC60 induces chlorophyll degradation and anthocyanin accumulation through the upregulation of STAY-GREEN PROTEIN 1 (VviSGR1) and VviMYBA1, respectively, with the latter being upregulated through a VviNAC60-VviNAC03 regulatory complex. Despite sharing a closer phylogenetic relationship with senescence-related homologs to the NAC transcription factor AtNAP, VviNAC60 complemented the nonripening(nor) mutant phenotype in tomato (Solanum lycopersicum), suggesting a dual role as an orchestrator of both ripening- and senescence-related processes. Our data support VviNAC60 as a regulator of processes initiated in the grapevine vegetative- to mature-phase organ transition and therefore as a potential target for enhancing the environmental resilience of grapevine by fine-tuning the duration of the vegetative phase.


Conflict of interest statement

Conflict of interest statement. The authors declare that they have no conflict of interest.

Figures

Figure 1
Figure 1
VviNAC60 expression throughout organs development and self-interaction in grapevine. A) Gene expression behavior of VviNAC60 in grapevine organs throughout development. The data were sourced from the atlas transcriptomic dataset of cv. Corvina (Fasoli et al. 2012), RMA, robust multiarray average; PHW, postharvest withering. B) Aggregate co-expression networks of the TOP420 most highly co-expressed genes with VviNAC60 taken from berry and leaf condition-dependent analyses (Orduña et al. 2022). Gene names appearing in the network were cross-referenced from the Grape Gene Reference Catalogue (Navarro-Paya et al. 2022). Node colors and shapes represent the genes classified in C) resulting from the overlap of general and berry switch genes identified in (Palumbo et al. 2015; Massonnet et al. 2017) and berry transition marker genes (Fasoli et al. 2018). D) Expression profiles of VviNAC60 and literature ripening-associated genes (biomarkers) across a high-resolution series of berry developmental stages studied through RNA-seq (Fasoli et al. 2018). E) Western blot analysis of different stages of berry development. Total protein extracts were blotted using anti-VviNAC60 polyclonal antibody. Stages correspond to 42 and 21 d before veraison, veraison, 21- and 42-days post veraison, selected for association with VviNAC60 and biomarker expression profiles. The VviNAC60 protein has a molecular weight of ∼37.5 kDa, which is represented by the lower bands; the upper bands (∼75 kDa) reflect the VviNAC60 homodimer prevalence in all the samples. F) BiFC analysis in grapevine protoplasts showing VviNAC60/VviNAC60 protein interaction. Corresponding controls are also shown in full overexposition mode. Image on left panel shows a representative case of YFP signal being detected in the cell nucleus, by using confocal laser scanning.
Figure 2.
Figure 2.
Phenotypic changes in transgenic grapevine plants with altered expression of VviNAC60. A) Whole 2 mo plant and leaf phenotype caused by the ectopic expression of VviNAC60 in selected OX and EAR lines compared to vector control. Internode lengths on plants and anthocyanins contents on leaves are indicated by the bars next to each picture. The data are expressed as mean ± SD (n = 4). Asterisks indicate significant differences (*, P < 0.01; t-test) in the OX.NAC60 lines compared to the control. SD, standard deviation. B) Whole 10 mo plant and leaf phenotype caused by the ectopic expression of VviNAC60 in selected OX and EAR lines compared to vector control. Internode lengths on plants and chlorophyll contents on leaves are indicated by the bars next to each picture. Asterisks indicate significant differences (*, P < 0.01; t-test) in the OX.NAC60 and NAC60.EAR lines compared to the control. C) Phenotype showed by N. benthamiana leaf after 72 h from the agroinfiltration with OX. NAC60 (OX) and the control C; upper site) and cell death visualized by trypan blue staining (lower site). D) Ion leakage assay on N. benthamiana leaves after 24 h from the agroinfiltration with OX.NAC60 and the control. The data are expressed as mean ± SD (n = 5). E) Callose deposition in N. benthamiana leaves after 72 h from the agroinfiltration with OX.NAC60 and the control visualized by aniline blue staining. The same leaves were photographed at the same time under 2 light fields. F) Cell death on OX and EARNAC60 grapevine leaves compared to the control visualized by trypan blue staining. The same leaves were photographed at the same time under 2 light fields. The data are expressed as mean ± SD (n = 3). Asterisks indicate significant differences (*, P < 0.01; t-test) in the OX.NAC60 and NAC60.EAR lines compared to the control. SD, standard deviation. Bars = 1 cm. G) Callose deposition was visualized by aniline blue staining in OX and EAR grapevine leaves and the control in a bright field (on the left) and under an epifluorescence microscope (on the right). Magnification 10×. The same leaves were photographed at the same time under 2 light fields.
Figure 3.
Figure 3.
Identification of VviNAC60 targets by DAP-seq and transcriptomic analysis. A) Distribution of VviNAC60 DNA binding events (27,715 peaks, assigned in at least 1 of the 3 analyses: 500 ng leaf, 1,000 ng leaf, and 500 ng berry) with respect to their position from the transcription start sites (TSS) of their assigned genes (n: 11,310). B) De novo forward binding motif obtained from the inspection of the top 600-scoring peaks of VviNAC60 500 ng leaf library using Regulatory Sequence Analysis Tools (RSAT; k-mer sig = 2.61; e-value = 0.0025; number of peaks with at least one predicted site: 733 = 24.43%). C) Prediction of VviNAC60 targets based on the overlap of DAP-seq assigned genes (sum of the 3 analyses) and DEGs detected in stable and transient VviNAC60-overexpressing plants. D) Functional enrichment analysis of VviNAC60 bound genes (assigned from all peaks) and selected targets (HCTs, high-confidence targets; VHCTs: very high-confidence targets). VHCTs were selected by focusing on peaks in the −1.5 kb and + 100 bp region and on genes with FC ≥ 1.3 in either the stable or transient overexpressing lines. As additional criteria for VHCTs, we only considered peaks present at the same position from the TSS in at least 2 of the 3 analyses. Gene ontology terms and KEGG pathways shown were filtered based on significance (Benjamini–Hochberg adjusted P-value < 0.05) and biological redundancy (complete list of terms can be found in Supplemental Table S4). The size of each dot represents the number of genes in the input query that are annotated to the corresponding term, and the color represents the significance. Total number of genes in each list is shown in parenthesis. GO:BP, Gene Ontology: Biological Process; GO:MF, Gene Ontology: Molecular Function; KEGG, Kyoto Encyclopedia of Genes and Genomes. E, Relationship between peak distances assigned to each gene and differential expression in stable and/or transient VviNAC60 overexpression (OX) lines in selected VHCTs. Fold Change values correspond to the expression in OX lines versus the control lines, with a positive threshold of FC ≥ 1.3. Node color depicts biological processes for each gene, whereas the shape is depicted by its molecular function. Red asterisks depict those genes upregulated in the transient overexpressing lines.
Figure 4.
Figure 4.
Similarities among grape VviNAC60 and other VviNAC-TFs cistromes. A) Overlap of NAC03, NAC33, and NAC60 filtered DAP-seq bound genes (positional filtering, with peaks ranging between −5,000 bp from Transcriptional Start Site up to 100 bp from the end of the gene; left panel); enrichment analysis of significant (P < 0.05; t-test) gene ontology terms and KEGG pathways for VviNAC-bound genes (right panel). B) VviNAC DNA binding landscapes in the proximal promoter region of VviSGR1 gene. DAP-seq binding signals, shown as density plots and heatmaps and delimited between −2 kb and + 2 kb from the TSS. Binding events identified by GEM are pointed out with their corresponding signal score. C) VviSGR1 promoter activation tested by dual-luciferase reporter assay in infiltrated N. benthamiana leaves. The single and combined activity of VviNAC03, VviNAC33, and VviNAC60 were tested. Firefly LUCIFERASE (LUC) activity values are reported relative to the RENILLA (REN) value and normalized against the control (empty-effector vector). Each value represents the mean of 3 biological replicates, each with 3 technical replicates (± SD). Asterisks indicate significant differences in promoter activation compared with the control (*, P < 0.05; t-test). D) VviNAC DNA binding events in promoter regions of VviMYBA1 gene. Upper panel: sequencing reads were mapped in the cv. PN40024 white allele haplotype that presents the insertion of the GRET1 retrotransposon in VviMYBA1 proximal upstream region (histograms and heatmaps plotted between −12 kb and the TSS of the VviMYBA1 gene). Bottom panel: mapping conducted in the red allele haplotype of cv. Cabernet Sauvignon (no GRET1 insertion). (B–D: scale represents RPKM-normalized data). E) VviMYBA1 promoter activation tested by dual-luciferase reporter assay in infiltrated N. benthamiana leaves. The single and combined activity of all VviNACs were tested. Firefly LUCIFERASE (LUC) activity values are reported relative to the RENILLA (REN) value and normalized against the control (empty-effector vector). Each value represents the mean of 3 biological replicates, each with 3 technical replicates (± SD). Asterisks indicate significant differences in promoter activation compared with the control (*, P < 0.05; t-test). F) BiFC analysis showing VviNAC60/VviNAC33, VviNAC60/VviNAC03, and VviNAC03/VviNAC33 protein interactions. Images are confocal laser scanning micrographs of PEG-transformed grapevine protoplasts. Corresponding controls (right panel) are shown in full overexposition mode.
Figure 5.
Figure 5.
Phenotypic evaluation of VviNAC60, VviNAC03, and VviNAC33 heterologous expression in nor tomato mutant background. A) Whole tomato plant phenotype corresponding to wild type (Solanum lycopersicum cv. Ailsa Craig), nor and T3 fruit transformed with 35S: VviNAC60, 35S:VviNAC03, and 35S:VviNAC33 in nor tomato mutant background. Internode lengths on plants are indicated by the bars next to each picture. The data are expressed as mean ± SD (n = 4). Asterisks indicate significant differences (**, P < 0.01; t-test) compared to the nor. B) Phenotype of tomato fruits corresponding to wild type, nor and T3 fruit transformed with 35S: VviNAC60, 35S:VviNAC03, and 35S:VviNAC33 in nor tomato mutant background. They were collected at the breaker (Br) + 3 and +7. Bar, 2 cm. C) Growth curve of VviNAC60, VviNAC03, and VviNAC33 transgenic plants in nor background, wild type and nor (n = 9) from seedling to mature green stage. S, seedling; A, anthesis; MG, mature green; dps, day post seedling. D) Chlorophyll content in VviNAC60, VviNAC03, and VviNAC33 transgenic fruits in nor background, wild type and nor at Br + 3. The data are expressed as mean ± SD (n = 4). Asterisks indicate significant differences (**, P < 0.01; t-test) compared to nor. E) Lycopene content in VviNAC60, VviNAC03, and VviNAC33 transgenic fruits in nor background, wild type and nor at Br + 3. The data are expressed as mean ± SD (n = 4). Asterisks indicate significant differences (**, P < 0.01; t-test) compared to the nor. F) Ethylene production in VviNAC60, VviNAC03, and VviNAC33 transgenic fruits in nor background, wild type and nor at Br +5. Each value represents the mean ± standard deviation (SD) of 3 biological replicates. Asterisks indicate significant differences (**, P < 0.01; t-test) compared to nor. G) Fruits firmness of VviNAC60, VviNAC03, and VviNAC33 transgenic fruits in nor background, wild type and nor at Br +3. The data are expressed as mean ± SD (n = 4). Asterisks indicate significant differences (**, P < 0.01; *, P < 0.05; t-test) compared to nor.
Figure 6.
Figure 6.
Leaf and fruit developmental progression with the respective and common VviNAC60-regulated gene categories and a proposed regulatory mechanism model for the action of the 3 studied VviNAC TFs on selected targets. Asterisks (*) indicate genes validated by dual-luciferase assays, the gold line indicates the interaction validated by BiFC analyses and the dotted NAC60 represents the possible homodimerization. The grape images were created with BioRender.com.

References

    1. Amato A, Cavallini E, Walker AR, Pezzotti M, Bliek M, Quattrocchio F, Koes R, Ruperti B, Bertini E, Zenoni S, et al. . The MYB5-driven MBW complex recruits a WRKY factor to enhance the expression of targets involved in vacuolar hyper-acidification and trafficking in grapevine. Plant J. 2019:99(6): 1220–1241. 10.1111/tpj.14419 - DOI - PubMed
    1. Amato A, Cavallini E, Zenoni S, Finezzo L, Begheldo M, Ruperti B, Tornielli GB. A grapevine TTG2-like WRKY transcription factor is involved in regulating vacuolar transport and flavonoid biosynthesis. Front Plant Sci. 2017:7: 1979. 10.3389/fpls.2016.01979 - DOI - PMC - PubMed
    1. Ariani P, Regaiolo A, Lovato A, Giorgetti A, Porceddu A, Camiolo S, Wong D, Castellarin S, Vandelle E, Polverari A. Genome-wide characterisation and expression profile of the grapevine ATL ubiquitin ligase family reveal biotic and abiotic stress-responsive and development-related members. Sci Rep. 2016:6(1): 38260. 10.1038/srep38260 - DOI - PMC - PubMed
    1. Bartlett A, O’Malley RC, Huang SC, Galli M, Nery JR, Gallavotti A, Ecker JR. Mapping genome-wide transcription-factor binding sites using DAP-seq. Nat Protoc. 2017:12(8): 1659–1672. 10.1038/nprot.2017.055 - DOI - PMC - PubMed
    1. Bertini E, Tornielli GB, Pezzotti M, Zenoni S. Regeneration of plants from embryogenic callus-derived protoplasts of garganega and sangiovese grapevine (Vitis vinifera L.) cultivars. Plant Cell Tissue and Organ Culture. 2019:138(2): 239–246. 10.1007/s11240-019-01619-1 - DOI

Publication types