. 2023 Jul 4;119(7):1509-1523.
doi: 10.1093/cvr/cvad016.

Human and murine fibroblast single-cell transcriptomics reveals fibroblast clusters are differentially affected by ageing and serum cholesterol

Affiliations

Human and murine fibroblast single-cell transcriptomics reveals fibroblast clusters are differentially affected by ageing and serum cholesterol

Kim van Kuijk et al. Cardiovasc Res. .

Abstract

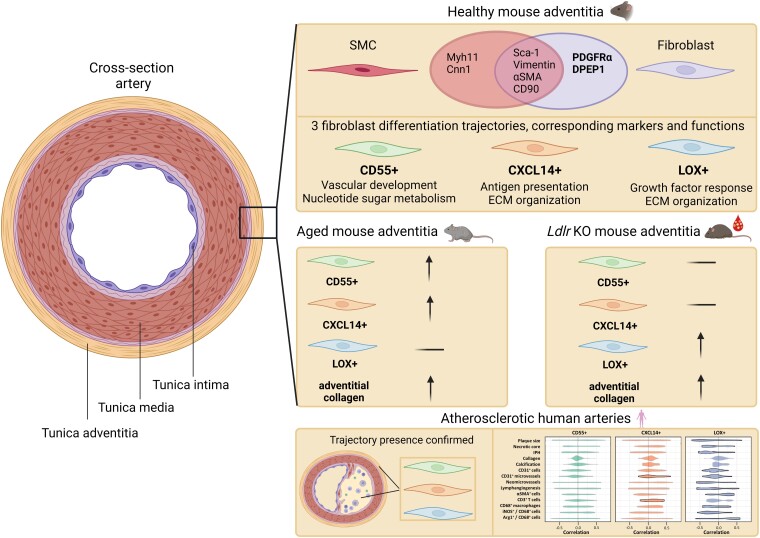
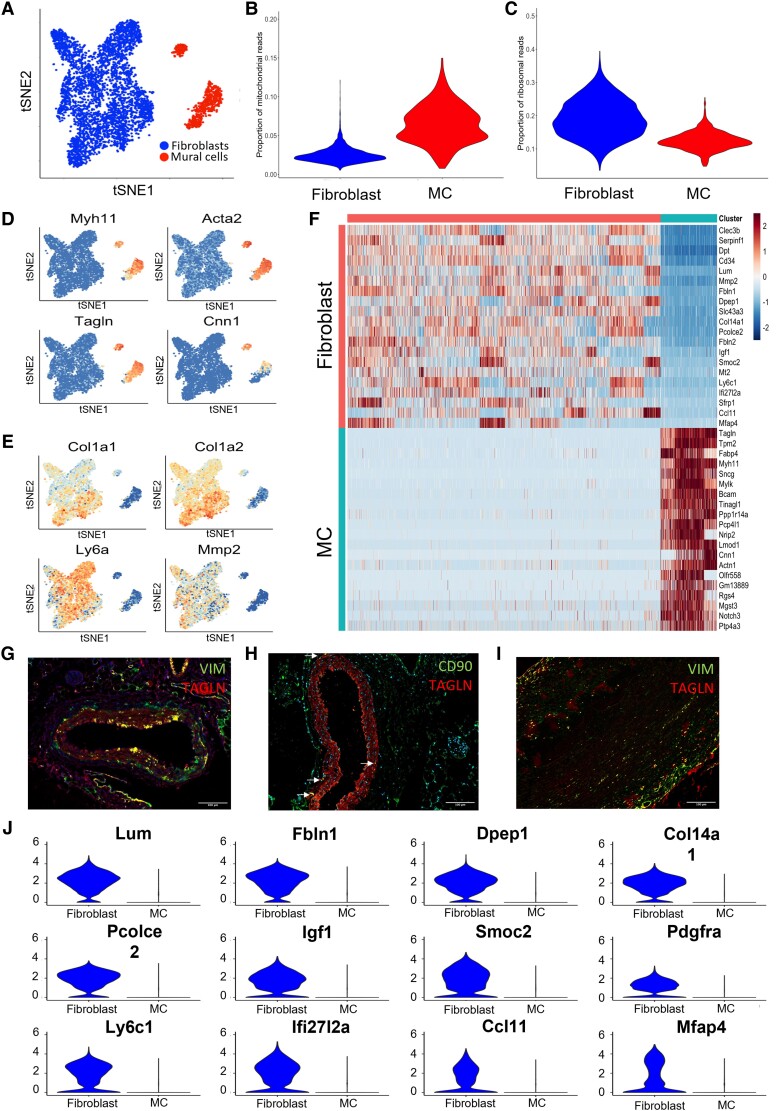
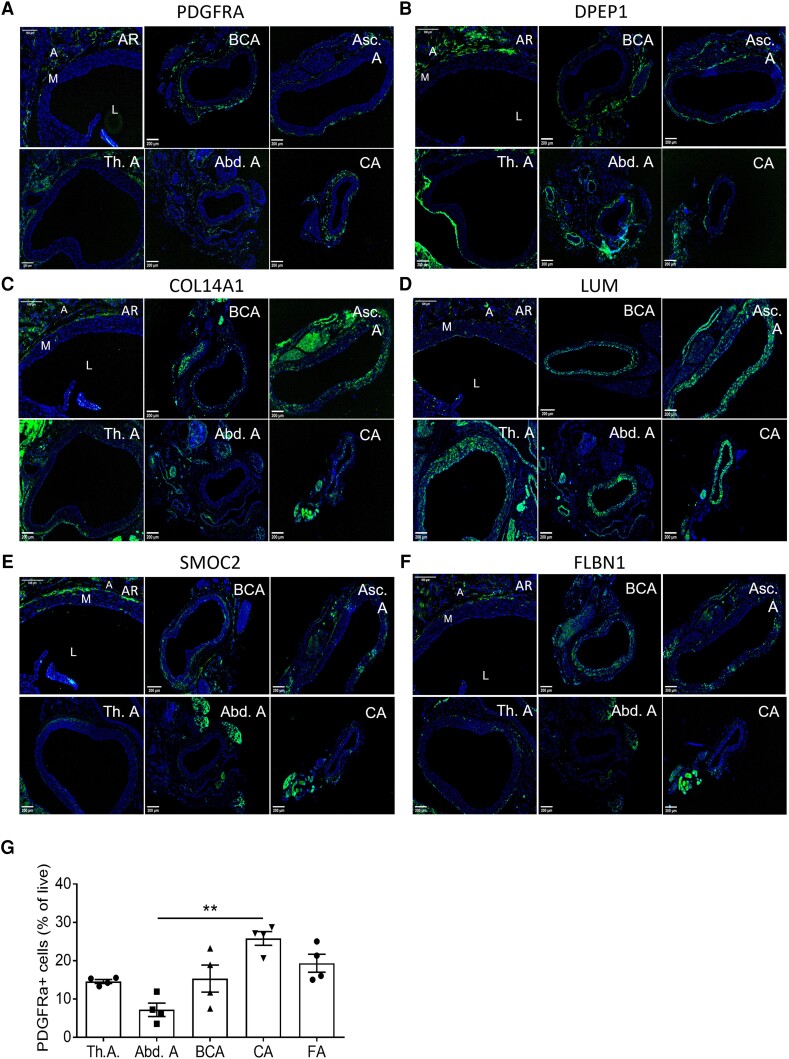
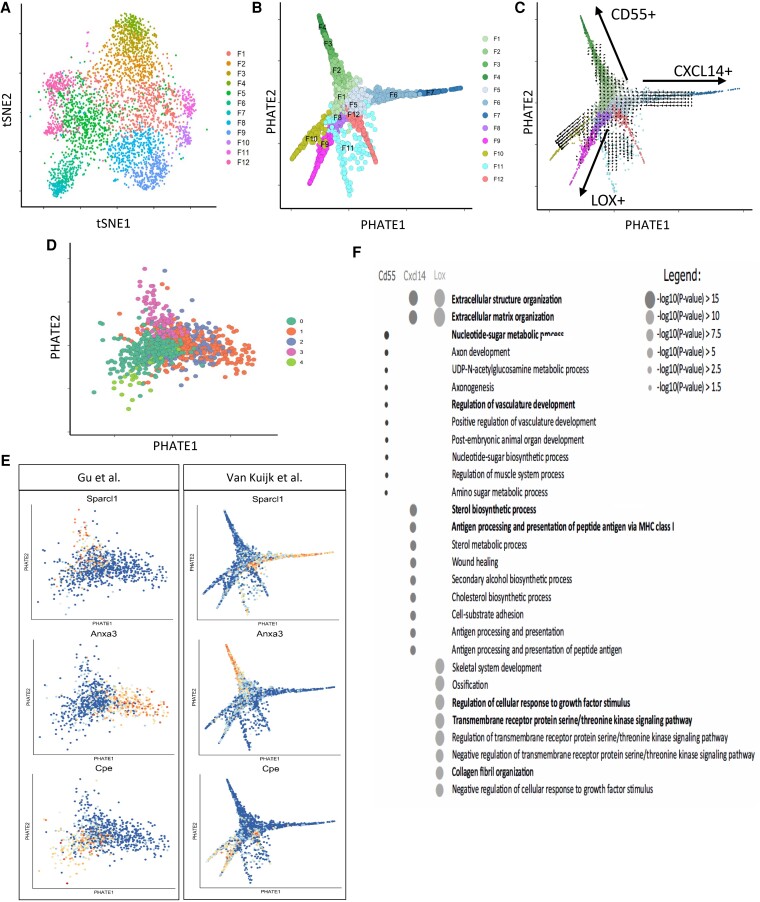
Aims: Specific fibroblast markers and in-depth heterogeneity analysis are currently lacking, hindering functional studies in cardiovascular diseases (CVDs). Here, we established cell-type markers and heterogeneity in murine and human arteries and studied the adventitial fibroblast response to CVD and its risk factors hypercholesterolaemia and ageing.

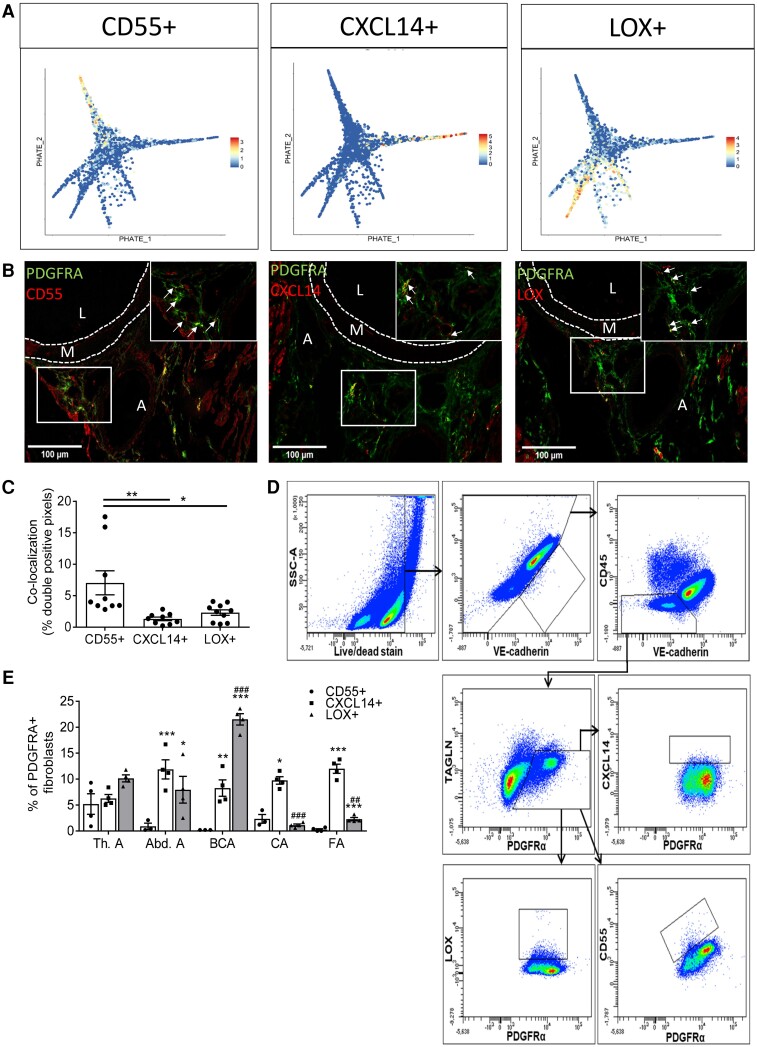
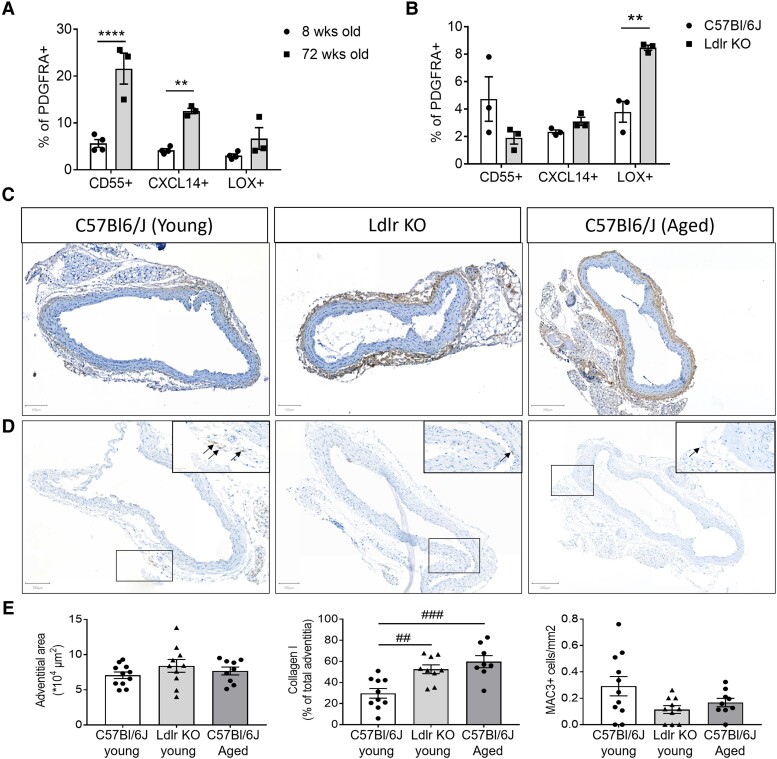
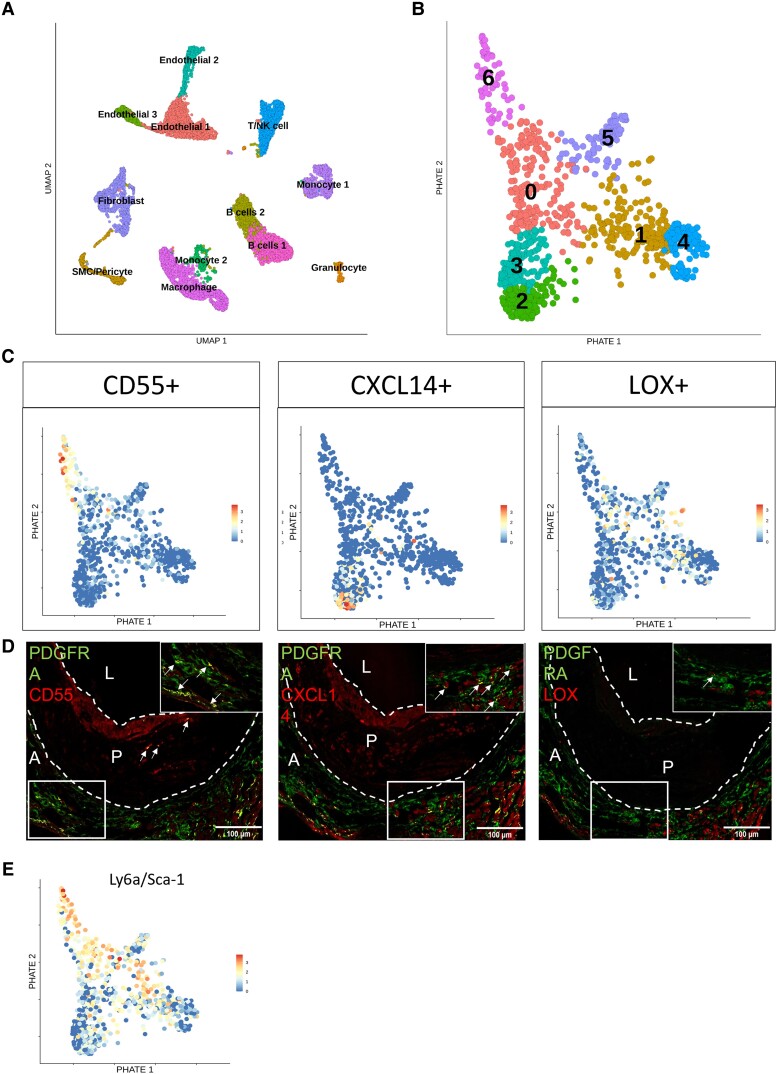
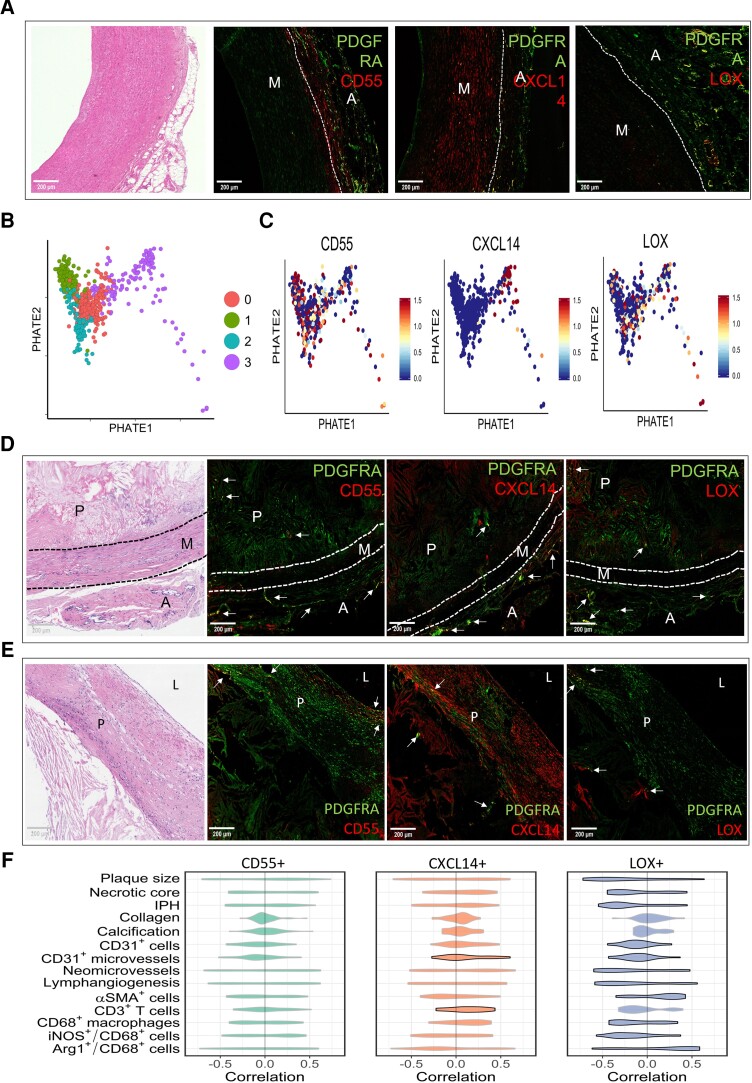
Methods and results: Murine aorta single-cell RNA-sequencing analysis of adventitial mesenchymal cells identified fibroblast-specific markers. Immunohistochemistry and flow cytometry validated platelet-derived growth factor receptor alpha (PDGFRA) and dipeptidase 1 (DPEP1) across human and murine aorta, carotid, and femoral arteries, whereas traditional markers such as the cluster of differentiation (CD)90 and vimentin also marked transgelin+ vascular smooth muscle cells. Next, pseudotime analysis showed multiple fibroblast clusters differentiating along trajectories. Three trajectories, marked by CD55 (Cd55+), Cxcl chemokine 14 (Cxcl14+), and lysyl oxidase (Lox+), were reproduced in an independent RNA-seq dataset. Gene ontology (GO) analysis showed divergent functional profiles of the three trajectories, related to vascular development, antigen presentation, and/or collagen fibril organization, respectively. Trajectory-specific genes included significantly more genes with known genome-wide associations (GWAS) to CVD than expected by chance, implying a role in CVD. Indeed, differential regulation of fibroblast clusters by CVD risk factors was shown in the adventitia of aged C57BL/6J mice, and mildly hypercholesterolaemic LDLR KO mice on chow by flow cytometry. The expansion of collagen-related CXCL14+ and LOX+ fibroblasts in aged and hypercholesterolaemic aortic adventitia, respectively, coincided with increased adventitial collagen. Immunohistochemistry, bulk, and single-cell transcriptomics of human carotid and aorta specimens emphasized translational value as CD55+, CXCL14+ and LOX+ fibroblasts were observed in healthy and atherosclerotic specimens. Also, trajectory-specific gene sets are differentially correlated with human atherosclerotic plaque traits.

Conclusion: We provide two adventitial fibroblast-specific markers, PDGFRA and DPEP1, and demonstrate fibroblast heterogeneity in health and CVD in humans and mice. Biological relevance is evident from the regulation of fibroblast clusters by age and hypercholesterolaemia in vivo, associations with human atherosclerotic plaque traits, and enrichment of genes with a GWAS for CVD.

Keywords: Adventitia; Atherosclerosis; Fibroblasts; Heterogeneity; Single-cell RNA-seq.


Conflict of interest statement

Conflict of interest: None declared.

Figures

Graphical Abstract
Graphical Abstract
Figure 1
Figure 1
scRNA-seq reveals fibroblast transcriptional signature for healthy murine aortic adventitia. (A) T-distributed stochastic neighbour embedding (tSNE) plot of single-cell sequencing data derived from CD45−/ICAM2−/PDGFRβ+ adventitial cells from a pool of nine young C57Bl6 mice. (B) Mitochondrial signature of fibroblasts and MCs post-filtering; (C) ribosomal signature of fibroblasts and MC post-filtering; (D) expression of MC markers (Myh11, Acta2, Tgln, Cnn1); and (E) traditional fibroblast markers (Col1α1, Col1α2, Ly6a, Mmp2) projected on tSNE plot from D shows cell-type annotation. (F) Heatmap of differentially expressed genes (DEGs) in fibroblasts and MC. Immunohistochemical staining of SMC marker Tgln (red) with traditional fibroblast markers (green) in mice. (G) Vimentin (VIM), (H) CD90, and (I) human aorta (VIM) (J). Violin plots of 12 genes differentially expressed in fibroblasts compared with MC.
Figure 2
Figure 2
Validation of fibroblast signature across multiple vascular beds. Representative immunohistochemical staining of proposed fibroblast markers. (A) Platelet-derived growth factor alpha (PDGFRA, (B). Dipeptidase 1 (DPEP1), (C) Collagen 14 alpha 1 (COL14A1), (D) Lumican (LUM), (E) SPARC-related modular calcium binding 2 (SMOC2), and (F) Fibulin 1 (FBLN1), in healthy murine C57BL/6J aortic roots (AR), brachiocephalic artery (BCA), ascending aorta (Asc.A), thoracic aorta (Th.A), abdominal aorta (Abd.A), and carotid artery (CA) n = 10). Nuclei in blue and fibroblast makers in green. L indicates Lumen, M indicates media, and A indicates adventitia. (G) PDGFRA+ frequencies of live CD45-/CDH5+/TAGLN+ adventitial cells across C57BL/6J arteries [thoracic aorta (Th.A), abdominal aorta (Abd.A), brachiocephalic artery (BCA), carotid artery (CA), and femoral artery (FA)], analysed by flow cytometry (n = 4 pools of 5 mice each, 20 mice total). Statistical analysis was performed using the Kruskal–Wallis test, with Dunn’s post hoc test (G). Results are shown as mean ± standard error of the mean (SEM). *P < 0.05 vs. Th.A.
Figure 3
Figure 3
Trajectory analysis shows distinct phenotypes of fibroblasts in healthy murine adventitia. (A) tSNE plot of fibroblasts originating from Figure 1D. (B). PHATE pseudotime trajectory analysis of fibroblasts from Figure 1D depicting 12 clusters differentiating along several trajectory paths. (C) RNA velocity analysis on PHATE data from Figure 3B, arrows are indicating directionality. (D) Data were validated by PHATE analysis on an independent dataset from Gu et al. (840 cells from healthy murine adventitia) showing three trajectories. (E) Feature plots show the expression of three differentially expressed genes in trajectories from Gu dataset on Gu PHATE map, and their expression in three trajectories of the PHATE map of our dataset (van Kuijk). (F) Dot plot of the GO terms from the most differentiated clusters (F4, F7, F9) representing Trajectories 1–3, respectively, with the most relevant GO terms in bold.
Figure 4
Figure 4
Fibroblast clusters representing three trajectories can be identified on transcriptional and protein levels in healthy murine adventitia. (A) Projection of cluster markers representing the three trajectories Cd55, Cxcl14, and Lox on PHATE plot from Figure 3A. (B) Immunohistochemical staining of CD55, CXCL14, and LOX in aortic roots of healthy C57Bl/6J mice (n = 10). Pan-fibroblast marker PDGFRA in green and fibroblast trajectory markers in red. Yellow areas indicate double-positive cells for PDGFRA and cluster marker (marked with arrows in 63 × magnification). L indicates Lumen, M indicates media, A indicates adventitia. (C) Quantification of double-positive cells for each cluster in aortic roots of Figure 4B. (D) Flow cytometry gating strategy of each fibroblast cluster. (E) Fibroblast clusters in the adventitia of thoracic aorta (Th.A), abdominal aorta (Ab.A), brachiocephalic artery (BCA), carotid artery (CA), and femoral artery (FA) assessed by flow cytometry in 4 pools of 5 mice, 20 mice in total. Statistical analyses were performed using one-way analysis of variance (ANOVA) with the Bonferroni post hoc test (C) or two-way ANOVA with the Tukey post hoc test (E). All results show mean ± SEM. *P < 0.05, **P < 0.01, or ***P < 0.001 vs. CD55+ fibroblasts in same artery; #P < 0.05 or ###P < 0.001 vs. same cluster in Th.A.
Figure 5
Figure 5
Fibroblast clusters representing three trajectories are differentially regulated upon CV risk factors. (A) Flow cytometry analysis of fibroblast clusters representing three trajectories in thoracic aorta adventitia from young or aged C57BL/6J mice, 12 or 72 weeks old, respectively [n = 4 pools of young mice, 9 mice per pool (36 mice total) vs. n = 3 pools of aged mice, 4–5 mice per pool (14 mice total), respectively]. Data are depicted as mean ± SEM. (B) Flow cytometry analysis of fibroblast clusters representing trajectories in adventitia from Ldlr KO mice on chow diet vs. healthy C57BL/6J mice [n = 3 pools, 4 mice per pool (12 mice total) vs. n = 3 pools, 6 mice per pool (18 mice total), respectively]. Data are depicted as mean ± SEM. (C) Representative images of Collagen type I, (D) MAC3 immunohistochemical staining, and (E) quantification of adventitial area, collagen type I, and MAC3+ cells in the adventitia of young, Ldlr KO, and aged mice (11, 10, and 9 mice per group, respectively). Positive cells or areas are observed in brown and nuclei in blue. Statistical analyses were performed using two-way ANOVA (A and B) or one-way ANOVA (E), with the Bonferroni post hoc test. All results show mean ± SEM. **P < 0.0032, ****P < 0.0001, ##P < 0.0060, ###P < 0.0006.
Figure 6
Figure 6
Fibroblast cluster markers representing three trajectories are still observed in atherosclerosis, while LOX+ fibroblasts reduced in presence. (A) Unsupervised clustering of single-cell sequencing data from Ldlr KO mice on chow or 16 weeks of HCD. Results are visualized by Uniform Manifold Approximation and Projection (UMAP), colours represent individual clusters. (B) PHATE visualization of fibroblasts originating from the dataset in Figure 6A, colours represent individual clusters. (C) Cluster markers projected on fibroblast PHATE plot of Figure 6B, representing Trajectory 1 using Cd55, Trajectory 2 using Cxcl14, and Trajectory 3 using Lox. (D) Protein expression of each cluster marker visualized by immunohistochemistry in aortic roots from Ldlr KO mice after 16 weeks HCD. Pan-fibroblast markers in green and fibroblast cluster markers in red. Yellow areas indicate double-positive cells for pan fibroblast and cluster marker (marked with arrows). L indicates Lumen, P indicates plaque, A indicates adventitia. (E) Sca-1/Ly6a mRNA expression visualized on PHATE map, originating from Figure 6B, depicting fibroblast clusters.
Figure 7
Figure 7
Fibroblast trajectories correlate differentially to human atherosclerotic plaque phenotype. (A) Immunohistochemical staining of CD55+ fibroblasts, CXCL14+ fibroblasts, and LOX+ fibroblasts representing Trajectories 1–3, respectively, in human IT specimens collected through autopsy, accompanied with corresponding H&E, pan-fibroblast marker in green, and fibroblast trajectory markers in red. Yellow areas indicate double-positive cells for pan fibroblast and cluster marker. M indicates media and A indicates adventitia. (B) PHATE analysis of fibroblasts in scRNA-seq dataset by Li et al. showing four clusters. (C) Fibroblast cluster markers representing the trajectories from mouse scRNA-seq data extrapolated to feature plots of human control data. Immunohistochemical staining of CD55+ fibroblasts, CXCL14+ fibroblasts, and LOX+ fibroblasts representing Trajectories 1–3, respectively, in advanced human atherosclerotic plaques, showing the adventitial side (D) and the luminal side (E), accompanied by the corresponding H&E. Pan-fibroblast marker in green and fibroblast trajectory markers in red. Yellow areas indicate double-positive cells for pan fibroblast and cluster marker. M indicates media, P indicates plaque, A indicates adventitia. (F) Violin plots depicting correlations of all genes differentially expressed by each fibroblast trajectory with plaque traits in 43 human carotid plaque segments. Significant violin plots (P < 0.05) were denoted with a black border. Significance was assessed by positive and negative correlations and the unbalance thereof, which was defined as the sum of positive correlations minus the sum of absolute values of negative correlations. Furthermore, correlation skewness was compared between trajectory genes and a random gene set containing a similar number of genes. The permutation test was performed 100 000 times and the P-value is the frequency of the random gene sets that have higher correlation skewness than the trajectory gene set.

References

    1. Jolly AJ, Lu S, Strand KA, Dubner AM, Mutryn MF, Nemenoff RA, Majesky MW, Moulton KS, Weiser-Evans MCM. Heterogeneous subpopulations of adventitial progenitor cells regulate vascular homeostasis and pathological vascular remodeling. Cardiovasc Res 2021;118:1452–1465. - PMC - PubMed
    1. van Kuijk K, Kuppe C, Betsholtz C, Vanlandewijck M, Kramann R, Sluimer JC. Heterogeneity and plasticity in healthy and atherosclerotic vasculature explored by single-cell sequencing. Cardiovasc Res 2019;115:1705–1715. - PMC - PubMed
    1. Xie T, Wang Y, Deng N, Huang G, Taghavifar F, Geng Y, Liu N, Kulur V, Yao C, Chen P, Liu Z, Stripp B, Tang J, Liang J, Noble PW, Jiang D. Single-cell deconvolution of fibroblast heterogeneity in mouse pulmonary fibrosis. Cell Rep 2018;22:3625–3640. - PMC - PubMed
    1. Guerrero-Juarez CF, Dedhia PH, Jin S, Ruiz-Vega R, Ma D, Liu Y, Yamaga K, Shestova O, Gay DL, Yang Z, Kessenbrock K, Nie Q, Pear WS, Cotsarelis G, Plikus MV. Single-cell analysis reveals fibroblast heterogeneity and myeloid-derived adipocyte progenitors in murine skin wounds. Nat Commun 2019;10:650. - PMC - PubMed
    1. Tillie R, van Kuijk K, Sluimer JC. Fibroblasts in atherosclerosis: heterogeneous and plastic participants. Curr Opin Lipidol 2020;31:273–278. - PubMed

Publication types