. 2023 Apr 11;51(6):e35.
doi: 10.1093/nar/gkad022.

SPRTN-dependent DPC degradation precedes repair of damaged DNA: a proof of concept revealed by the STAR assay

Affiliations

SPRTN-dependent DPC degradation precedes repair of damaged DNA: a proof of concept revealed by the STAR assay

Mateo Glumac et al. Nucleic Acids Res. .

Abstract

DNA-protein crosslinks (DPCs), formed by the covalent conjugation of proteins to DNA, are toxic lesions that interfere with DNA metabolic processing and transcription. The development of an accurate biochemical assay for DPC isolation is a priority for the mechanistic understanding of their repair. Here, we propose the STAR assay for the direct quantification of DPCs, sensitive to physiologically relevant treatment conditions. Implementing the STAR assay revealed the formation of small cross-linked peptides on DNA, created by the proteolytic degradation of DPCs by SPRTN. The initial proteolytic degradation of DPCs is required for the downstream activation of DNA repair, which is mediated through the phosphorylation of H2Ax. This leads to the accumulation of DNA repair factors on chromatin and the subsequent complete removal of the cross-linked peptides. These results confirmed that the repair of DPCs is a two-step process, starting with proteolytic resection by SPRTN, followed by the repair of the underlying damage to the DNA.


Figures

Graphical Abstract
Graphical Abstract
The first step in DPC repair is SPRTN-mediated proteolysis. The remaining cross-linked peptides are finally resolved by the activation of DNA damage repair.
Figure 1.
Figure 1.
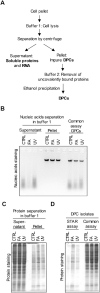
The design and validation of the STAR assay. (A) Schematic illustration of DPC isolation following the STAR assay protocols. (B) Separation of DNA/DPCs from the RNA in buffer 1 in the first step of the protocol. Cells were treated with FA (400 μM for 15 min) or UV (2 mJ/cm2, 5 min recovery), lysed in buffer 1, and centrifuged. Nucleic acids were visualized by agarose gel electrophoresis and ethidium bromide staining in parallel to the common assay isolates from the same cells. (C) SDS-PAGE analysis of isolates obtained from buffer 1. Proteins were visualized with CBB staining. (D) SDS-PAGE analysis of the same isolates pelleted from buffer 1 after cleansing with buffer 2 and ethanol precipitation, compared to the common assay isolates (both showing DPCs). Proteins were visualized with CBB staining.
Figure 2.
Figure 2.
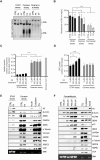
Specificity and sensitivity of the STAR assay towards DPCs. (A) Evaluation of specificity and efficiency of DNA recovery between different isolation protocols. DNA/DPCs were isolated following three comparable methods: the STAR assay, common assay, and commercial assay for DNA isolation from cells treated with formaldehyde (FA) (400 μM for 15 min) or UV (2 mJ/cm2, 5 min recovery). Isolates were evaluated by agarose gel electrophoresis and ethidium bromide staining. (B) After RNA digestion by RNAse DNA concentration was measured as absorbance at 260nm using spectrophotometry. The results were analysed by Dunnett's multiple comparisons test (main column effect). (C) Cells were exposed to 15-min FA treatment in indicated concentrations to induce crosslinks and DPCs were isolated using the STAR and the common assays. For referent control, the nuclear fraction was isolated and protein content was evaluated under the same conditions. The same amount of cells was used for each experiment. Protein content was evaluated by BCA assay. Presented statistical analysis is a result of one-way ANOVA. (D) Evaluation of assay sensitivity to FA treatment after normalization. Presented statistical analysis is Dennett's multiple comparisons test. (E) Immunoblot detection of selected endogenous proteins in DPCs isolated by two assays, with nuclear and cytoplasmic fractions and the total cell lysate (TCL) used as positive controls. DNA was used as a loading control. (F) Evaluation of the STAR assay sensitivity for DPC induction by immunoblot. DPCs were induced by 15-min FA treatment in indicated concentrations. Selectivity for nuclear localization was evaluated by comparing DPC isolates with nuclear fractions. DNA was used as a loading control. Symbols for different test significance levels are assigned as follows: not significant (ns) for P > 0.05, * P < 0.05, ** P < 0.001, *** P < 0.0001 and **** P < 0.00001. All data for measured variables were expressed as mean ± SD. The sample size was n = 3 containing technical replicates.
Figure 3.
Figure 3.
The MS analysis of DPC-forming proteins identified the presence of proteolytically created DNA-peptide crosslinks. (A) MS analysis performed on DPC isolates from untreated cells (Endogenous DPC-proteins) or cells treated with 400 μM FA for 15 minutes (FA-induced DPCs) and from nuclear isolates (Nuclear proteins). Identified proteins were categorized into 11 larger categories according to functional annotation based on the PANTHER dataset class annotation. The data are presented as pie charts representing the proteins identified in the nuclear fraction, endogenous DPCs, FA-induced DPCs, and the most induced by FA. (B) Schematic representation of MS analysis designed to detect the presence of proteolytically formed DNA-peptide crosslinks. DPC isolates from untreated and FA-treated cells and nuclear fractions were subjected to SDS-PAGE prior to MS analysis. After separation, lanes containing isolates were cut out of the gel and further cut at 60 kDa size, determined by the protein marker. Two gel sections were analysed separately. (C) The proportion of full-size proteins larger than 90 kDa (detected in the gel section containing >60 kDa proteins) in the total amount of identified specific peptides corresponding to a specific protein. The proteins presented are the top 10 most induced nuclear proteins by FA treatment (determined by iBAQ values) and one of the most studied DPCs, the TOPO1.
Figure 4.
Figure 4.
The presence of cross-linked peptides on the DNA molecule correlates with DPC proteolysis. (A) The dynamics of resolving DPCs was evaluated in a recovery experiment. Cells were treated with 800 μM FA for 15 minutes and allowed to recover for indicated time duration. DPCs were isolated by STAR assay and quantified using BCA assay. The presented statistical analysis is the result of Tukey's multiple comparisons test. (B) Detection of proteolytically created peptides still crosslinked to DNA in DPC isolates from recovery experiment. Cells were treated with 800 μM FA for 15 min and allowed to recover for indicated time duration. DPCs were isolated by STAR assay and SDS-PAGE CBB staining was performed. (C) The same experimental setup as B but DPCs were induced by 400 μM of FA for 15 min. (D) The dynamics of DPC repair after Topotecan (TOP) induction of TOPO1-DPCs. Cells were treated with 10 μM of TOP for 15 min and left to recover for an indicated time. DPCs were isolated by STAR assay and quantified by immunodetection using a TOPO1 antibody. The presented statistical analysis is the result of Dunnett's multiple comparisons test. (E) Western blot detection of proteolytically created Topoisomerase peptides still crosslinked to DNA during recovery experiment after TOP treatment. Symbols for different test significance levels are assigned as follows: not significant (ns) for P > 0.05, * P < 0.05, ** P < 0.001, *** P < 0.0001 and **** P < 0.00001. All data for measured variables were expressed as mean ± SD. The sample size was n = 3 containing biological replicates.
Figure 5.
Figure 5.
SPRTN chromatin binding in relation to DNA damage signalling and the loading of DNA repair factors. (A) DNA damage signalling and SPRTN expression were analysed in cells treated with 400 μM of FA for the indicated time using WB. Actin was used as a loading control. (B) Immunofluorescence imaging of SPRTN following the treatment with 400 μM of FA for the indicated time. (C) Cell fractionation of cells treated with 400 μM FA for indicated time presented as soluble versus chromatin fraction. GAPDH and H3 were used as loading controls for each fraction. Additionally, the nucleoplasmic fraction was blotted to show a nuclear accumulation of SPRTN. The nucleoplasmic fraction was loaded equivalently to soluble and chromatin fractions. (D) Cell fractionation of FA-treated cells (400 μM for 15 min) recovered for indicated time presented as soluble versus chromatin fraction. GAPDH and H3 were used as loading controls for each fraction. The chromatin binding of SPRTN, PCNA, VCP, PRKDC, PARP1, and XRCC3 was evaluated in accordance with DNA damage signalling (p-ATM and γH2Ax). (E) Cell fractionation of TOP-treated cells (10 μM for 15 min) recovered for indicated time presented as soluble versus chromatin fraction. GAPDH and H3 were used as loading controls for each fraction. The chromatin binding of SPRTN, PCNA, VCP, PRKDC, PARP1 and XRCC3 was evaluated in accordance with DNA damage signalling (p-ATM and γH2Ax).
Figure 6.
Figure 6.
Proteolytic degradation of DPCs, by SPRTN, is essential for signalling and the repair of DPC-induced DNA damage. (A) The dynamics of resolving DPCs in siCTRL and siSPRTN silenced cells were evaluated in a recovery experiment. The efficiency of SPRTN silencing was demonstrated by WB. Cells were treated with 800 μM FA for 15 min and allowed to recover for indicated time duration. DPCs were isolated by STAR assay and quantified by BCA assay. (B) The association of DNA damage signalling and SPRTN was analysed by WB in siCTRL and siSPRTN silenced cells treated with 400 μM of FA for 15 min and left to recover for the indicated time. Actin was used as a loading control. (C) The dynamics of resolving TOP-induced DPCs in siCTRL and siSPRTN silenced cells were evaluated in a recovery experiment. The efficiency of SPRTN silencing was demonstrated by WB. Cells were treated with 10 μM TOP for 15 minutes and allowed to recover for indicated time duration. DPCs were isolated by STAR assay and quantified by immunoblotting using the DNA as a loading control. (D) The association of DNA damage signalling and SPRTN was analysed by WB in siSPRTN silenced cells treated with 10 μM of TOP for the indicated time duration. Actin was used as a loading control. (E) Dependency of DPC proteolysis on SPRTN. Cells were treated with 10 μM TOP for 15 minutes and allowed to recover for indicated time duration. DPCs were isolated by STAR assay and quantified by immunoblotting using the DNA as a loading control. (F) Cell fractionation of siCTRL and siSPRTN cells treated with 400 μM of FA for 15 min and left to recover for 60 and 90 min. GAPDH and H3 were used as loading controls for each fraction. The chromatin binding of SPRTN, PCNA, VCP, PRKDC, PARP1, and XRCC3 was evaluated in accordance with DNA damage signalling (p-ATM and γH2Ax). (G) The dependence of pATM and γH2Ax activation on the presence of DPCs. Cells were either treated with 400 μM of FA for 15 min, UV (1mJ/cm2), or the combination of FA treatment followed by UV treatment, and left to recover for 15, 30 and 60 min. Actin was used as a loading control. (H) DPCs pose a steric obstacle to the activation of γH2Ax. DPC degradation, by SPRTN, is critical for the activation of γH2Ax in the vicinity of DPCs.
Figure 7.
Figure 7.
DPC repair leads to lower proliferation and DNA breaks. (A) DPC content obtained from cells treated with 400 and 800 μM FA for indicated treatment duration. DPCs were isolated by the STAR assay, quantified using the BCA assay, and normalized to untreated control. (B) The impact of FA treatment in a time and concentration-dependent manner was evaluated by cell counting. Cells were treated with FA for indicated concentration and length of time, counted by microscopy, and normalized to untreated controls. (C) Cell viability was assessed by trypan blue staining. Data presented are normalized cell counts to the total number of cells for the particular treatment conditions. (D) Repeating the same experimental setup as in (B), with 2 h treatment as a positive control for DPC induction, the efficiency of DPC resolving was evaluated. DPCs were isolated using the STAR assay and the results were normalized to untreated control. Statistics presented are results of Dunnett's multiple comparisons test. (E) The same experimental setup was used in order to evaluate the induction of DNA breaks by FA treatment. Using the harshest treatment (800 μM FA), an alkaline comet assay was performed and the results presented belong to three biological replicates with at least 100 cells included in the evaluation (* in 24 h treatment 68 apoptotic cells were excluded from the quantification). Representative comets are shown below. The statistic presented are results of Dunnett's T3 multiple comparisons test. (F) Immunoblot probing for γH2Ax in TCLs from the same experimental setup. Actin was used as a loading control. (G) Immunoblot of γH2Ax and cell cycle markers: cyclin A and D1, and phosphorylated form of histone H3 (S10); in cells treated with different concentrations of FA with or without recovery. Actin was used as a loading control. Symbols for different test significance levels are assigned as follows: not significant (ns) for P > 0.05, * P < 0.05, ** P < 0.001, *** P < 0.0001 and **** P < 0.00001. All data for measured variables were expressed as mean ± SD. The sample size was n = 3 containing biological replicates.

References

    1. Chesner L.N., Campbell C.. A quantitative PCR-based assay reveals that nucleotide excision repair plays a predominant role in the removal of DNA-protein crosslinks from plasmids transfected into mammalian cells. DNA Repair (Amst.). 2018; 62:18–27. - PMC - PubMed
    1. Smith K.C. Dose dependent decrease in extractability of DNA from bacteria following irradiation with ultraviolet light or with visible light plus dye. Biochem. Biophys. Res. Commun. 1962; 8:157–163. - PubMed
    1. Fielden J., Ruggiano A., Popović M., Ramadan K.. DNA protein crosslink proteolysis repair: from yeast to premature ageing and cancer in humans. DNA Repair (Amst.). 2018; 71:198–204. - PMC - PubMed
    1. Hu Q., Klages-Mundt N., Wang R., Lynn E., Kuma Saha L., Zhang H., Srivastava M., Shen X., Tian Y., Kim H.et al. .. The ARK assay is a sensitive and versatile method for the global detection of DNA-protein crosslinks. Cell Rep. 2020; 30:1235–1245. - PMC - PubMed
    1. Ide H., Nakano T., Shoulkamy M.I., Salem A.M.H.. Formation, repair, and biological effects of DNA–Protein cross-link damage. Advances in DNA Repair. InTech. 2015; 43–80.

Publication types