. 2023 Jun;165(5):722-740.
doi: 10.1111/jnc.15773. Epub 2023 Feb 16.

Antiretroviral treatment reveals a novel role for lysosomes in oligodendrocyte maturation

Affiliations

Antiretroviral treatment reveals a novel role for lysosomes in oligodendrocyte maturation

Lindsay K Festa et al. J Neurochem. 2023 Jun.

Abstract

White matter deficits are a common neuropathologic finding in neurologic disorders, including HIV-associated neurocognitive disorders (HAND). In HAND, the persistence of white matter alterations despite suppressive antiretroviral (ARV) therapy suggests that ARVs may be directly contributing to these impairments. Here, we report that a frontline ARV, bictegravir (BIC), significantly attenuates remyelination following cuprizone-mediated demyelination, a model that recapitulates acute demyelination, but has no impact on already formed mature myelin. Mechanistic studies utilizing primary rat oligodendrocyte precursor cells (OPCs) revealed that treatment with BIC leads to significant decrease in mature oligodendrocytes accompanied by lysosomal deacidification and impairment of lysosomal degradative capacity with no alterations in lysosomal membrane permeability or total lysosome number. Activation of the endolysosomal cation channel TRPML1 prevents both lysosomal deacidification and impairment of oligodendrocyte differentiation by BIC. Lastly, we show that deacidification of lysosomes by compounds that raise lysosomal pH is sufficient to prevent maturation of oligodendrocytes. Overall, this study has uncovered a critical role for lysosomal acidification in modulating oligodendrocyte function and has implications for neurologic diseases characterized by lysosomal dysfunction and white matter abnormalities.

Keywords: ART; HAND; lysosome; oligodendrocyte; remyelination.


Conflict of interest statement

Conflict of Interest statement

The authors declare no competing financial interest

Figures
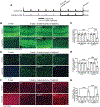
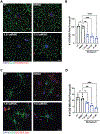
Figure 1.
Figure 1.. Bictegravir significantly inhibits remyelination following toxin-mediated demyelination in the corpus callosum.
(A) Schematic depicting the cuprizone-mediated demyelination experiment. (B) Representative images of FluoroMyelin Green staining in the corpus callosum of control and cuprizone-fed animals treated with DMSO or bictegravir (BIC). (C) A significant attenuation in remyelination, as observed via a reduction in FluoroMyelin Green staining, was seen in mice fed cuprizone for 5 weeks and treated once daily with BIC during the recovery period compared to mice treated with only DMSO; *p<0.05, ****p<0.0001. (D) Representative images of mature oligodendrocyte (aspartoacylase; ASPA+) staining in the corpus callosum of control and cuprizone-fed mice. (E) Fewer mature oligodendrocytes (ASPA+) were found after the remyelination period in BIC-treated, cuprizone fed mice compared to vehicle-treated counterparts; ****p<0.0001. (F) Representative images of OPC (Neural/glial antigen 2; NG2+) staining in the corpus callosum in control and cuprizone-fed mice. (G) There were significantly more OPCs (NG2+) after remyelination in animals treated with BIC compared to vehicle-treated counterparts, suggesting an impairment of OPC’s ability to differentiate into mature oligodendrocytes; *****p<0.0001. Scale bar = 50μm. One-way ANOVA followed by Tukey’s post-hoc test. Each data point represents a single animal and data are expressed as mean ± SEM with 4–5 animals per group. All data normalized to 8-week control-fed, untreated mice.
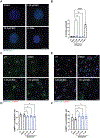
Figure 2.
Figure 2.. Bictegravir does not prolong the neuroinflammatory response caused by cuprizone.
(A) Representative images of astrocyte (glial fibrillary acidic protein; GFAP+) and microglia (ionized calcium binding adaptor molecule 1; Iba1+) reactivity in the corpus callosum of control and cuprizone-fed mice treated with DMSO or bictegravir (BIC). (B) 5 weeks of cuprizone feeding results in a significant increase in microglia reactivity that resolves following a 3-week recovery period regardless of treatment; ****p<0.0001. (C) Similar to microglia, astrocyte reactivity is significantly upregulated following cuprizone-mediated demyelination and is dampened at the end of remyelination. This is unaffected by treatment with BIC; ****p<0.0001. Scale bar = 50μm. One-way ANOVA followed by Tukey’s post-hoc test. Each data point represents a single animal and data are expressed as mean ± SEM with 4–5 animals per group. All data normalized to 8-week control diet, untreated mice.
Figure 3.
Figure 3.. Oligodendrocyte differentiation is inhibited by bictegravir in vitro.
(A) Schematic depicting in vitro treatment paradigm where purified rat OPCs are treated at the time of differentiation for 72 hours. Created with BioRender.com (B) Representative images of immature (galactocerebroside; GalC+) and mature oligodendrocyte (proteolipid protein; PLP+) staining following 72-hour differentiation in the presence of DMSO or various physiologically relevant concentrations of bictegravir (BIC). (C) Treatment with BIC resulted in significant decreases in the percentage of immature oligodendrocytes (GalC+) across all three concentrations tested; **p<0.01, ***p<0.001. (D) As with GalC, there was a reduction in the percentage of mature oligodendrocytes (PLP+) following treatment with BIC; **p<0.01, ***p<0.001. (E) No changes were observed in overall cell number (DAPI+) between vehicle and BIC-treated cultures. (F) Representative staining of cultures for the OPC marker A2B5 in vehicle and BIC-treated groups. (G) No significant changes in OPC (A2B5+) numbers were observed across all three concentrations of BIC; this contrasts with cells that were kept in growth media and allowed to proliferate for an additional 72 hours (Undiff). Scale bar=50 μm. One-way ANOVA followed by Tukey’s post-hoc test. Each data point depicts a biological replicate and all data normalized to and expressed as a percentage of untreated; N=3.
Figure 4.
Figure 4.. Bictegravir inhibits myelin protein production only at the highest concentration tested.
(A) Representative western blots from cultures treated with vehicle or bictegravir (BIC) for 72 hours and probed for the major myelin protein, myelin basic protein (MBP), and α-tubulin as a loading control. (B) A significant decrease in MBP protein was only seen at the highest concentration of BIC (41 μm) while no changes were observed at 1.35 and 13.5 μm; **p<0.01. (C) Representative western blots from vehicle and BIC-treated cultures that were assessed for the major myelin protein, proteolipid protein (PLP), and α-tubulin as a loading control. (D) Similar to MBP, a significant decrease in PLP was only observed at the highest concentration of BIC compared to vehicle-treated cells; **p<0.01. One-way ANOVA followed by Tukey’s post-hoc test. Each data point represents a biological replicate and all data normalized to untreated and expressed as relative fold change; N=3.
Figure 5.
Figure 5.. Bictegravir alters cell viability only at the highest concentration.
(A) OPC cultures treated at the time of differentiation with DMSO or bictegravir (BIC) at the time of differentiation and then assessed for apoptotic cell death via TUNEL staining. (B) Significant apoptotic cell death was only observed with 41 μM BIC after 72 hours of treatment. DNase was used as a positive control for the TUNEL assay; **p<0.01, ****p<0.0001. (C) Differentiated oligodendrocyte cultures treated with DMSO or BIC were assessed for overall cell viability using propidium iodide staining. There was a significant decrease in cell viability only at the 41 μM BIC; *p<0.05. Scale bar=50 μm. One-way ANOVA followed by Tukey’s post-doc test. Each data point represents a biological replicate and all data normalized to untreated; N=3 for TUNEL and N=4 for PI.
Figure 6.
Figure 6.. Bictegravir alters lysosomal pH in OPCs and oligodendrocytes.
(A) Representative images of cells treated at the time of differentiation with DMSO or bictegravir (BIC) and incubated with LysoTracker Red for 30 mins and stained for galactocerebroside (GalC). (B) The number of LysoTracker Red puncta per GalC+ cell was significantly decreased across all three concentrations of BIC compared to vehicle-treated cultures; ****p<0.0001. (C) OPC cultures were treated at the time of differentiation for 72 hrs, incubated with LysoTracker Red, and then stained for A2B5. (D) The number of acidic organelles was significantly decreased in the 13.5 and 41 μm BIC treatment groups in OPCs (A2B5+) compared to vehicle-treated cells; **p<0.01. (E) Lysosomal pH was assessed using LysoSensor Yellow/Blue following treatment with DMSO or BIC for 72 hours. Significant lysosomal de-acidification occurred in the 13.5 and 41 μm BIC treatment groups while no change was observed in the 1.35 μm group; **p<0.01, ****p<0.0001. Scale bar=10 μm. One-way ANOVA followed by Tukey’s post-hoc test. Each data point represents a biological replicate; N=3.
Figure 7.
Figure 7.. Bictegravir impairs lysosomal proteolytic activity in OPCs and oligodendrocytes.
(A) Differentiated oligodendrocytes treated with either DMSO or bictegravir (BIC) were incubated with DQ-BSA Red for 6 hours and then stained for galactocerebroside (GalC). (B) The number of proteolytically active lysosomes were significantly decreased in immature/mature oligodendrocytes following treatment with BIC; **p<0.01, ***p<0.001, ****p<0.0001. (C) Cells treated with DMSO or BIC were incubated with DQ-BSA Red for 6 hours and stained for the OPC marker A2B5. (D) There were fewer proteolytically active lysosomes in OPCs (A2B5+) treated with BIC compared to vehicle-treated cultures; *p<0.05, **p<0.01, ***p<0.001. Scale bar=10 μm. One-way ANOVA followed by Tukey’s post-hoc test. Each data points represents a biological replicate; N=3.
Figure 8.
Figure 8.. Lysosomal membrane permeability and total lysosome number are not altered by bictegravir.
(A) OPC cultures were treated with DMSO or bictegravir (BIC) at the time of differentiation for 72 hrs and then stained for galectin 3 (Gal3), a marker of lysosomal membrane damage. (B) The number of Gal3+ puncta in BIC-treated cultures were not significantly different from untreated or vehicle-treated cells. Two-hour treatment with Leu-Leu methyl ester hydrobromide (LLOMe) resulted in a large number of perinuclear localized Gal3+ puncta. (C) Following 72 hrs of DMSO or BIC treatment, cells were stained for the lysosomal membrane protein LAMP1 and the immature/mature oligodendrocyte marker galactocerebroside (GalC). (D) Treatment with BIC did not alter the overall number of lysosomes in GalC+ cells. (E) In a similar manner, cells treated with DMSO or BIC were stained for LAMP1 and the OPC marker A2B5. (F) As with immature/mature oligodendrocytes, BIC treatment did not change the total number of lysosomes in OPCs (A2B5+). Scale bar=10μm. One-way ANOVA followed by Tukey’s post-hoc test. Each data point represents a single biological replicate; N=3.
Figure 9.
Figure 9.. Lysosomal de-acidification is sufficient to prevent oligodendrocyte maturation.
(A) OPC cultures were treated with bafilomycin A (Baf A) at the time of differentiation for 72 hours and then lysosomal pH was measured using LysoSensor Yellow/Blue. There was a stepwise increase in lysosomal pH as the concentration of bafilomycin A increased; **p<0.01, ****p<0.0001. (B) Cultures were treated with various concentrations of bafilomycin A during differentiation and stained for galactocerebroside (GalC) and proteolipid protein (PLP) as immature and mature oligodendrocyte markers, respectively. (C) The percentage of GalC+ (immature oligodendrocytes) was significantly decreased in all three concentrations of bafilomycin A tested; *p<0.05, ***p<0.001, ****p<0.0001. (D) Similarly, the percentage of mature oligodendrocytes (PLP+) were significantly decreased across all three concentrations of bafilomycin A; *p<0.05, ***p<0.001, ****p<0.0001. (E) No changes were observed in overall cell number (DAPI+) at any concentration of bafilomycin A. (F) OPC cultures were treated with bafilomycin A at the time of differentiation for 72 hrs and stained for the OPC marker A2B5. (G) There was a significant decrease in the percentage of OPCs (A2B5+) at 500 and 750 pM bafilomycin A compared to vehicle-treated cultures. Scale bar= 50 μM. One-way ANOVA followed by Tukey’s post-hoc test. Each data point represents a biological replicate and all data normalized to untreated; N=3.
Figure 10.
Figure 10.. Activation of the lysosomal cation channel TRPML1 prevents bictegravir-mediated lysosomal de-acidification and inhibiting of oligodendrocyte maturation.
(A) Co-administration of the TRPML1 agonist, MLSA1, prevented lysosomal de-acidification induced by bictegravir (BIC) at the 1.35 and 13.5 μM concentration; reacidification also occurred at 41 μM BIC but it did not return to baseline pH; *p<0.05, **p<0.01. (B) OPC cultures were treated at the time of differentiation with DMSO or BIC with or without MLSA1 and then stained for GalC and PLP. (C) Co-treatment with MLSA1 prevented a decrease in the percentage of GalC+ cells at the 1.35 and 13.5 μM BIC; there was also an effect at the 41 μM BIC but this did not return to vehicle treated levels; *p<0.05. (D) Similarly, the percentage of PLP+ cells at the 1.35 and 13.5 μM BIC returned to vehicle-treated levels when cultures were co-treated with MLSA1; *p<0.05. Scale bar=50 μm. Two-way ANOVA followed by Tukey’s multiple comparisons test. Each data point represents a biological replicate and all data normalized to untreated. N=3.

References

    1. Aits S, Kricker J, Liu B, Ellegaard A-M, Hämälistö S, Tvingsholm S, Corcelle-Termeau E, et al. (2015) Sensitive detection of lysosomal membrane permeabilization by lysosomal galectin puncta assay. Autophagy 11, 1408–1424. - PMC - PubMed
    1. Bacmeister CM, Barr HJ, McClain CR, Thornton MA, Nettles D, Welle CG, Hughes EG (2020) Motor learning promotes remyelination via new and surviving oligodendrocytes. Nat. Neurosci - PMC - PubMed
    1. Bae M, Patel N, Xu H, Lee M, Tominaga-Yamanaka K, Nath A, Geiger J, Gorospe M, Mattson MP, Haughey NJ (2014) Activation of TRPML1 clears intraneuronal Aβ in preclinical models of HIV infection. J. Neurosci 34, 11485–11503. - PMC - PubMed
    1. Ballabio A, Bonifacino JS (2020) Lysosomes as dynamic regulators of cell and organismal homeostasis. Nat. Rev. Mol. Cell Biol 21, 101–118. - PubMed
    1. Bankston AN, Forston MD, Howard RM, Andres KR, Smith AE, Ohri SS, Bates ML, Bunge MB, Whittemore SR (2019) Autophagy is essential for oligodendrocyte differentiation, survival, and proper myelination. Glia 67, 1745–1759. - PubMed

Publication types