. 2023 Dec;30(1):2173339.
doi: 10.1080/10717544.2023.2173339.

Oral delivery of bi-autoantigens by bacterium-like particles (BLPs) against autoimmune diabetes in NOD mice

Affiliations

Oral delivery of bi-autoantigens by bacterium-like particles (BLPs) against autoimmune diabetes in NOD mice

Ruifeng Mao et al. Drug Deliv. 2023 Dec.

Abstract

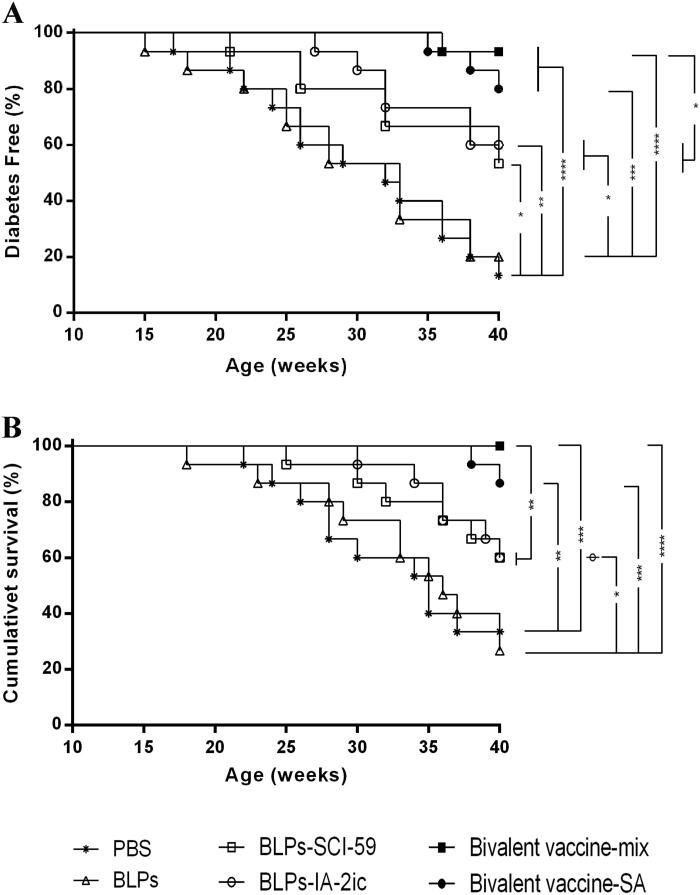
Induction of oral tolerance by vaccination with type 1 diabetes mellitus (T1DM)-associated autoantigens exhibits great potential in preventing and treating this autoimmune disease. However, antigen degradation in the gastrointestinal tract (GIT) limits the delivery efficiency of oral antigens. Previously, bacterium-like particles (BLPs) have been used to deliver a single-chain insulin (SCI-59) analog (BLPs-SCI-59) or the intracellular domain of insulinoma-associated protein 2 (IA-2ic) (BLPs-IA-2ic). Both monovalent BLPs vaccines can suppress T1DM in NOD mice by stimulating the corresponding antigen-specific oral tolerance, respectively. Here, we constructed two bivalent BLPs vaccines which simultaneously deliver SCI-59 and IA-2ic (Bivalent vaccine-mix or Bivalent vaccine-SA), and evaluated whether there is an additive beneficial effect on tolerance induction and suppression of T1DM by treatment with BLPs-delivered bi-autoantigens. Compared to the monovalent BLPs vaccines, oral administration of the Bivalent vaccine-mix could significantly reduce morbidity and mortality in T1DM. Treatment with the bivalent BLPs vaccines (especially Bivalent vaccine-mix) endowed the mice with a stronger ability to regulate blood glucose and protect the integrity and function of pancreatic islets than the monovalent BLPs vaccines treatment. This additive effect of BLPs-delivered bi-autoantigens on T1DM prevention may be related to that SCI-59- and IA-2-specific Th2-like immune responses could be induced, which was more beneficial for the correction of Th1/Th2 imbalance. In addition, more CD4+CD25+Foxp3+ regulatory T cells (Tregs) were induced by treatment with the bivalent BLPs vaccines than did the monovalent BLPs vaccines. Therefore, multiple autoantigens delivered by BLPs maybe a promising strategy to prevent T1DM by efficiently inducing antigen-specific immune tolerance.

Keywords: Type 1 diabetes mellitus; autoantigen; bacterium-like particles; immune tolerance; oral vaccination.


Conflict of interest statement

None of the authors have any conflict of interest related to this work.

Figures

Figure 1.
Figure 1.
Analysis of bivalent BLPs vaccine binding IA-2ic and SCI-59 simultaneously (Bivalent vaccine-SA) by immunofluorescence microscopy. Immunofluorescence (top) and bright-field (bottom) microscopy images of BLPs alone (A) and bivalent BLPs vaccine (B and C). Two equal parts were taken from the obtained bivalent BLPs vaccine. One was revealed by incubation with an anti-IA-2 antibody followed by Alexa Fluor 488-labeled secondary antibody (green, B) and the other one was revealed by incubation with an anti-insulin antibody followed by Alexa Fluor 594-labeled secondary antibody (red, C). A similar analysis was performed for BLPs alone, and no fluorescence signal (green or red) was detected. Scale bar: 5 μm.
Figure 2.
Figure 2.
Effect of different treatments on T1DM in NOD mice. Mice (n = 15 per group) were fed PBS, BLPs, BLPs-SCI-59, BLPs-IA-2ic, Bivalent vaccine-mix, and Bivalent vaccine-SA once daily during the first week and then three times per week in the following 15 weeks. The development of diabetes was monitored until 40 weeks of age by observing the onset of hyperglycemia and the related symptoms. (A) The frequency of diabetes-free mice over time. (B) Survival curve of NOD mice. *p < 0.05, **p < 0.01, ***p < 0.001, ****p < 0.0001.
Figure 3.
Figure 3.
Effect of different treatments on glucose tolerance in NOD mice. At 21 weeks of age, non-diabetic mice in each group (n = 13 in PBS group; n = 13 in BLPs group; n = 14 in BLPs-SCI-59 group; n = 15 in BLPs-IA-2ic group; n = 15 in Bivalent vaccine-mix group; n = 15 in Bivalent vaccine-SA group) were selected for glucose tolerance test. (A) Blood glucose was measured at selected time points after glucose injection. (B) Comparative analysis of blood glucose levels among these groups at 15 min. Data are shown as means ± SD. **p < 0.01, ***p < 0.001, ****p < 0.0001.
Figure 4.
Figure 4.
Effect of different treatments on insulitis and preservation of insulin secretion in NOD mice. (A) Frequency of islets with various grades of insulitis. At the end of the observation period, pancreas samples were obtained from surviving mice in each group (n = 5 in PBS group; n = 4 in BLPs group; n = 9 in BLPs-SCI-59 group; n = 9 in BLPs-IA-2ic group; n = 15 in Bivalent vaccine-mix group; n = 13 in Bivalent vaccine-SA group) for histological examination. At least 20 islets per mouse were analyzed. (B) Serum insulin levels of NOD mice (n = 15 per group). For the mice still alive at the end of the observation period (black dots), the serum insulin levels at 40 weeks of age are recorded and analyzed. For the mice that died during the observation period (red dots), the serum insulin levels at the last week before death are recorded and analyzed. Data are shown as means ± SD. * p < 0.05, ** p < 0.01, **** p < 0.0001.
Figure 5.
Figure 5.
Analysis of serum antigen-specific antibodies among different treatment groups. At 20 weeks of age, serum from all mice (n = 15 per group) was quantified for anti-SCI-59 or anti-IA-2 antibodies and their subtypes, respectively. Data are shown as means ± SD. ** p < 0.01.
Figure 6.
Figure 6.
Effect of different treatments on T cell proliferation. At the end of the observation period (40-week-old), all alive mice in each group (n = 5 in PBS group; n = 4 in BLPs group; n = 9 in BLPs-SCI-59 group; n = 9 in BLPs-IA-2ic group; n = 15 in Bivalent vaccine-mix group; n = 13 in Bivalent vaccine-SA group) were euthanized and subjected to splenocyte proliferation test by simulating with BSA, ConA, SCI-59, and IA-2. For each mouse, at least three independent experiments were performed. Data are shown as means ± SD. ** p < 0.01.
Figure 7.
Figure 7.
ELISPOT analysis of IL-4/IFN-γ-producing T cells. At the end of the observation period (40-week-old), all alive mice in each group (n = 5 in PBS group, n = 4 in BLPs group, n = 9 in BLPs-SCI-59 group, n = 9 in BLPs-IA-2ic group, n = 15 in Bivalent vaccine-mix group, n = 13 in Bivalent vaccine-SA group) were euthanized, and the collected splenocytes (106/well) were stimulated with SCI-59 (A and B) or IA-2 (C and D). T cells producing IFN-γ (A and C) or IL-4 (B and D) were detected. For each mouse, data are representative of at least three independent experiments performed at least three times. For dot plots, each dot represents one mouse. Data are shown as means ± SD. * p < 0.05, ** p < 0.01, **** p < 0.0001.
Figure 8.
Figure 8.
Analysis of serum cytokines among different treatment groups. At the end of the observation period, serum from all mice (n = 15 per group) was quantified for IFN-γ (A), IL-2 (B), IL-4 (C), and IL-10 (D), respectively. For the mice still alive at the end of the observation period (black dots), the serum levels of cytokines at 40 weeks of age are recorded and analyzed. For the mice that died during the observation period (red dots), the serum levels of cytokines at the last week before death are recorded and analyzed. For each mouse, data are representative of at least three independent experiments performed at least three times. For dot plots, each dot represents one mouse. Data are shown as means ± SD. * p < 0.05, ** p < 0.01, *** p < 0.001, **** p < 0.0001.
Figure 9.
Figure 9.
Effect of different treatments on Tregs differentiation. At the end of the observation period (40-week-old), all alive mice in each group (n = 5 in PBS group, n = 4 in BLPs group, n = 9 in BLPs-SCI-59 group, n = 9 in BLPs-IA-2ic group, n = 15 in Bivalent vaccine-mix group, n = 13 in Bivalent vaccine-SA group) were euthanized and subjected to the analysis of the proportion of CD4+CD25+Foxp3+ Tregs in PLNs by flow cytometry (A), and comparison among groups was analyzed (B). For each mouse, at least three independent experiments were performed. Data are shown as means ± SD. * p < 0.05, *** p < 0.001.

Similar articles

Cited by

References

    1. Baidal DA, Warnock M, Xu P, et al. (2022). Oral glucose tolerance test measures of first-phase insulin response and their predictive ability for type 1 diabetes. J Clin Endocrinol Metab 107:1–13. - PMC - PubMed
    1. Bauer W, Gyenesei A, Kretowski A. (2021). The multifactorial progression from the islet autoimmunity to type 1 diabetes in children. Int J Mol Sci 22:7493. - PMC - PubMed
    1. Bluestone JA, Buckner JH, Herold KC. (2021). Immunotherapy: building a bridge to a cure for type 1 diabetes. Science 373:510–6. - PubMed
    1. Bluestone JA, Herold K, Eisenbarth G. (2010). Genetics, pathogenesis and clinical interventions in type 1 diabetes. Nature 464:1293–300. - PMC - PubMed
    1. Bonifacio E, Ziegler AG, Klingensmith G, et al. (2015). Effects of high-dose oral insulin on immune responses in children at high risk for type 1 diabetes: the Pre-POINT randomized clinical trial. Jama 313:1541–9. - PubMed