. 2023 Mar 1;324(3):L373-L384.
doi: 10.1152/ajplung.00268.2022. Epub 2023 Jan 31.

Cigarette smoke depletes alveolar macrophages and delays clearance of Legionella pneumophila

Affiliations

Cigarette smoke depletes alveolar macrophages and delays clearance of Legionella pneumophila

Markus Fleischmann et al. Am J Physiol Lung Cell Mol Physiol. .

Abstract

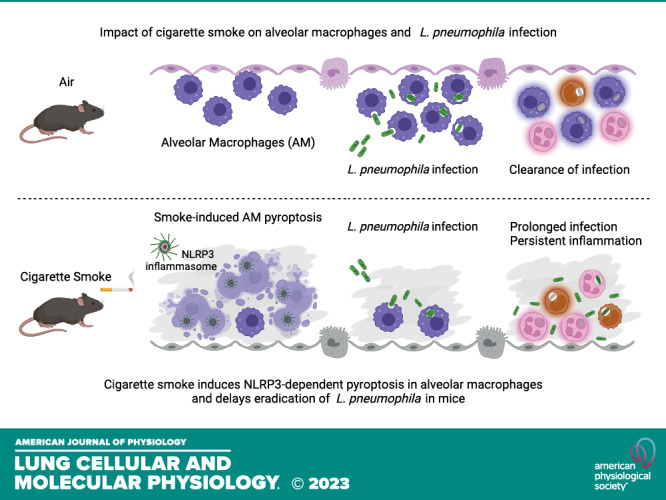
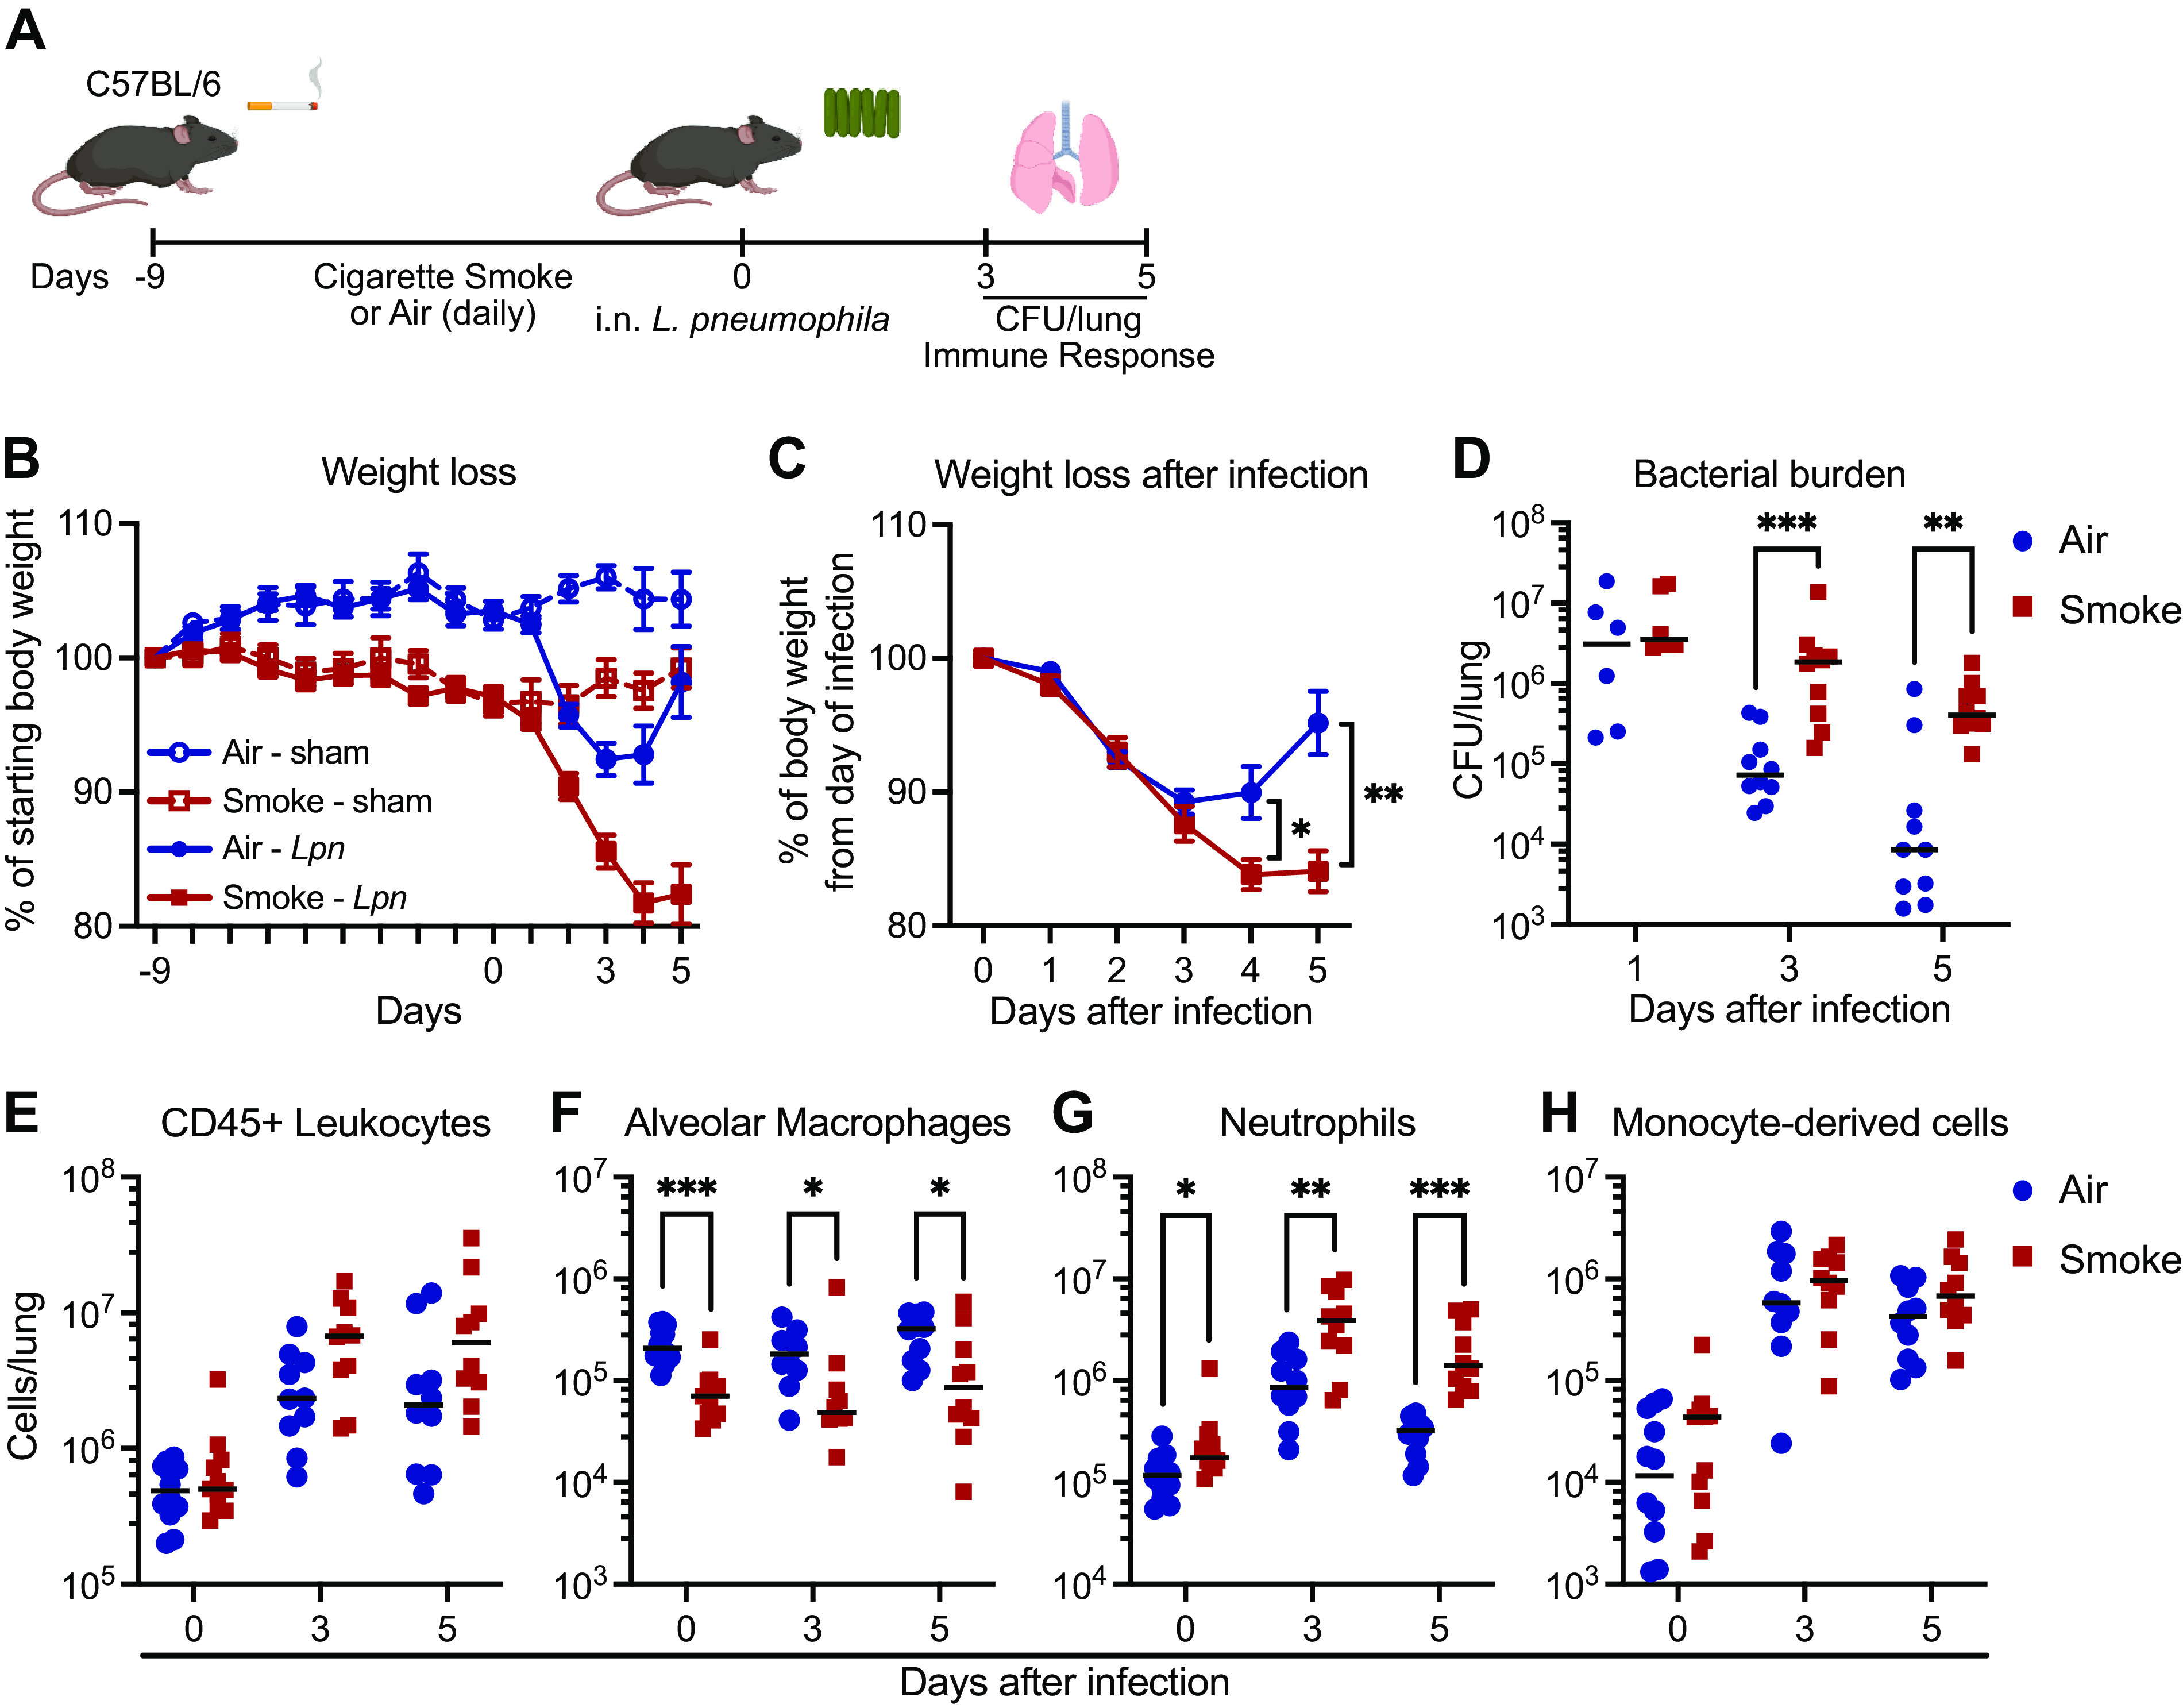
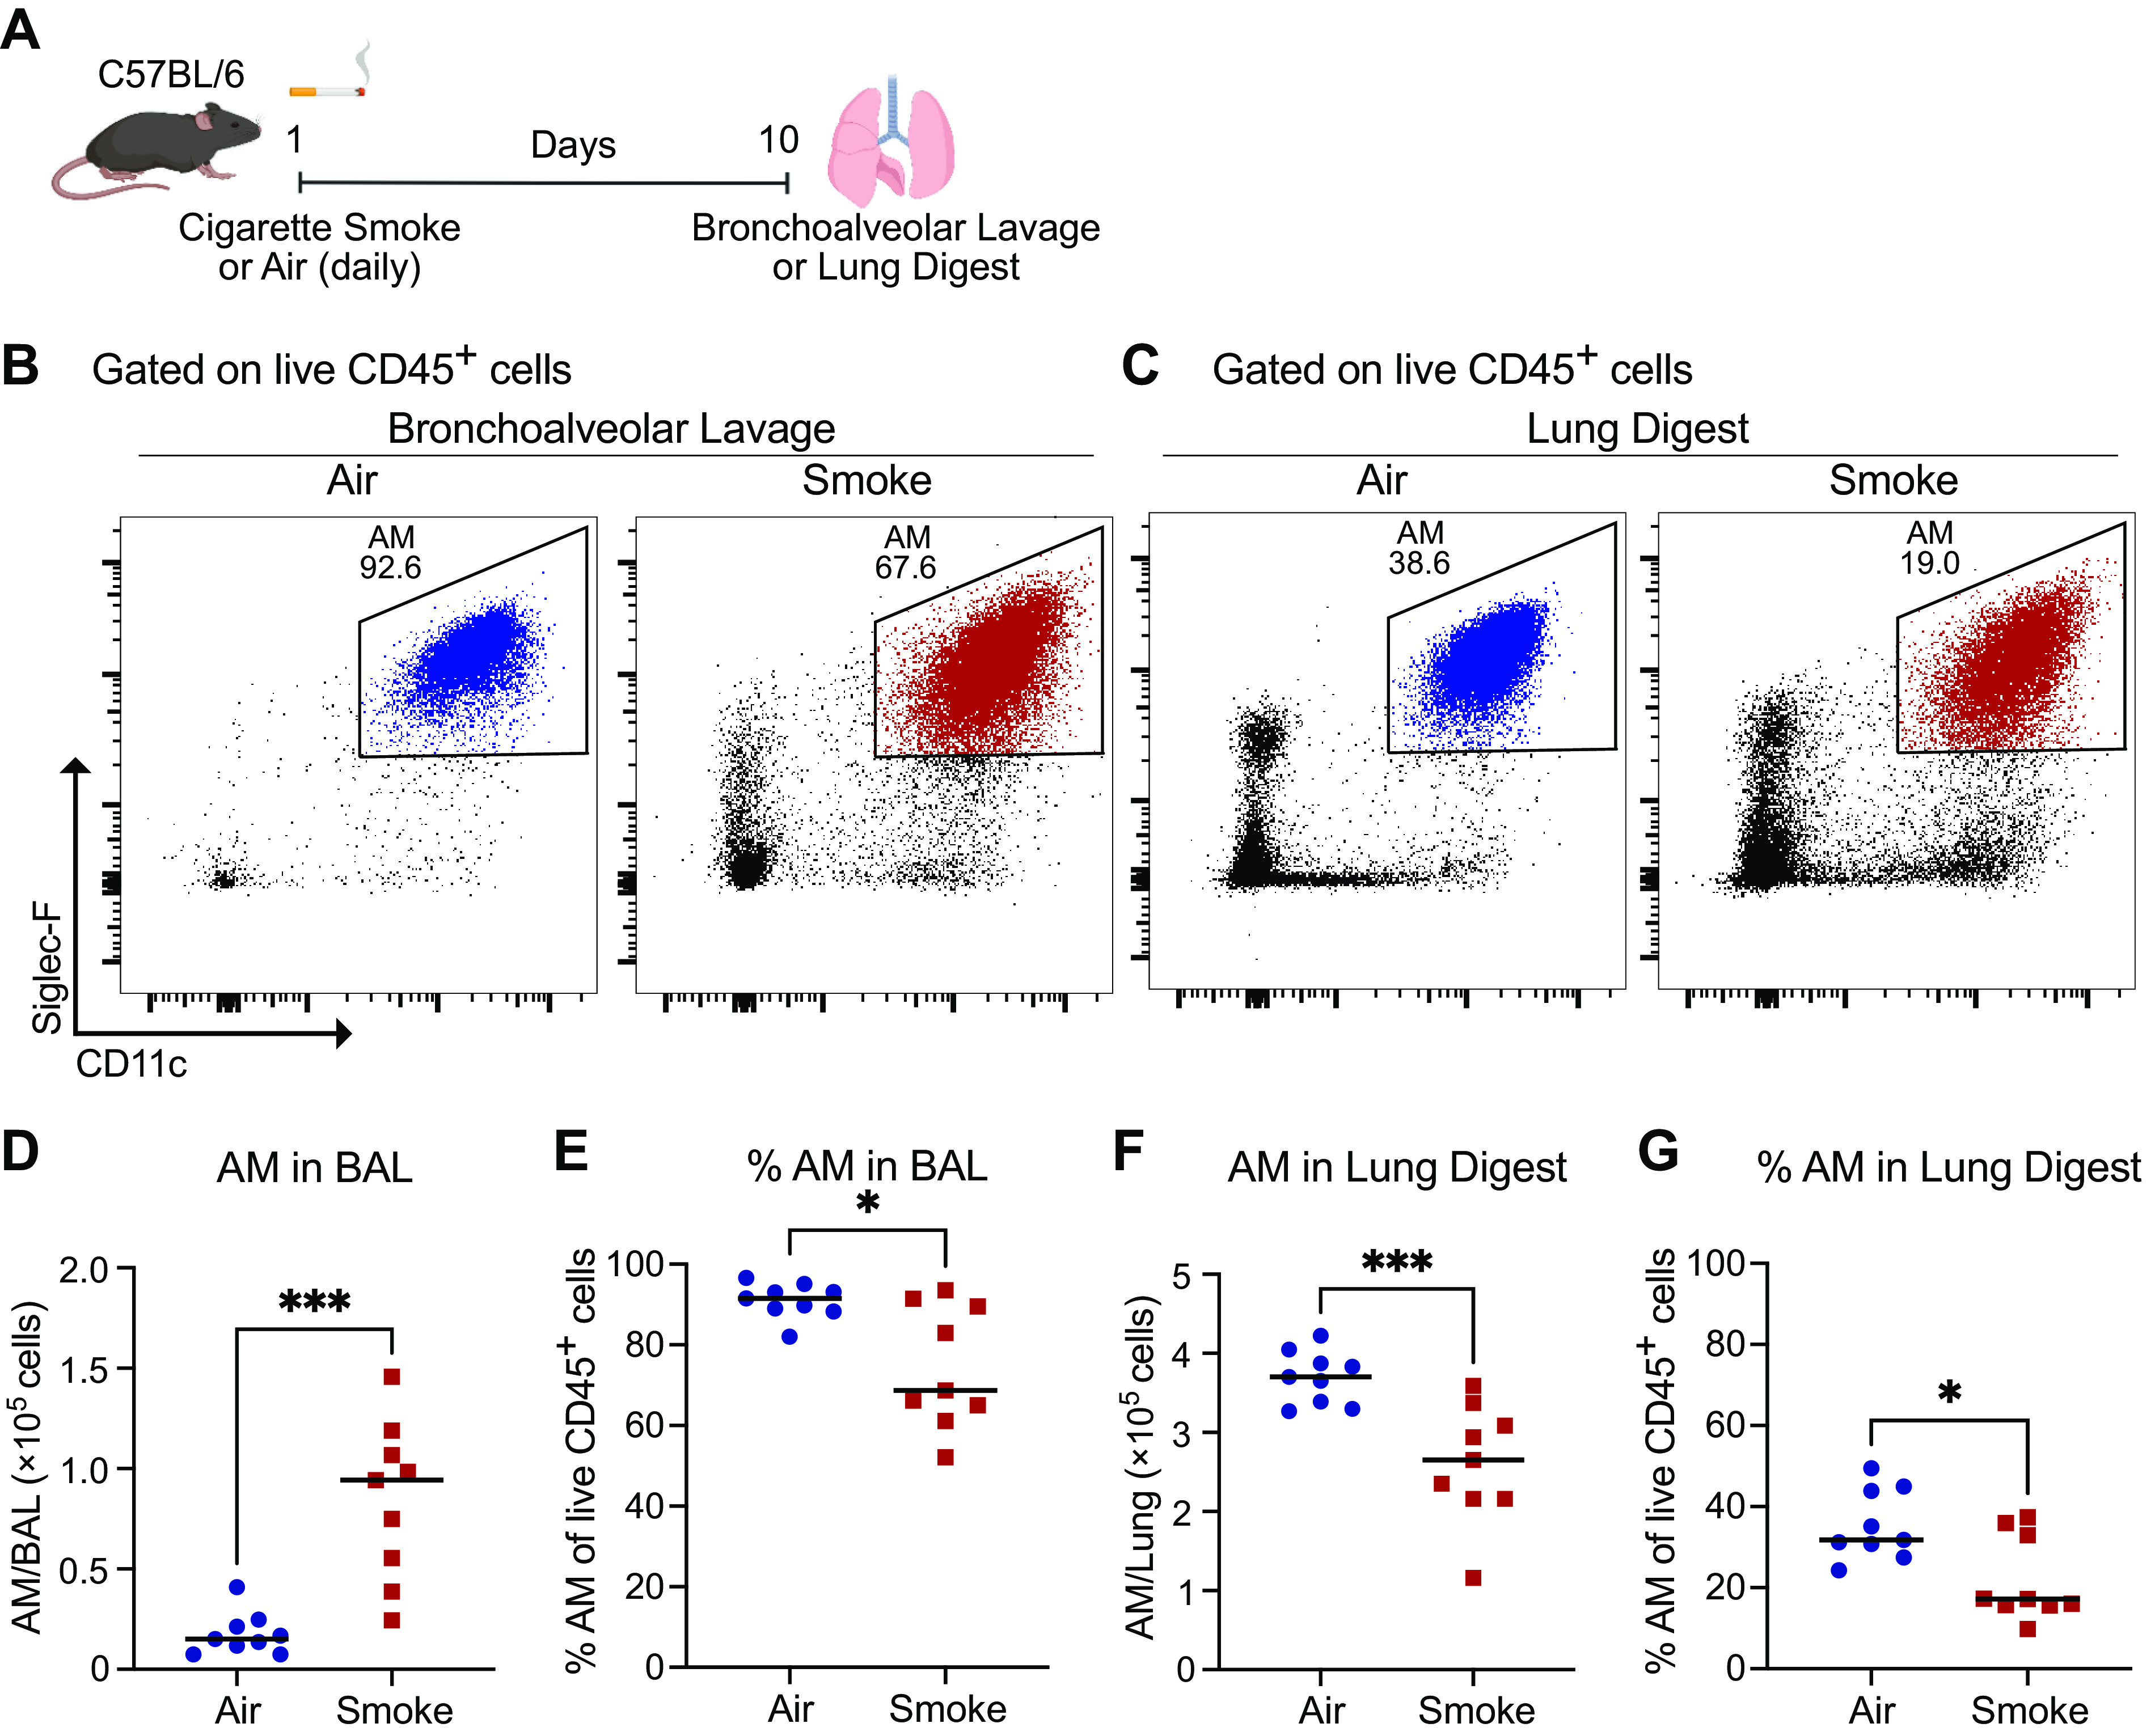
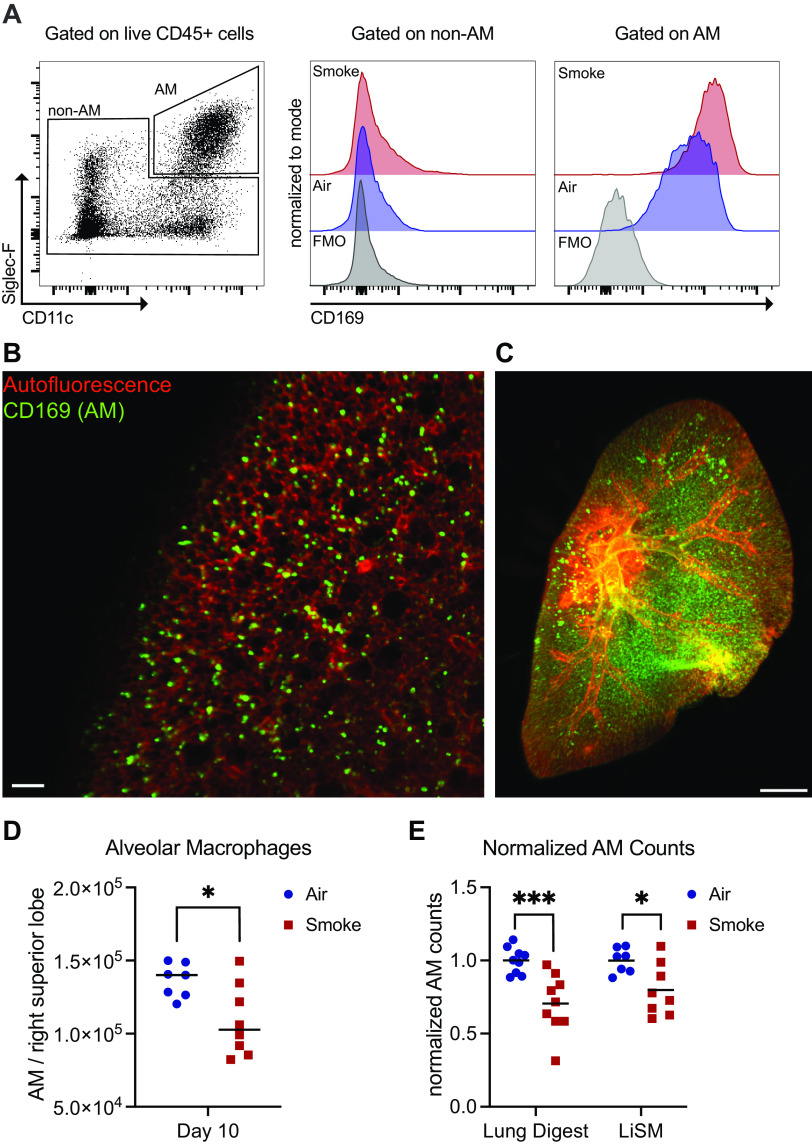
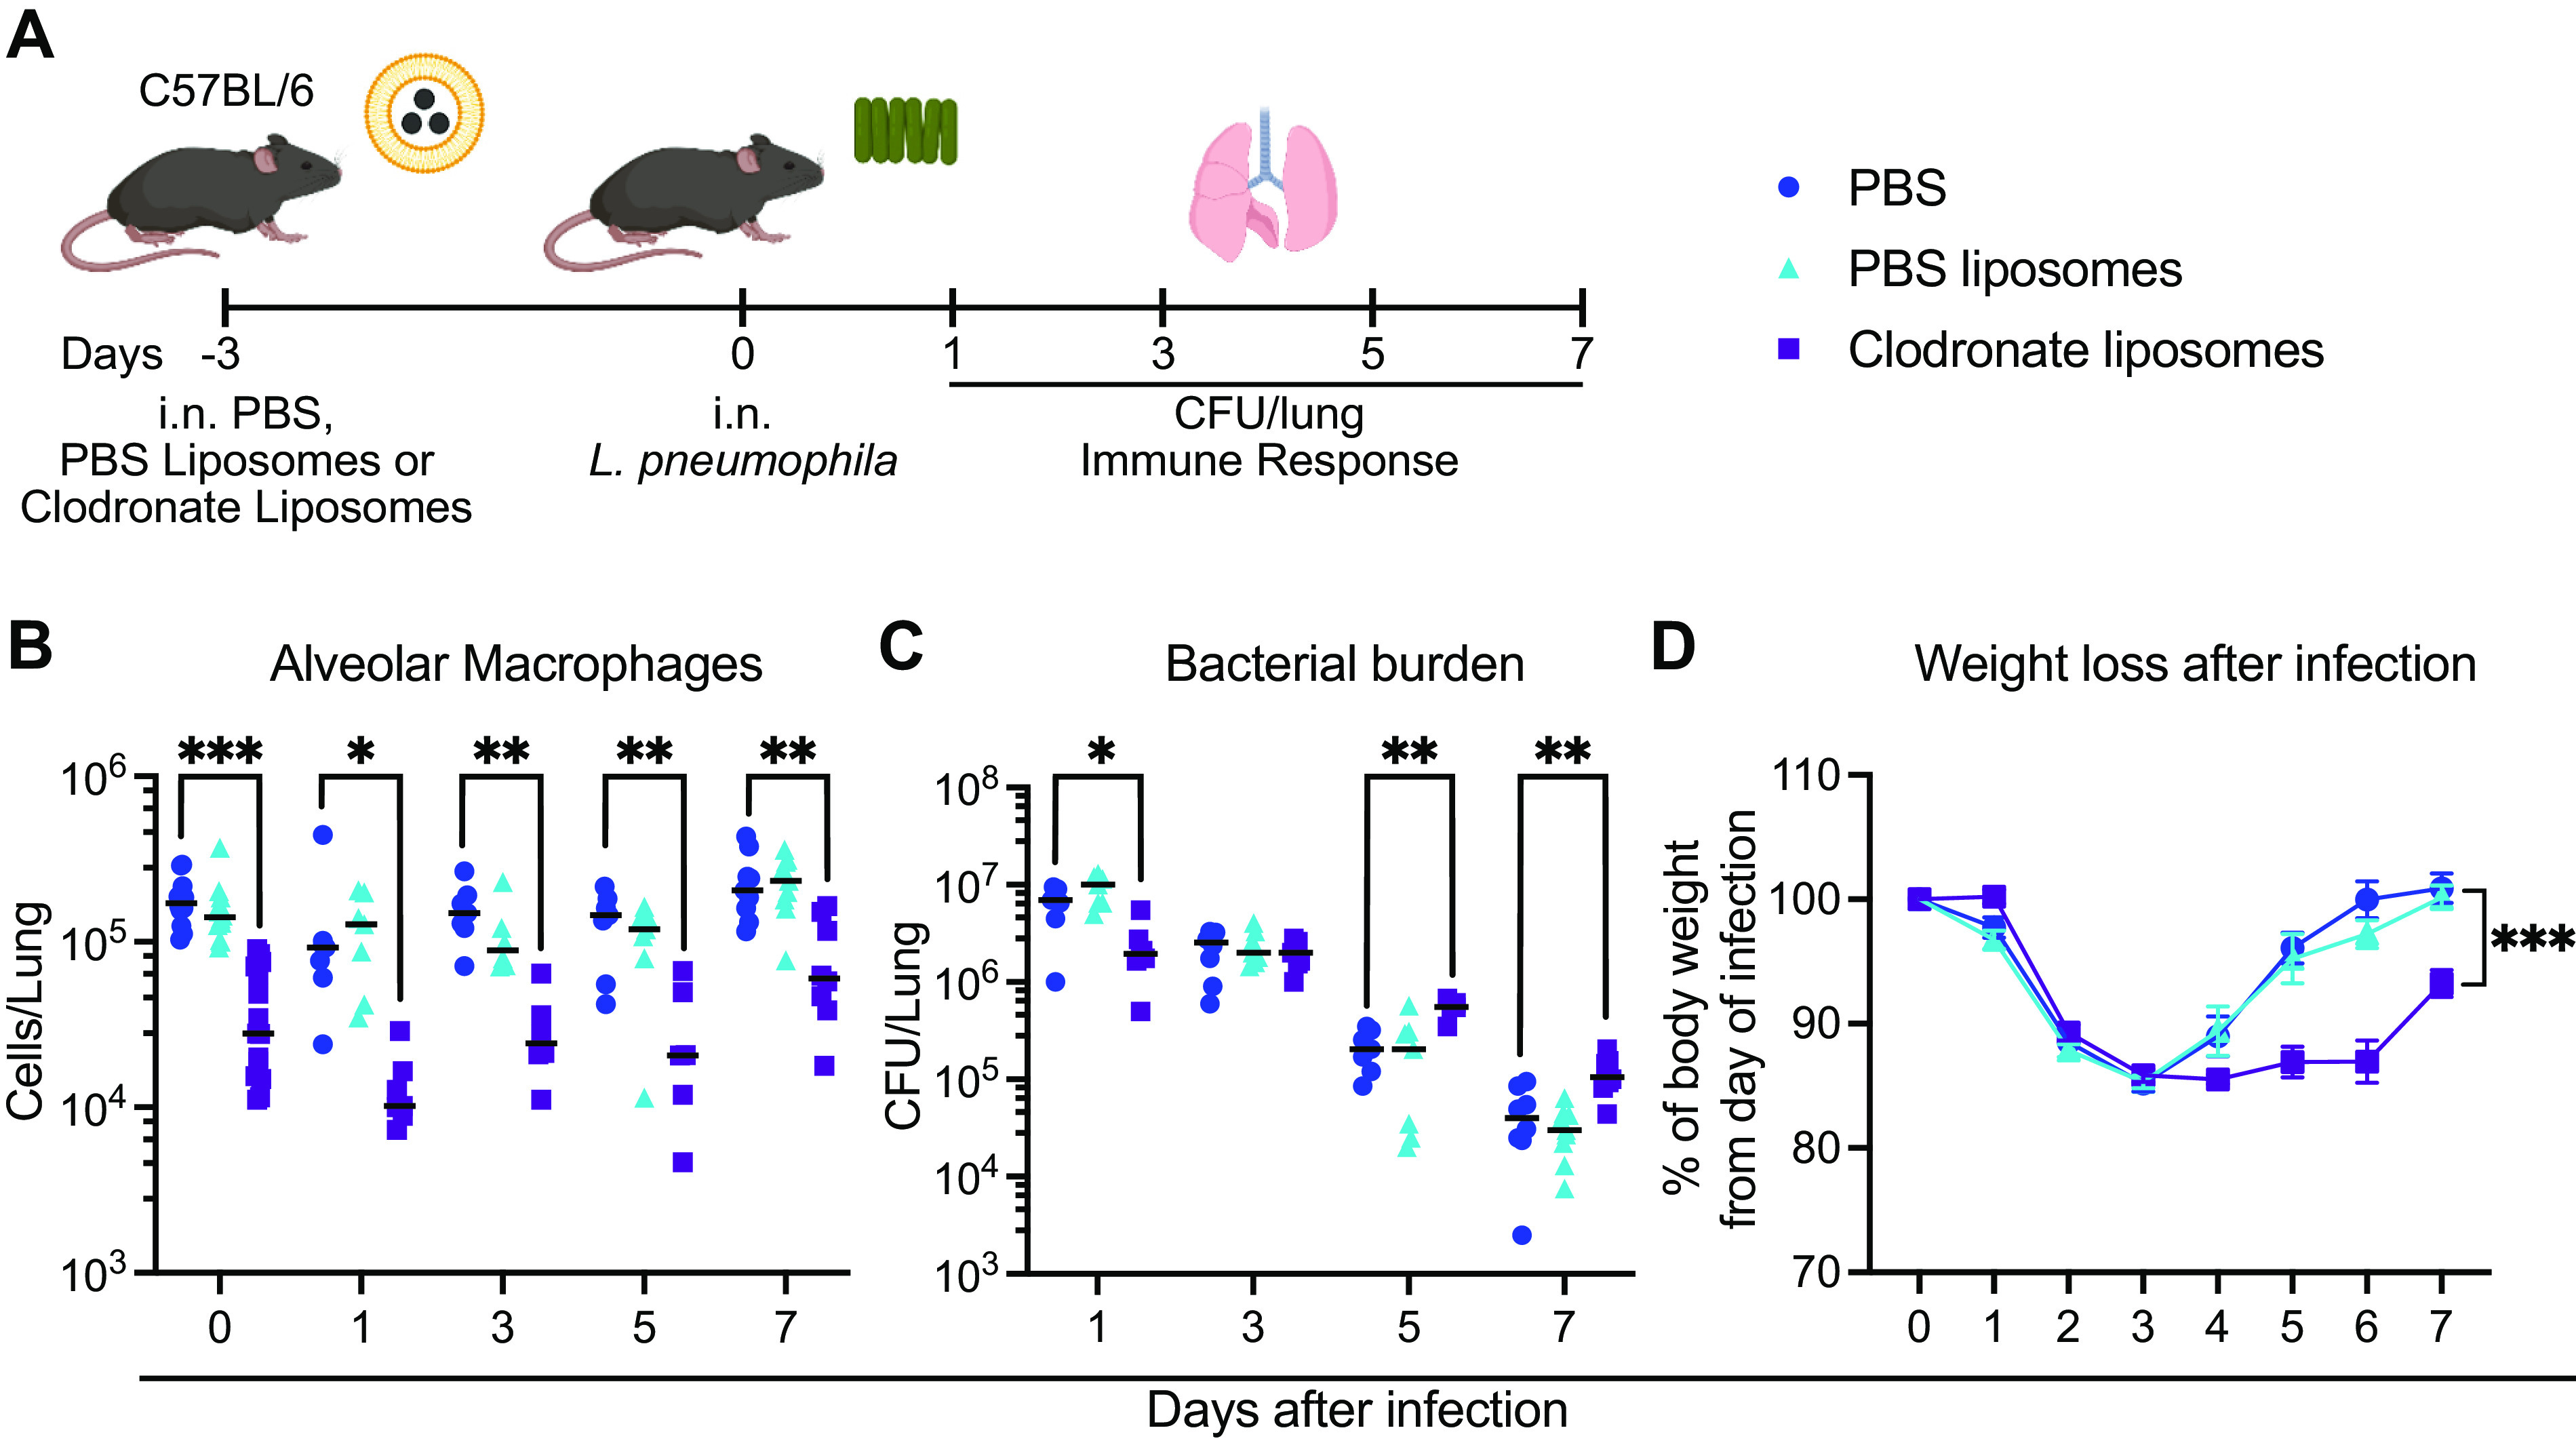
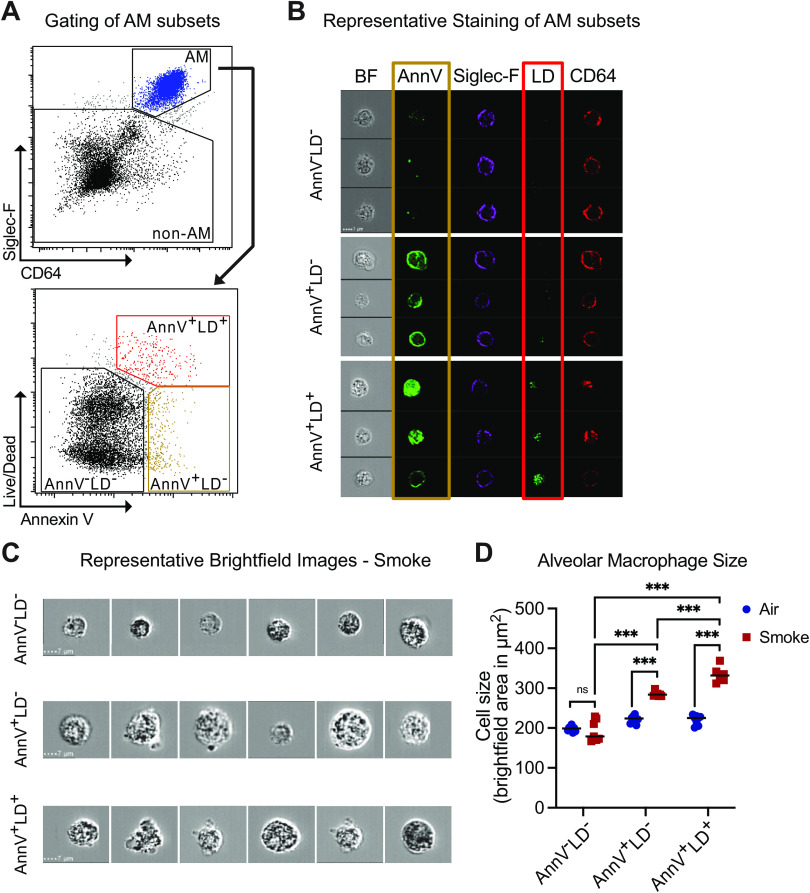
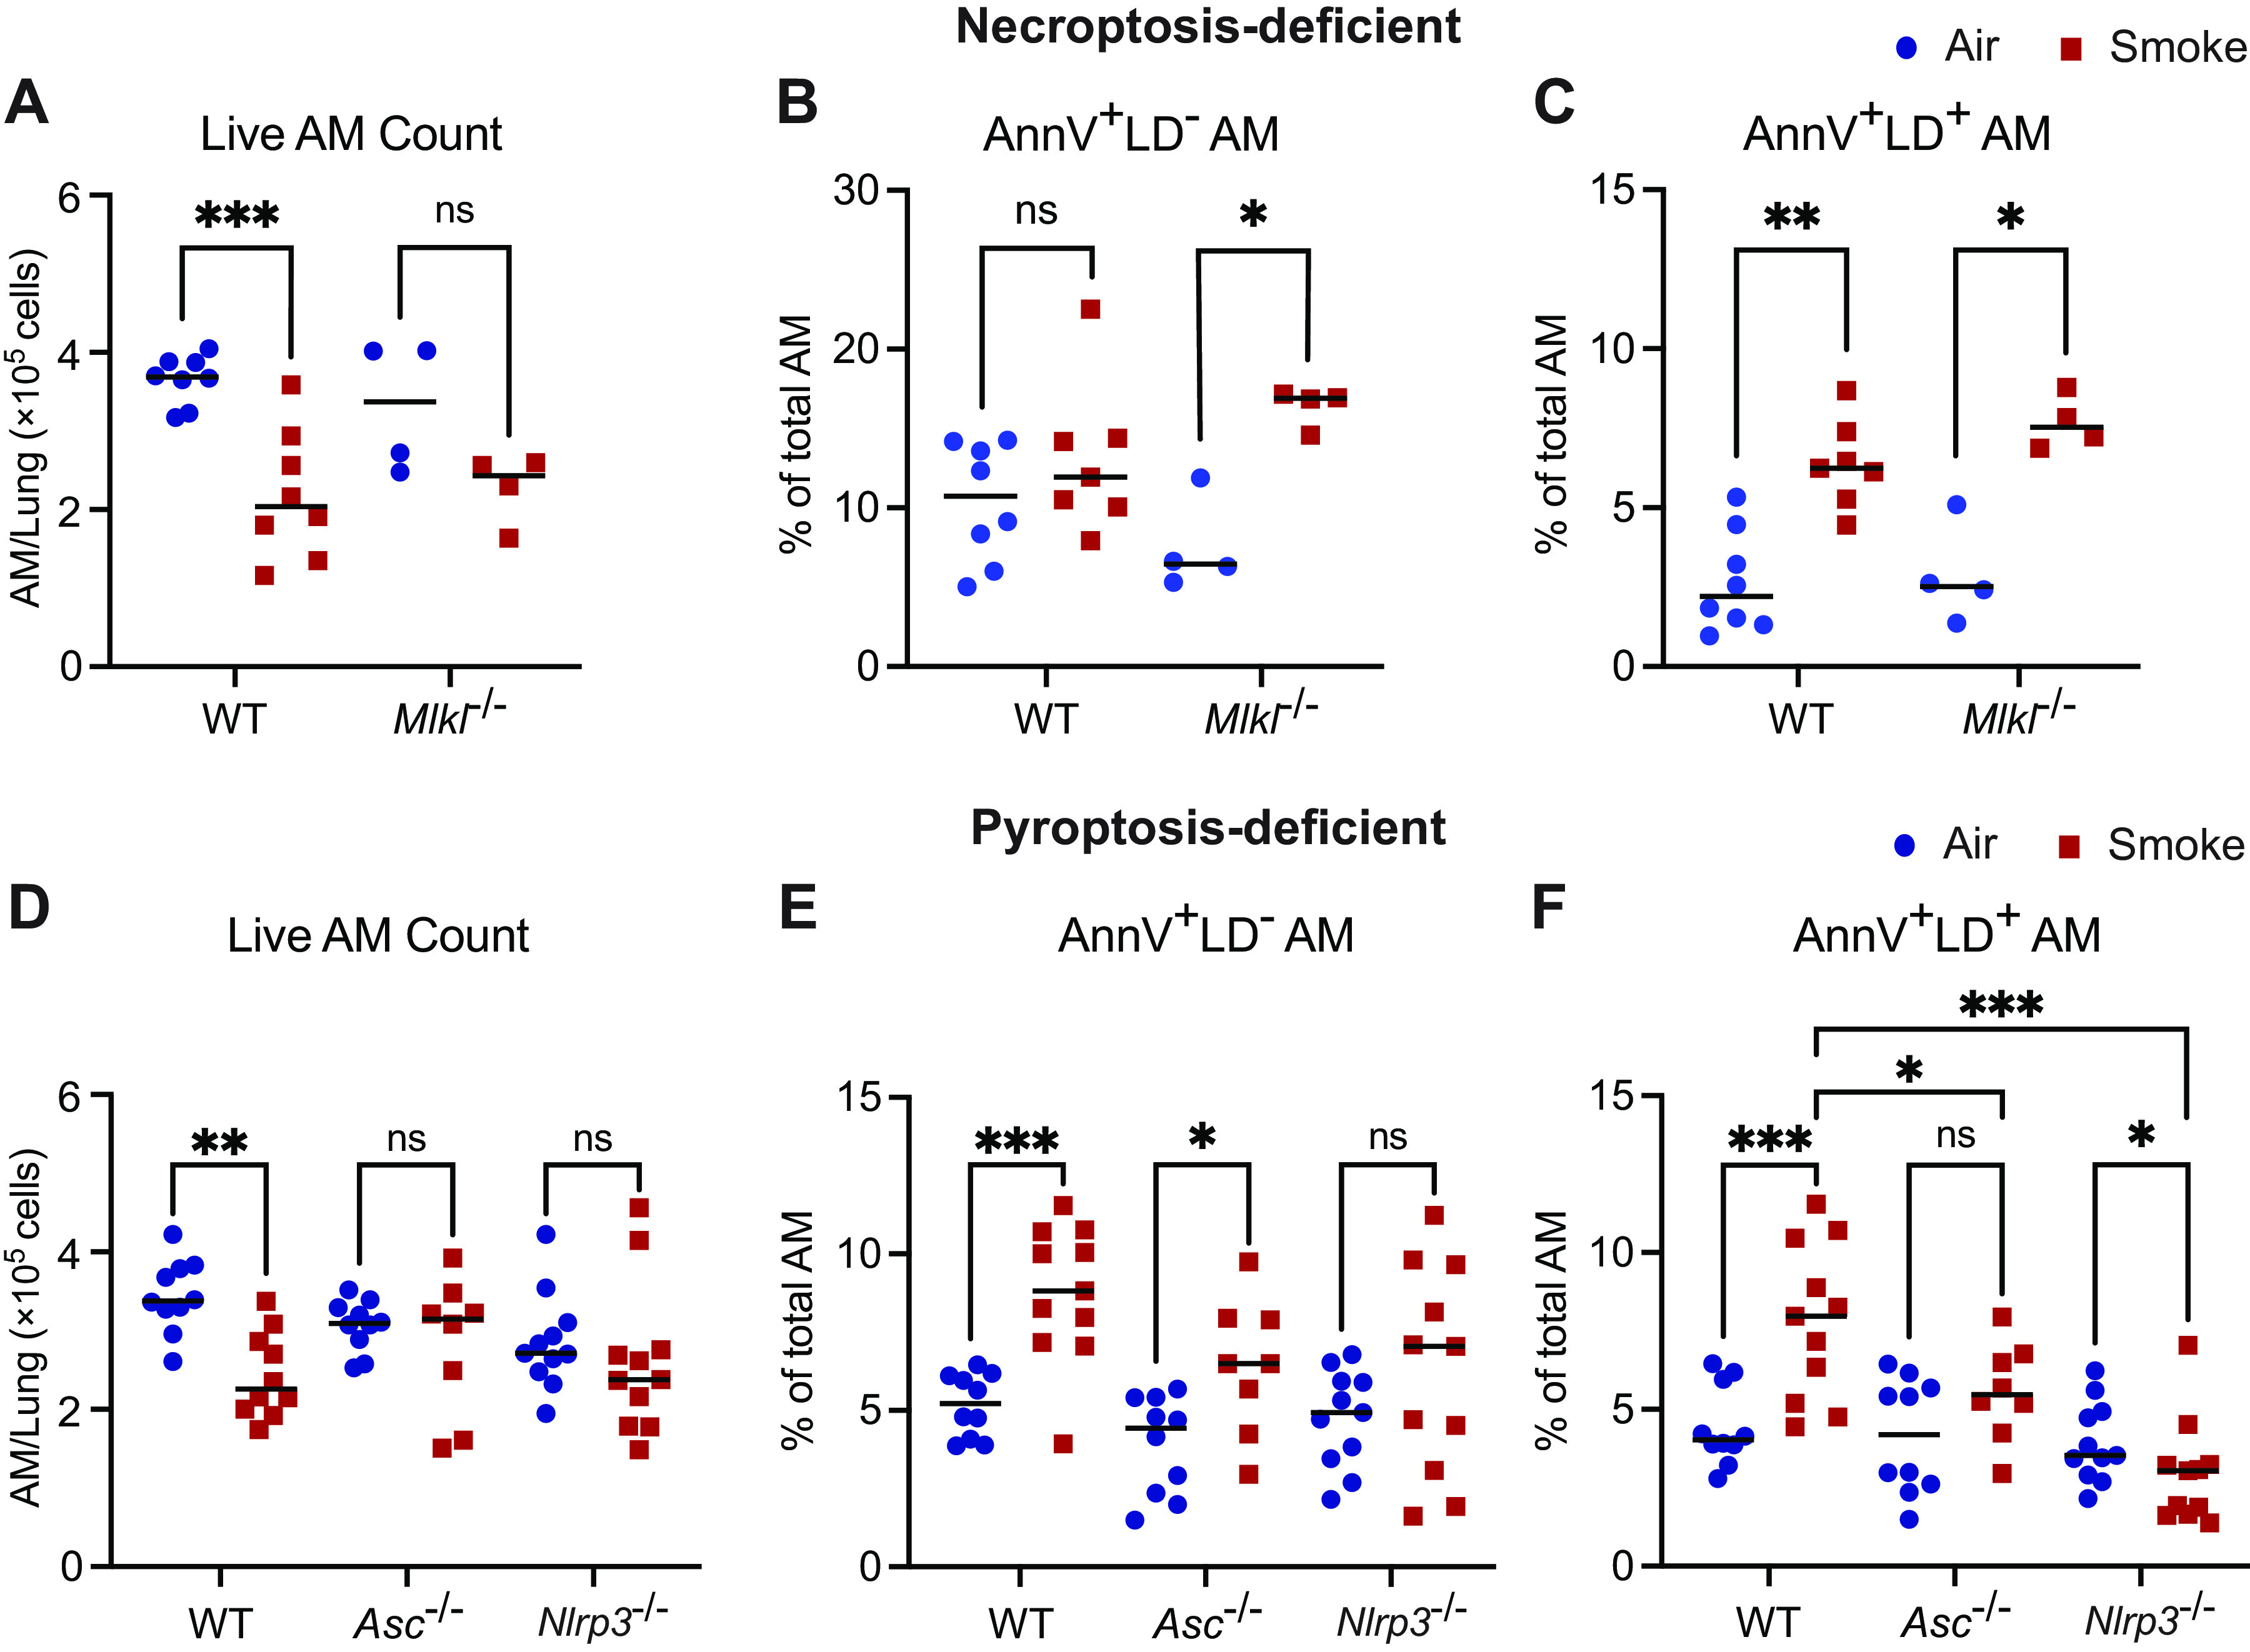
Legionella pneumophila is the main etiological agent of Legionnaires' disease, a severe bacterial pneumonia. L. pneumophila is initially engulfed by alveolar macrophages (AMs) and subvert normal cellular functions to establish a replicative vacuole. Cigarette smokers are particularly susceptible to developing Legionnaires' disease and other pulmonary infections; however, little is known about the cellular mechanisms underlying this susceptibility. To investigate this, we used a mouse model of acute cigarette smoke exposure to examine the immune response to cigarette smoke and subsequent L. pneumophila infection. Contrary to previous reports, we show that cigarette smoke exposure alone causes a significant depletion of AMs using enzymatic digestion to extract cells, or via imaging intact lung lobes by light-sheet microscopy. Furthermore, treatment of mice deficient in specific types of cell death with smoke suggests that NLRP3-driven pyroptosis is a contributor to smoke-induced death of AMs. After infection, smoke-exposed mice displayed increased pulmonary L. pneumophila loads and developed more severe disease compared with air-exposed controls. We tested if depletion of AMs was related to this phenotype by directly depleting them with clodronate liposomes and found that this also resulted in increased L. pneumophila loads. In summary, our results showed that cigarette smoke depleted AMs from the lung and that this likely contributed to more severe Legionnaires' disease. Furthermore, the role of AMs in L. pneumophila infection is more nuanced than simply providing a replicative niche, and our studies suggest they play a major role in bacterial clearance.

Keywords: Legionella pneumophila; alveolar macrophages; cigarette smoking; pyroptosis.


Conflict of interest statement

No conflicts of interest, financial or otherwise, are declared by the authors.

Figures

None
Graphical abstract
Figure 1.
Figure 1.
Cigarette smoke delays clearance of L. pneumophila and induces neutrophil-dominated immune response. A: scheme of concurrent cigarette smoke exposure and L. pneumophila infection. Mice were exposed to cigarette smoke or room air daily for the entire duration of the experiment. On day 0, mice were infected intranasally with 2.5 × 10⁶ CFU L. pneumophila 130 b ΔflaA. At the indicated time points, right lungs were harvested to determine bacterial load and left lungs were used for flow cytometry analysis. B: relative body weight curves (mean ± SE) of smoke- and air-exposed mice, either sham-infected with PBS or infected with L. pneumophila (Lpn). C: relative body weight curves (mean ± SE) of smoke- and air-exposed mice after infection with L. pneumophila. D: at the indicated days after infection, pulmonary bacterial load was determined in smoke- and air-exposed mice. E–H: at the indicated days after infection, total CD45+ leukocytes and indicated immune cell populations were quantified by flow cytometry from single-cell suspensions generated by enzymatic lung digest. For all graphs, data were pooled from two independent experiments (n ≥ 6 mice per group). Group medians are shown in each graph, with each dot representing an individual mouse. *P < 0.05, **P < 0.01, ***P < 0.001, Mann–Whitney U test. [Image created with BioRender.com and published with permission.]
Figure 2.
Figure 2.
Reduced amounts of alveolar macrophages in whole lung digests of cigarette smoke-exposed mice. A: scheme of cigarette smoke exposure. Mice were exposed to cigarette smoke or room air three times per day as described in materials and methods for a period of 10 days. B and C: representative flow cytometry plots identifying AM as CD11c+ Siglec-F+ cells in bronchoalveolar lavage (BAL) and enzymatic lung digests from air- and smoke-treated mice. D and F: AM in BAL and lung digests was enumerated by flow cytometry, and the percentage of AM of total CD45+ leukocytes was calculated (E and G). D–G: for all graphs, data were pooled from two independent experiments. Group medians are shown in each graph, with each dot representing an individual mouse, n = 9 mice per group. *P < 0.05, ***P < 0.001, Mann–Whitney U test. AM, alveolar macrophage. [Image created with BioRender.com and published with permission.]
Figure 3.
Figure 3.
Light-sheet microscopy-based quantitation confirms smoke-induced depletion of alveolar macrophages in vivo. Mice were exposed to cigarette smoke or room air daily for 10 days and single-cell suspensions were generated by enzymatic lung digest. A: representative CD169 expression on AM and non-AM populations in air- and smoke-treated mice, compared with fluorescence minus one control. B: representative z-stack of a partial right superior lung lobe, stained for CD169, and recorded by light-sheet microscopy at high magnification. Green dots represent individual AM and autofluorescence is shown in red. Scale bar, 100 µm. C: representative, software-based three-dimensional (3-D) reconstruction of an entire right superior lung lobe. Green dots represent individual AM and autofluorescence is shown in red. Scale bar, 1,000 µm. D: software-based enumeration of CD169+ AM from 3-D reconstructed right superior lung lobes from air- and smoke-exposed mice. E: comparison of methods used to quantitate AM. Results were normalized for each method by averaging cell counts in the specific air-exposed control group and dividing the cell counts of all air- and smoke-exposed mice by this average. For all graphs, data were pooled from two independent experiments. Group medians (D) and group means (E) are shown, with each dot representing an individual mouse, n ≥ 7 mice per group. *P < 0.05, ***P < 0.001, Mann–Whitney U test. AM, alveolar macrophage.
Figure 4.
Figure 4.
Delayed clearance of Legionella pneumophila in clodronate-treated mice. A: scheme of experimental setup. Mice were treated with PBS, PBS liposomes, or clodronate liposomes intranasally 3 days before intranasal infection with 2.5 × 10⁶ CFU L. pneumophila 130 b ΔflaA. Lungs were harvested at the indicated time points to determine bacterial load and for flow cytometry analysis. B: at the indicated days after infection, alveolar macrophages were quantified by flow cytometry from single-cell suspensions generated by enzymatic lung digest. C: at the indicated days after infection, pulmonary bacterial load was determined. D: body weight curves (mean ± SE) of each group of mice after infection. B–D: for all graphs, data were pooled from two independent experiments (n ≥ 7 mice per group). B and C: group medians are shown in each graph, with each dot representing an individual mouse. *P < 0.05, **P < 0.01, ***P < 0.001, Mann–Whitney U test between PBS and clodronate liposome groups. [Image created with BioRender.com and published with permission.]
Figure 5.
Figure 5.
Cell morphology suggests an inflammatory type of smoke-induced AM death. Mice were exposed to cigarette smoke or room air daily for 10 days. Lung single-cell suspensions were generated and stained for imaging flow cytometry analysis. A: representative gating strategy to classify viable and dead AM by imaging flow cytometry based on staining with AnnexinV and intracellular viability dye. B: representative events for each AM subset, recorded by imaging flow cytometry, including brightfield and fluorescent channels. C: representative brightfield images for each AM subset from smoke-exposed mice. D: cell size (area) of viable and dead AM from air- and smoke-exposed wild-type mice, quantified based on brightfield images recorded for each cell. Data were pooled from two independent experiments (n ≥ 6 mice per group). Group medians are shown in each graph, with each dot representing an individual mouse. ***P < 0.001, Mann–Whitney U test. AM, alveolar macrophage.
Figure 6.
Figure 6.
Pyroptosis contributes to cigarette smoke-induced AM depletion. Mice were exposed to cigarette smoke or room air daily for 10 days. Lung single-cell suspensions were generated for flow cytometry or imaging flow cytometry analysis. A and D: AM counts in lungs from air- and smoke-exposed, wild-type and indicated knockout mice were quantified by flow cytometry. Percentages of AnnV+ LD AM (B and E) and percentages of AnnV+ LD+ AM (C and F) from air- and smoke-exposed, wild-type and indicated knockout mice were determined by imaging flow cytometry. A–C: data are from one experiment (n ≥ 4 mice per group). D–F: data were pooled from two independent experiments (n ≥ 9 mice per group). Group medians are shown in each graph, with each dot representing an individual mouse. A–F: *P < 0.05, **P < 0.01, ***P < 0.001, Mann–Whitney U test to compare air and smoke groups. F: *P < 0.05, ***P < 0.001, one-way ANOVA with Dunnett’s multiple comparison test to compare knockout mice within the smoking group. AM, alveolar macrophage.

Similar articles

Cited by

References

    1. Hussell T, Bell TJ. Alveolar macrophages: plasticity in a tissue-specific context. Nat Rev Immunol 14: 81–93, 2014. doi:10.1038/nri3600. - DOI - PubMed
    1. Garbi N, Lambrecht BN. Location, function, and ontogeny of pulmonary macrophages during the steady state. Pflugers Arch 469: 561–572, 2017. doi:10.1007/s00424-017-1965-3. - DOI - PubMed
    1. McDade JE, Shepard CC, Fraser DW, Tsai TR, Redus MA, Dowdle WR. Legionnaires’ disease: isolation of a bacterium and demonstration of its role in other respiratory disease. N Engl J Med 297: 1197–1203, 1977. doi:10.1056/NEJM197712012972202. - DOI - PubMed
    1. Isberg RR, O'Connor TJ, Heidtman M. The Legionella pneumophila replication vacuole: making a cosy niche inside host cells. Nat Rev Microbiol 7: 13–24, 2009. doi:10.1038/nrmicro1967. - DOI - PMC - PubMed
    1. Newton HJ, Ang DKY, van Driel IR, Hartland EL. Molecular pathogenesis of infections caused by Legionella pneumophila. Clin Microbiol Rev 23: 274–298, 2010. doi:10.1128/CMR.00052-09. - DOI - PMC - PubMed

Publication types

LinkOut - more resources