. 2023 Jan 1;34(1):73-87.
doi: 10.1681/ASN.0000000000000027.

Hypoxia-Inducible Factor 2α Attenuates Renal Ischemia-Reperfusion Injury by Suppressing CD36-Mediated Lipid Accumulation in Dendritic Cells in a Mouse Model

Affiliations

Hypoxia-Inducible Factor 2α Attenuates Renal Ischemia-Reperfusion Injury by Suppressing CD36-Mediated Lipid Accumulation in Dendritic Cells in a Mouse Model

Junwen Qu et al. J Am Soc Nephrol. .

Abstract

Background: Hypoxia and hypoxia-inducible factors (HIFs) play essential and multiple roles in renal ischemia-reperfusion injury (IRI). Dendritic cells (DCs) comprise a major subpopulation of the immunocytes in the kidney and are key initiators and effectors of the innate immune responses after IRI. The role of HIF-2α in DCs remains unclear in the context of renal IRI.

Methods: To investigate the importance of HIF-2α in DCs upon renal IRI, we examined the effects of DC-specific HIF-2α ablation in a murine model. Bone marrow-derived DCs (BMDCs) from DC-specific HIF-2α-ablated mice and wild-type mice were used for functional studies and transcriptional profiling.

Results: DC-specific ablation of HIF-2α led to hyperactivation of natural killer T (NKT) cells, ultimately exacerbating murine renal IRI. HIF-2α deficiency in DCs triggered IFN-γ and IL-4 production in NKT cells, along with upregulation of type I IFN and chemokine responses that were critical for NKT cell activation. Mechanistically, loss of HIF-2α in DCs promoted their expression of CD36, a scavenger receptor for lipid uptake, increasing cellular lipid accumulation. Furthermore, HIF-2α bound directly to a reverse hypoxia-responsive element (rHRE) in the CD36 promoter. Importantly, CD36 blockade by sulfo-N-succinimidyl oleate (SSO) reduced NKT cell activation and abolished the exacerbation of renal IRI elicited by HIF-2α knockout.

Conclusions: Our study reveals a previously unrecognized role of the HIF-2α/CD36 regulatory axis in rewiring DC lipid metabolism under IRI-associated hypoxia. These findings suggest a potential therapeutic target to resolve long-standing obstacles in treatment of this severe complication.


Conflict of interest statement

All authors have nothing to disclose.

Figures

None
Graphical abstract
Figure 1.
Figure 1.
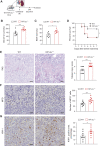
DC-specific HIF-2α deletion exacerbates susceptibility to renal IRI. (A) Experimental schematic of classic renal IRI. (B) Serum creatinine and (C) BUN levels of mice subjected to 20 minutes of renal ischemia-reperfusion injury and euthanized at 24 hours after reperfusion (n=6–7 per group). (D) Survival rate of WT and HIF-2α−/− mice after 20 minutes of renal ischemia (n=10 per group). (E) Left panel: representative PAS-stained renal sections in post-ischemic kidneys harvested at 24 hours after 20 minutes of renal ischemia-reperfusion injury. Scale bar=20 μm. Right panel: semiquantitative analysis of PAS-stained renal sections in WT and HIF-2α−/− mice at 24 hours after IRI. (F) Left panel: representative MPO-stained renal sections in post-ischemic kidneys harvested at 24 hours after 20 minutes of renal ischemia-reperfusion injury. Scale bar=20 μm. Right panel: semiquantitative analysis of MPO-stained renal sections in WT and HIF-2α−/− mice at 24 hours after IRI. (G) Left panel: representative MPO-stained renal sections in post-ischemic kidneys harvested at 24 hours after 20 minutes of renal ischemia-reperfusion injury. Scale bar=20 μm. Right panel: quantitative analysis of KIM-1 immunohistochemistry in renal section in WT and HIF-2α−/− mice at 24 hours after IRI. All data are mean±SEM. *P<0.05; **P<0.01.
Figure 2.
Figure 2.
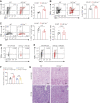
HIF-2α−/− DCs display higher expression of co-stimulatory molecules and migration to the kidney after renal IRI. Surface expression of (A) CD80 and (B) CD86 on DCs from kidneys of WT and HIF-2α−/− mice at 24 hours after 20 minutes of renal ischemia. (n=4–6 per group). (C) Experimental protocol of adoptive transfer followed by renal IRI. BMDCs from WT and HIF-2α−/− mice labeled with CFSE were injected intravenously into C57B6 recipients, followed by renal IRI. After 24 hours of reperfusion, kidneys and spleens were harvested and analyzed by flow cytometry. (D) Representative flow plots (left panel) and summary (right panel) of frequency of WT or HIF-2α−/− DCs (CD11c+CFSE+) in the kidney at 24 hours after 20 minutes of renal ischemia. (E) Representative flow plots (left panel) and summary (right panel) of frequency of WT or HIF-2α−/− DCs (CD11c+CFSE+) in the spleen at 24 hours after 20 minutes of renal ischemia. n=3 per group. All data are mean±SEM. *P<0.05; **P<0.01. MFI, mean fluorescence intensity.
Figure 3.
Figure 3.
NKT cells contribute to exacerbating renal IRI induced by HIF-2α deficiency in DCs. (A) Representative flow plots (left panel) and quantification (right panel) of the percentage of NKT cells in CD45+ cells in the kidney 3 hours after renal IRI (n=4 per group). (B) Representative flow plots (left panel) and quantification (right panel) of the percentage of NKT cells in CD45+ cells in the spleen 3 hours after renal IRI (n=4 per group). (C) Representative flow plots (left panel) and quantification (right panel) of the percentage of CD4+ and CD8+ T cells in CD45+ cells in the kidney 3 hours after renal IRI (n=4 per group). (D) Representative flow plots of the percentage of NK1.1+ TCR-β+ cell in the spleen after anti-NK1.1 monoclonal antibody (PK136, 250 μg) treatment. (E) Representative flow plots of the percentage of NK1.1+ TCR-β+ cell in the kidney after PK136 treatment. (F) Pretreatment of WT and HIF-2α−/− mice with 250 μg PK136 or control IgG, and then mice were subjected to (20 minutes ischemia) renal IRI. Serum creatinine was measured 24 hours after surgery (n=4–5 per group). (G) Representative PAS-stained renal sections at 24 hours after the reperfusion. All data are mean±SEM. **P<0.01; n.s., no significant difference.
Figure 4.
Figure 4.
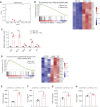
HIF-2α knockout in DCs enhances NKT cell activation. (A) Representative flow cytometric analyses (left panel) of intracellular IFN-γ expression in renal NKT cells and quantification (right panel) of IFN-γ+ in renal NKT cells isolated from WT and HIF-2α−/− mice and 3 hours after renal IRI (n=4 per group). (B and C) Splenocytes from WT and HIF-2α−/− mice were cultured with α-GalCer (100 ng/ml) for 48 hours. Representative flow plots (left panel) and quantification (right panel) of the percentage of IFN-γ+ and IL-4+ cells in NK1.1+ TCR-β+ cells (n=3 per group). (D and E) Levels of IFN-γ and IL-4 and in the culture supernatants for 24 and 48 hours were measured by ELISA (n=6 per group). (F) qPCR analyses for Il12 mRNA expression in BMDCs from WT and HIF-2α−/− mice were primed with α-GalCer (n=3 per group). (G and H) WT and HIF-2α-deficient BMDCs were primed ex vivo with vehicle or α-GalCer and adoptively transferred to WT mice 1 day before surgery. The mice were subjected to 18 minutes of ischemia. Serum creatinine was measured 24 hours after IRI (n=4 per group). All data are mean±SEM. *P<0.05; **P<0.01; ***P<0.001.
Figure 5.
Figure 5.
HIF-2α deficiency induces type I IFN and chemokine responses in DCs. (A) Principal components analysis plot shows the samples of WT and HIF-2α–deficient BMDCs treated with DMOG and α-GalCer. Ellipses and shapes show clustering of the samples. (B) GSEA analysis (left panel) of gene transcripts of WT and HIF-2α–deficient BMDCs treated with DMOG and α-GalCer. Heatmaps (right panel) of the upregulated genes involved in type I IFN signaling pathway. (C) qPCR analysis of mRNA expression of Ifnb1 and representative ISGs in HIF-2α–deficient BMDCs treated with DMOG and α-GalCer (n=3 per group). (D) GSEA analysis (left panel) of gene transcripts of WT and HIF-2α–deficient BMDCs treated with DMOG and α-GalCer. Heatmap (right panel) showing the expression of indicated genes in WT and HIF-2α–deficient BMDCs treated with DMOG and α-GalCer. (E–H) Assessing protein expression of chemokines in WT and HIF-2α–deficient BMDCs treated with DMOG and α-GalCer (n=3 per group). All data are mean±SEM. *P<0.05; **P<0.01; ***P<0.001.
Figure 6.
Figure 6.
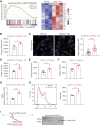
HIF-2α–deficient DCs accumulate more lipids and upregulate CD36. (A) GSEA (left panel) revealing the indicated signatures enriched in HIF-2α–deficient versus WT BMDCs triggered with DMOG and α-GalCer. Heatmap (right panel) shows the changes in gene expression involved in lipid storage in WT and HIF-2α–deficient BMDCs triggered with DMOG and α-GalCer. (B) MFI values illustrating Bodipy 493/503 dye and staining of WT and HIF-2α–deficient BMDCs triggered with DMOG and α-GalCer (n=3 per group). (C) Representative fluorescent confocal images (left) of and quantification (right) of the total lipid droplets per WT and HIF-2α–deficient BMDCs triggered with DMOG and α-GalCer. Scale bar=8 μm. (D) MFI values illustrating Bodipy C16 dye and staining of WT and HIF-2α–deficient BMDCs triggered with DMOG and α-GalCer (n=3 per group). (E and F) Flow cytometry analysis showing Bodipy 493/503 dye and Bodipy C16 staining of splenic and renal DCs from WT and HIF-2α−/− mice 24 hours after renal IRI (n=4–6 per group). (G) qPCR analysis of mRNA expression of CD36 in WT and HIF-2α–deficient BMDCs triggered with DMOG and α-GalCer (n=3 per group). (H) Representative histograms (left) and statistic results (right) showing CD36 levels in WT and HIF-2α–deficient BMDCs triggered with DMOG and α-GalCer (n=3 per group). (I) Schematic diagram (left panel) showing the rHRE in the upstream sequence of the mouse CD36 promoter. ChIP assays (right panel) with the anti-HIF-2α antibody or IgG using BMDCs. PCR primers amplified a fragment flanking the rHRE of CD36 promoter. All data are mean±SEM. *P<0.05; **P<0.01; n.s., no significant difference.
Figure 7.
Figure 7.
CD36 blockade reduces lipid accumulation in HIF-2α–deleted DCs and reverses the exacerbation of renal IRI. Flow cytometric analysis of (A) Bodipy 493/503 dye and (B) Bodipy C16 staining of WT and HIF-2α–deficient BMDCs after treatment with DMOG and α-GalCer in the presence or absence of SSO (50 μM; n=3 per group). (C) WT and HIF-2α–deficient BMDCs primed and with DMOG and α-GalCer±SSO were cocultured with WT splenic NKT cells for 36 hours. Then, supernatant was collected, and IFN-γ levels were measured by ELISA (n=3 per group). qPCR analysis of (D) Il12 and (E–H) Ifnb1 and representative ISG mRNA in BMDCs from WT and HIF-2α−/− mice after stimulation with DMOG and α-GalCer in the presence or absence of SSO (n=3 per group). (I–K) Levels of CXCL10, CXCL16, and CCL2 in the culture supernatants of WT and HIF-2α–deficient BMDCs after treatment with DMOG and α-GalCer in the presence or absence of SSO (n=3 per group). (L) WT and HIF-2α–deficient BMDCs after treatment with DMOG in the presence or absence of SSO for 24 hours and adoptively transferred to WT mice 1 day before surgery. The recipients were subjected to 20 minutes of ischemia followed by 24 hours of reperfusion. Plasma creatinine was measured 24 hours after IRI (n=5–6 per group). All data are mean±SEM. *P<0.05; **P<0.01; ***P<0.001; n.s., no significant difference.
Figure 8.
Figure 8.
A proposed model demonstrated that in hypoxic DCs, stabilized HIF-2α repressed CD36 expression by directly binding to an rHRE sequence in CD36 promoter. Loss of HIF-2α promotes the expression of CD36-mediated lipid uptake and lipid accumulation in hypoxic DCs, thus contributing to overactivation of NKT cells.

References

    1. Smith SF, Hosgood SA, Nicholson ML: Ischemia-reperfusion injury in renal transplantation: 3 key signaling pathways in tubular epithelial cells. Kidney Int 95: 50–56, 2019 - PubMed
    1. Tammaro A, Kers J, Scantlebery AML, Florquin S: Metabolic flexibility and innate immunity in renal ischemia reperfusion injury: The fine balance between adaptive repair and tissue degeneration. Front Immunol 11: 1346, 2020 - PMC - PubMed
    1. Gonsalez SR, Cortês AL, Silva RCD, Lowe J, Prieto MC, Silva Lara LD: Acute kidney injury overview: From basic findings to new prevention and therapy strategies. Pharmacol Ther 200: 1–12, 2019 - PMC - PubMed
    1. Kezić A, Stajic N, Thaiss F: Innate immune response in kidney ischemia/reperfusion injury: Potential target for therapy. J Immunol Res 2017: 6305439, 2017 - PMC - PubMed
    1. Dai H, Thomson AW, Rogers NM: Dendritic cells as sensors, mediators, and regulators of ischemic injury. Front Immunol 10: 2418, 2019 - PMC - PubMed

Publication types

MeSH terms

Substances

LinkOut - more resources