. 2023 Jan;131(1):17010.
doi: 10.1289/EHP11257. Epub 2023 Jan 31.

Accumulation of Black Carbon Particles in Placenta, Cord Blood, and Childhood Urine in Association with the Intestinal Microbiome Diversity and Composition in Four- to Six-Year-Old Children in the ENVIR ON AGE Birth Cohort

Affiliations

Accumulation of Black Carbon Particles in Placenta, Cord Blood, and Childhood Urine in Association with the Intestinal Microbiome Diversity and Composition in Four- to Six-Year-Old Children in the ENVIR ON AGE Birth Cohort

Thessa Van Pee et al. Environ Health Perspect. 2023 Jan.

Abstract

Background: The gut microbiome plays an essential role in human health. Despite the link between air pollution exposure and various diseases, its association with the gut microbiome during susceptible life periods remains scarce.

Objectives: In this study, we examined the association between black carbon particles quantified in prenatal and postnatal biological matrices and bacterial richness and diversity measures, and bacterial families.

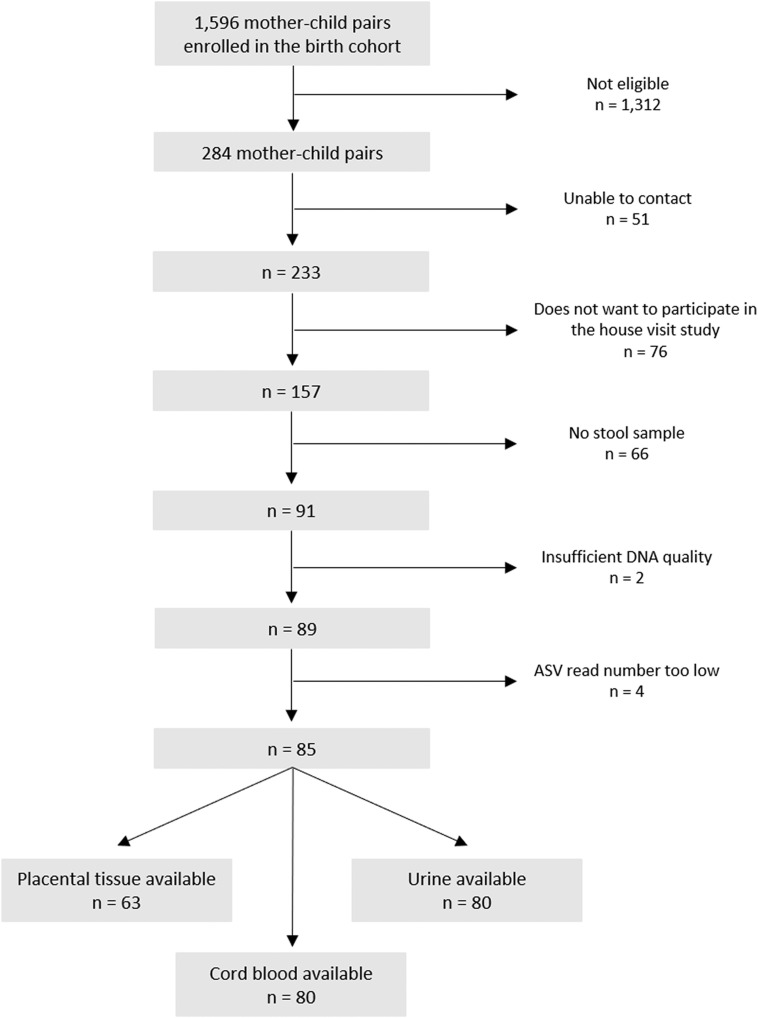
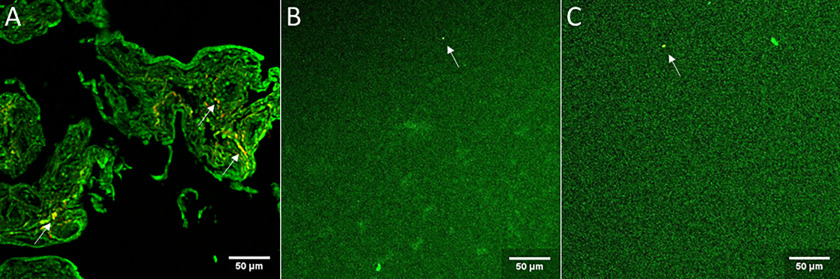
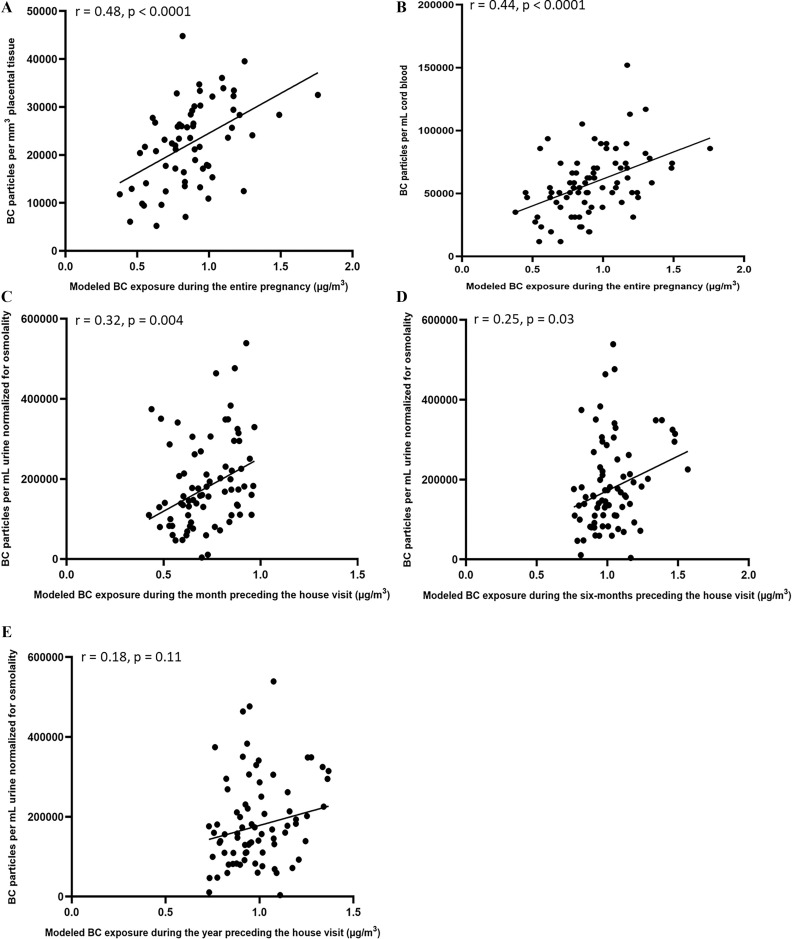
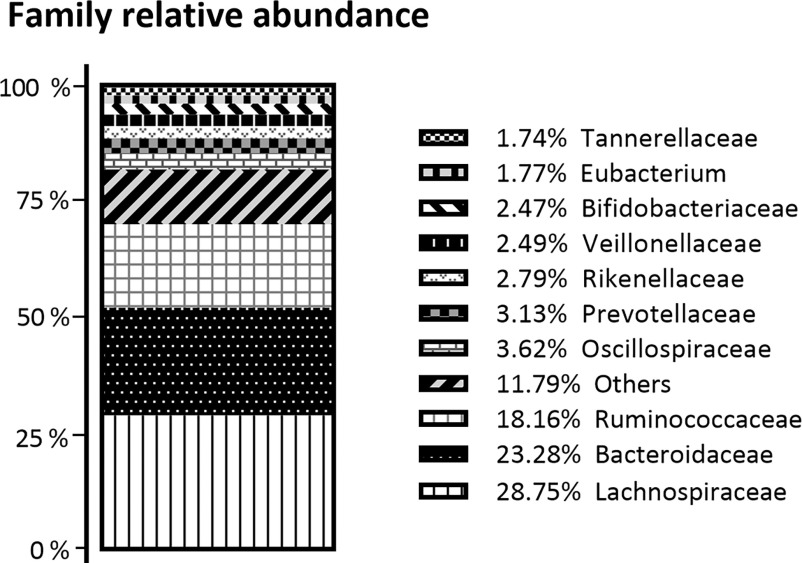
Methods: A total of 85 stool samples were collected from 4- to 6-y-old children enrolled in the ENVIRonmental influence ON early AGEing birth cohort. We performed 16S rRNA gene sequencing to calculate bacterial richness and diversity indices (Chao1 richness, Shannon diversity, and Simpson diversity) and the relative abundance of bacterial families. Black carbon particles were quantified via white light generation under femtosecond pulsed laser illumination in placental tissue and cord blood, employed as prenatal exposure biomarkers, and in urine, used as a post-natal exposure biomarker. We used robust multivariable-adjusted linear models to examine the associations between quantified black carbon loads and measures of richness (Chao1 index) and diversity (Shannon and Simpson indices), adjusting for parity, season of delivery, sequencing batch, age, sex, weight and height of the child, and maternal education. Additionally, we performed a differential relative abundance analysis of bacterial families with a correction for sampling fraction bias. Results are expressed as percentage difference for a doubling in black carbon loads with 95% confidence interval (CI).

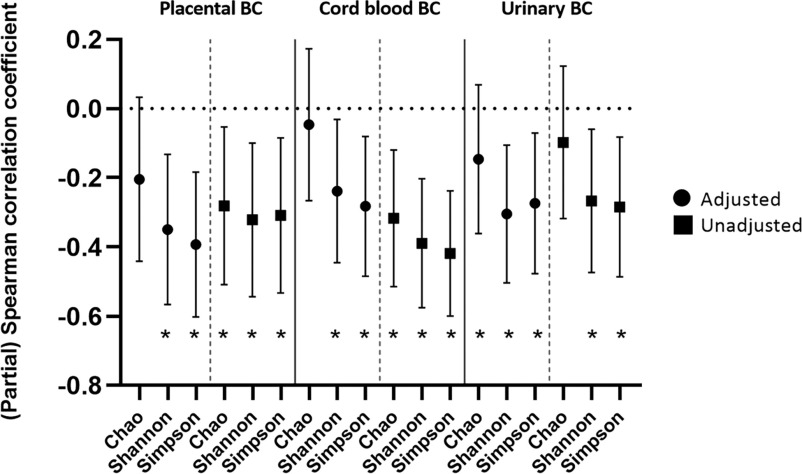
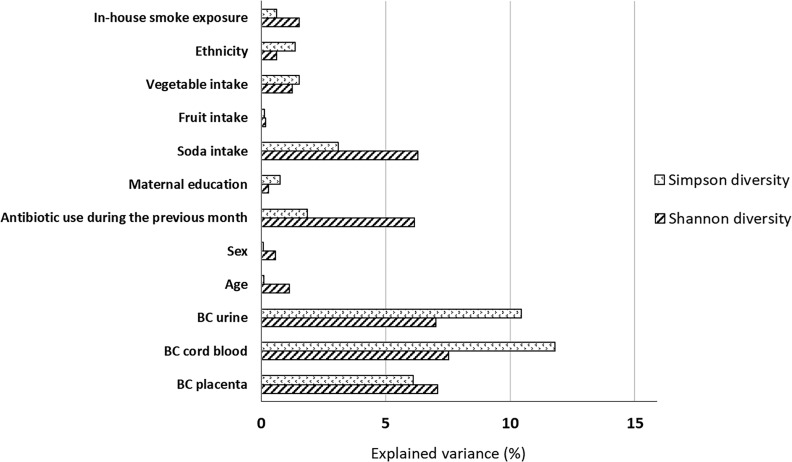
Results: Two diversity indices were negatively associated with placental black carbon [Shannon: -4.38% (95% CI: -8.31%, -0.28%); Simpson: -0.90% (95% CI: -1.76%, -0.04%)], cord blood black carbon [Shannon: -3.38% (95% CI: -5.66%, -0.84%); Simpson: -0.91 (95% CI: -1.66%, -0.16%)], and urinary black carbon [Shannon: -3.39% (95% CI: -5.77%, -0.94%); Simpson: -0.89% (95% CI: -1.37%, -0.40%)]. The explained variance of black carbon on the above indices varied from 6.1% to 16.6%. No statistically significant associations were found between black carbon load and the Chao1 richness index. After multiple testing correction, placental black carbon was negatively associated with relative abundance of the bacterial families Defluviitaleaceae and Marinifilaceae, and urinary black carbon with Christensenellaceae and Coriobacteriaceae; associations with cord blood black carbon were not statistically significant after correction.

Conclusion: Black carbon particles quantified in prenatal and postnatal biological matrices were associated with the composition and diversity of the childhood intestinal microbiome. These findings address the influential role of exposure to air pollution during pregnancy and early life in human health. https://doi.org/10.1289/EHP11257.


Figures

Figure 1 is a flowchart with seven steps. Step 1: There are 1596 mother-child pairs enrolled in the birth cohort, of which 1312 are not eligible. Step 2: There are 284 mother-child pairs, 51 of which are unable to communicate with one another. Step 3: There are 233 pairs, and of those, 76 pairs do not want to participate in the house visit study. Step 4: There are 157 pairs, 66 of which do not have a stool sample. Step 5: There are 91 pairs, 2 of which have poor D-N-A quality. Step 6: There are 89 pairs, 4 of which have an incorrect ASV read number. Step 7: There are 85 pairs available, with 63 pairs of placental tissue, 80 pairs of cord blood, and 80 pairs of urine.
Figure 1.
Participant flow chart depicting the selection of participants enrolled in the ENVIRONAGE birth cohort for arriving at the final study sample size. Note: Only mother–child pairs who already participated in the 4-y follow-up study up to 1 y before the house visit or who were going to participate within 1 y after the house visit, mother–child pairs who did not (plan to) move between the house visit study and the 4-y follow-up study and who had no major renovations planned during the house visit study were eligible for inclusion in this study. ASV, amplicon sequence variant; ENVIRONAGE, ENVIRonmental influence ON early AGEing birth cohort.
Figures 2A to 2C are stained tissues, namely, placental tissue, cord blood, and urine, depicting the black carbon particles under femtosecond pulsed laser illumination at 50 micrometers.
Figure 2.
Evidence of black carbon particles in (A) placental tissue, (B) cord blood, and (C) urine. White light generation originating from black carbon particles (yellow, indicated with a white arrow) under femtosecond pulsed laser illumination (excitation 810 nm, 120 fs, 80 MHz) was observed. Images represent the overlap of channel 1 (green, emission 450650 nm) and channel 2 (red, emission 400410 nm). All samples were collected in the ENVIRONAGE birth cohort and images were randomly selected from different participants. Scale bar: 50μm. Note: ENVIRONAGE, ENVIRonmental influence ON early AGEing birth cohort.
Figures 3A to 3E are correlation graphs, plotting Black Carbon particles per millimeter cubed placental tissues, ranging from 10000 to 50000 in increments of 10000; Black Carbon particles per millimeter cord blood, ranging from 50000 to 150000 in increments of 50000; Black Carbon particles per millimeter urine normalized for osmolality, ranging from 0 to 600000 in increments of 200000; Black Carbon particles per millimeter urine normalized for osmolality, ranging from 0 to 600000 in increments of 200000; Black Carbon particles per millimeter urine normalized for osmolality, ranging from 0 to 600000 in increments of 200000 (y-axis) across Modeled Black carbon exposure during the entire pregnancy (microgram per meter cubed), ranging from 0.0 to 2.0 in increments of 0.5; Modeled Black carbon exposure during the entire pregnancy (microgram per meter cubed), ranging from 0.0 to 2.0 in increments of 0.5; Modeled Black carbon exposure during the month preceding the house visit (microgram per meter cubed), ranging from 0.0 to 1.5 in increments of 0.5; Modeled Black carbon exposure during the six-months preceding the house visit (microgram per meter cubed), ranging from 0.0 to 2.0 in increments of 0.5; and Modeled Black carbon exposure during the year preceding the house visit (microgram per meter cubed), ranging from 0.0 to 0.5 in increments of 0.5 (x-axis).
Figure 3.
Correlation graphs between (A) placental black carbon and residential black carbon exposure averaged over the entire pregnancy (n=63), (B) cord blood black carbon and residential black carbon exposure averaged over the entire pregnancy (n=80), and (C), (D), and (E) urinary black carbon normalized for osmolality (n=80) and residential black carbon exposure averaged over the (C) preceding month, (D) preceding 6 months, and (E) preceding year of the house visit. See Table S5 for corresponding numeric data. Participants are enrolled in the ENVIRONAGE birth cohort. Note: ENVIRONAGE, ENVIRonmental influence ON early AGEing birth cohort.
Figure 4 is a stacked bar graph titled family relative abundance, plotting percentage, ranging from 0 to 100 percent in increments of 25 (y-axis) across bacterial families (x-axis) for Lachnospiraceae, Bacteroidaceae, Ruminococcaceae, Others, Oscillospiraceae, Prevotellaceae, Rikenellaceae, Veillonellaceae, Bifidobacteriaceae, Eubacterium, and Tannerellaceae.
Figure 4.
Overview of the relative abundance (percentage) of the 10 most abundant bacterial families in relation to all other taxa. Height of bars represents the relative abundance. Families are ranked in increasing order from bottom to top. Participants were enrolled in the ENVIRONAGE birth cohort. n=85. ENVIRONAGE, ENVIRonmental influence ON early AGEing birth cohort.
Figure 5 is a set of six error bar graphs titled Placental black carbon, Cord blood black carbon, and Urinary black carbon. Each title has two error bar graphs, plotting (Partial) Spearman correlation coefficients, ranging as negative 0.8 to 0.2 in increments of 0.2 (y-axis) across Chao, Shannon, Simpson (x-axis) for adjusted and unadjusted, respectively.
Figure 5.
(Partial) Spearman correlation coefficients with 95% CI between Chao1 richness index, Shannon diversity index, and Simpson diversity index and placental black carbon load, cord blood black carbon, or urinary black carbon normalized for osmolality, based on corrected (partial/adjusted) and uncorrected models. Partial Spearman and adjusted coefficient of determination models were adjusted for parity, season of delivery, batch, age, sex, weight, height, and maternal education per categories included in Table 1. See Table S7 for corresponding numeric data. Participants were enrolled in the ENVIRONAGE birth cohort. * indicates p 0.05. p-Values were calculated using pairwise (partial) Spearman correlation. Placenta n=63, cord blood n=80, and urine n=80. Note: BC, black carbon; CI, confidence interval; ENVIRONAGE, ENVIRonmental influence ON early AGEing birth cohort.
Figure 6 is a horizontal bar graph, plotting Black carbon placenta, Black carbon cord blood, Black carbon urine, Age, Sex, Antibiotic use during the previous month, Maternal education, Soda intake, Fruit intake, Vegetable intake, Ethnicity, and In house smoke exposure (y-axis) across explained variance (percentage), ranging from 0 to 15 in increments of 5 (x-axis) for Simpson diversity and Shannon diversity.
Figure 6.
Percentage of variance (R2) in Shannon or Simpson diversity explained by different covariables. Covariables were categorized as depicted in Table 1. See Table S8 for corresponding numeric data. Participants were enrolled in the ENVIRONAGE birth cohort. Note: ENVIRONAGE: ENVIRonmental influence ON early AGEing birth cohort.

Comment in

Similar articles

Cited by

References

    1. Landrigan PJ, Fuller R, Acosta NJR, Adeyi O, Arnold R, Basu NN, et al. 2018. The Lancet Commission on pollution and health. Lancet 391(10119):462–512, PMID: , 10.1016/S0140-6736(17)32345-0. - DOI - PubMed
    1. European Union. 2008. Directive 2008/50/EC of the European Parliament and of the Council of 21 May 2008 on Ambient Air Quality and Cleaner Air for Europe, 169–212. https://eur-lex.europa.eu/legal-content/EN/TXT/HTML/?uri=CELEX:32008L005... [accessed 22 October 2021].
    1. Janssen NA, Hoek G, Simic-Lawson M, Fischer P, van Bree L, ten Brink H, et al. 2011. Black carbon as an additional indicator of the adverse health effects of airborne particles compared with PM10 and PM2.5. Environ Health Perspect 119(12):1691–1699, PMID: , 10.1289/ehp.1003369. - DOI - PMC - PubMed
    1. Niranjan R, Thakur AK. 2017. The toxicological mechanisms of environmental soot (black carbon) and carbon black: focus on oxidative stress and inflammatory pathways. Front Immunol 8:763, PMID: , 10.3389/fimmu.2017.00763. - DOI - PMC - PubMed
    1. Chow JC, Watson JG, Mauderly JL, Costa DL, Wyzga RE, Vedal S, et al. 2006. Health effects of fine particulate air pollution: lines that connect. J Air Waste Manag Assoc 56(10):1368–1380, PMID: , 10.1080/10473289.2006.10464545. - DOI - PubMed

Publication types

LinkOut - more resources