. 2023 Feb 28;97(2):e0103222.
doi: 10.1128/jvi.01032-22. Epub 2023 Jan 31.

Retinoblastoma Protein Is Required for Epstein-Barr Virus Replication in Differentiated Epithelia

Affiliations

Retinoblastoma Protein Is Required for Epstein-Barr Virus Replication in Differentiated Epithelia

Julia E Myers et al. J Virol. .

Abstract

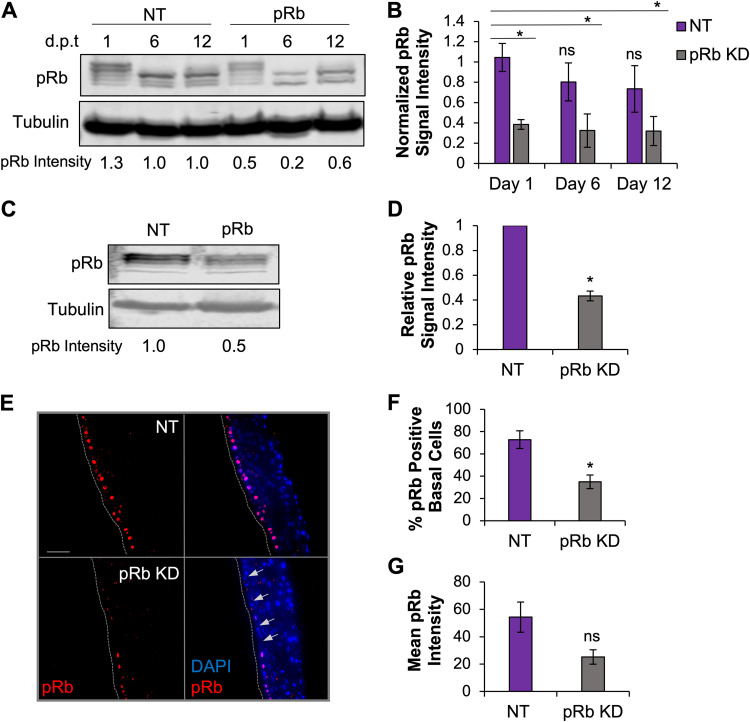
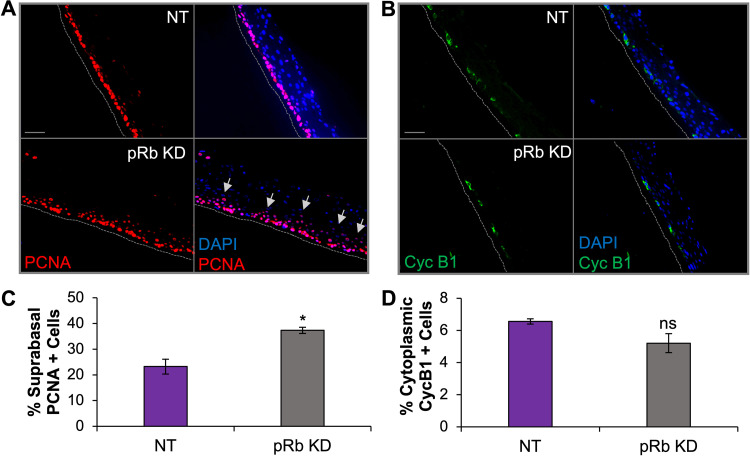
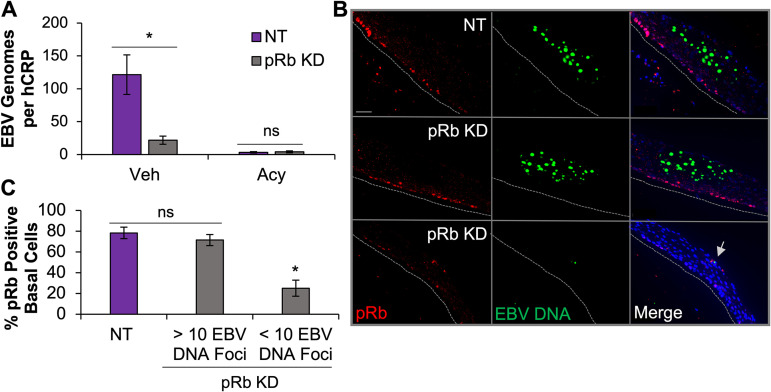
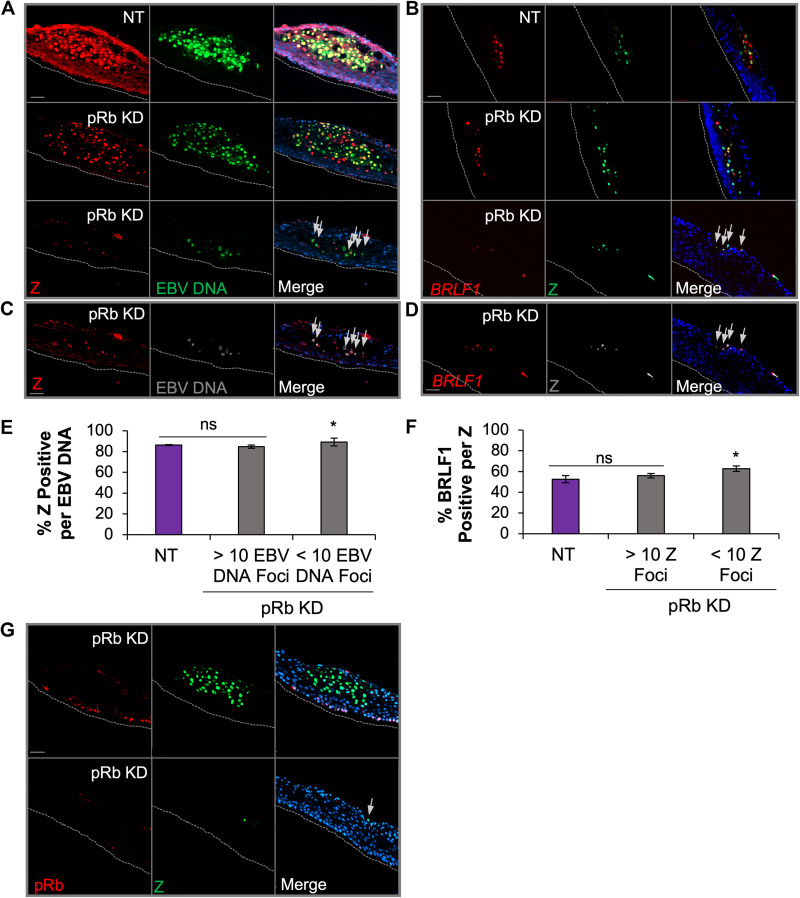
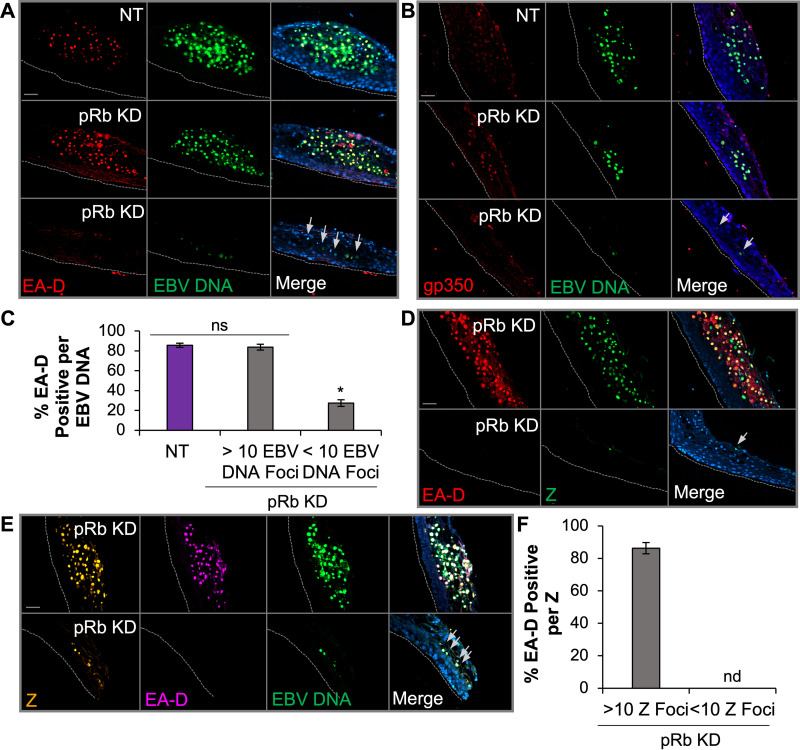
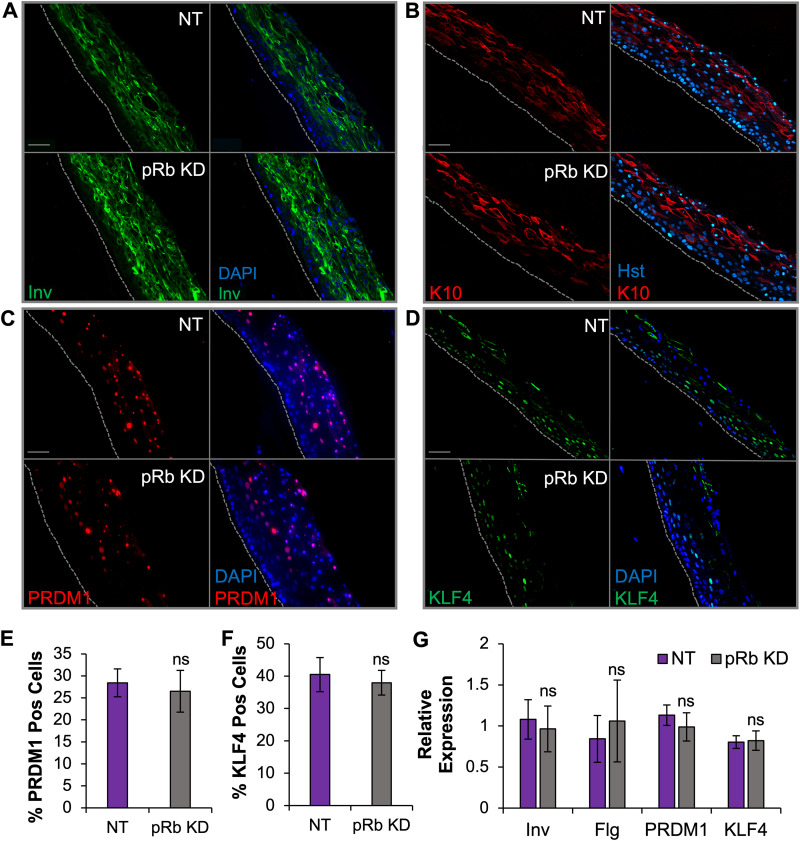
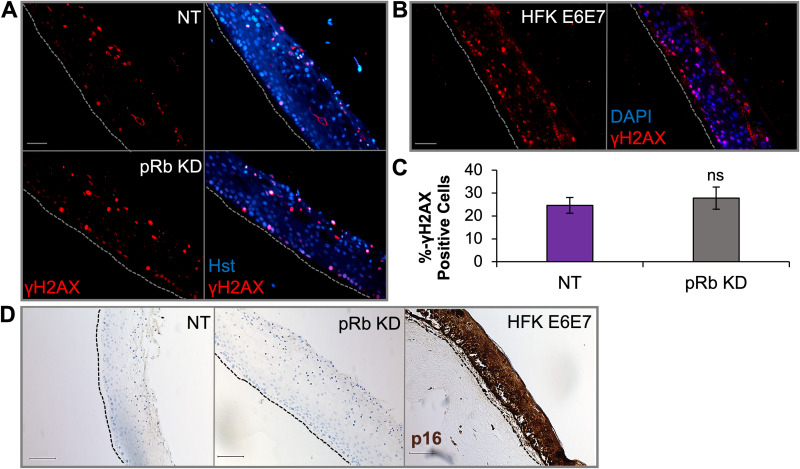
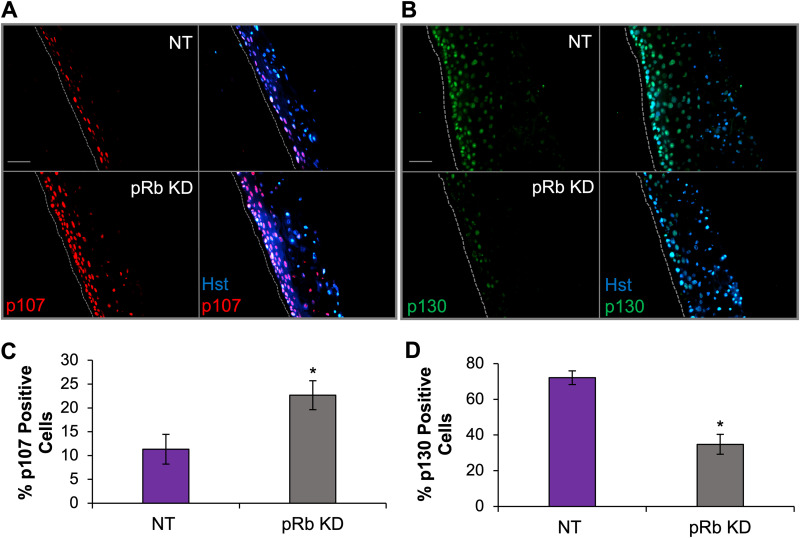
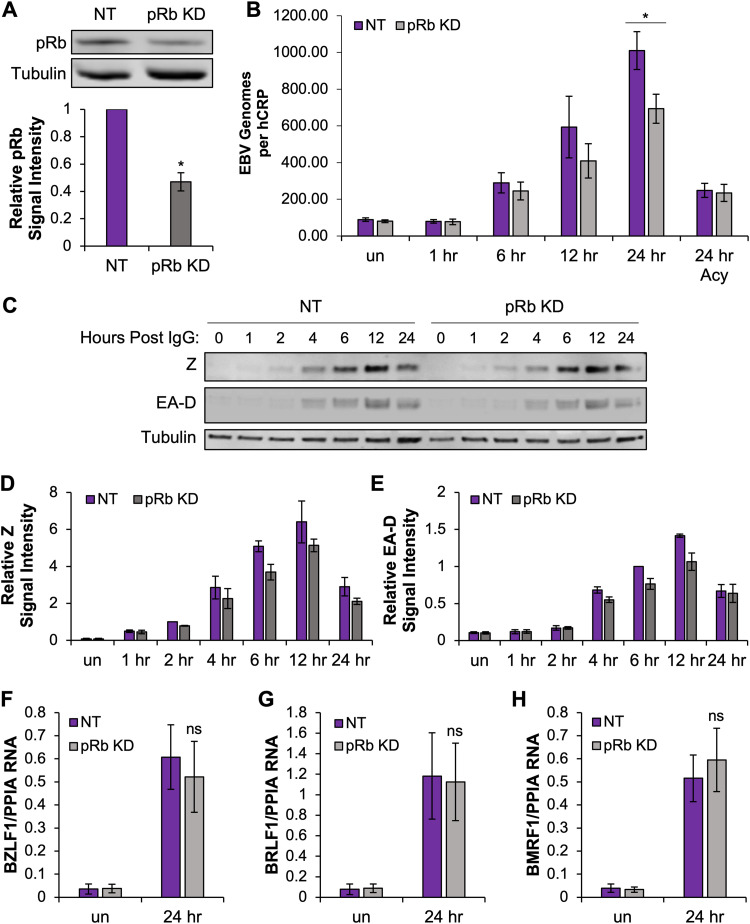
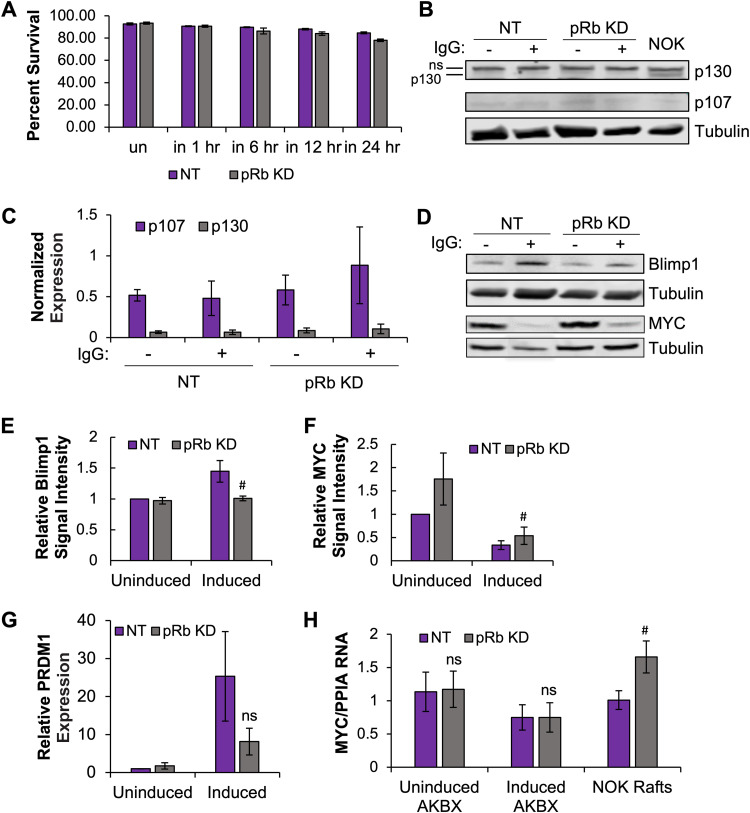
Coinfection of human papillomavirus (HPV) and Epstein-Barr virus (EBV) has been detected in oropharyngeal squamous cell carcinoma. Although HPV and EBV replicate in differentiated epithelial cells, we previously reported that HPV epithelial immortalization reduces EBV replication within organotypic raft culture and that the HPV16 oncoprotein E7 was sufficient to inhibit EBV replication. A well-established function of HPV E7 is the degradation of the retinoblastoma (Rb) family of pocket proteins (pRb, p107, and p130). Here, we show that pRb knockdown in differentiated epithelia and EBV-positive Burkitt lymphoma (BL) reduces EBV lytic replication following de novo infection and reactivation, respectively. In differentiated epithelia, EBV immediate early (IE) transactivators were expressed, but loss of pRb blocked expression of the early gene product, EA-D. Although no alterations were observed in markers of epithelial differentiation, DNA damage, and p16, increased markers of S-phase progression and altered p107 and p130 levels were observed in suprabasal keratinocytes after pRb knockdown. In contrast, pRb interference in Akata BX1 Burkitt lymphoma cells showed a distinct phenotype from differentiated epithelia with no significant effect on EBV IE or EA-D expression. Instead, pRb knockdown reduced the levels of the plasmablast differentiation marker PRDM1/Blimp1 and increased the abundance of c-Myc protein in reactivated Akata BL with pRb knockdown. c-Myc RNA levels also increased following the loss of pRb in epithelial rafts. These results suggest that pRb is required to suppress c-Myc for efficient EBV replication in BL cells and identifies a mechanism for how HPV immortalization, through degradation of the retinoblastoma pocket proteins, interferes with EBV replication in coinfected epithelia. IMPORTANCE Terminally differentiated epithelium is known to support EBV genome amplification and virion morphogenesis following infection. The contribution of the cell cycle in differentiated tissues to efficient EBV replication is not understood. Using organotypic epithelial raft cultures and genetic interference, we can identify factors required for EBV replication in quiescent cells. Here, we phenocopied HPV16 E7 inhibition of EBV replication through knockdown of pRb. Loss of pRb was found to reduce EBV early gene expression and viral replication. Interruption of the viral life cycle was accompanied by increased S-phase gene expression in postmitotic keratinocytes, a process also observed in E7-positive epithelia, and deregulation of other pocket proteins. Together, these findings provide evidence of a global requirement for pRb in EBV lytic replication and provide a mechanistic framework for how HPV E7 may facilitate a latent EBV infection through its mediated degradation of pRb in copositive epithelia.

Keywords: EBV; Epstein-Barr virus; HPV; cell cycle; epithelium; human papillomavirus; organotypic raft; replication.


Conflict of interest statement

The authors declare no conflict of interest.

Figures

FIG 1
FIG 1
pRb knockdown (KD) was maintained in raft culture. (A) NOKs were transfected with siRNAs targeting pRb and scrambled (NT) controls and grown in monolayer culture. Protein lysates were harvested 1, 6, and 12 days post-siRNA transfection (dpt), and pRb knockdown efficiency was examined by Western blotting. A representative Western blot is shown. (B) Quantification of pRb signal intensity from 3 independent siRNA transfections. pRb signal intensity was normalized to tubulin and compared to that of an NT control from day 1, arbitrarily set to 1. (C) NOKs to be used in raft culture were transfected with siRNAs targeting pRb and NT. Protein lysates were harvested 16 to 24 h after siRNA transfection, and pRb knockdown efficiency was examined by Western blotting. A representative Western blot is shown. (D) Quantification of pRb signal intensity from 4 independent siRNA transfections. pRb signal intensity was normalized to tubulin and compared to that of NT controls, arbitrarily set to 1. (E) Immunofluorescence analysis of pRb (red) and nuclear stain DAPI (blue) in raft tissues. Gray dotted lines indicate the basal layer. Scale bars, 50 μm. Arrows depict DAPI-positive basal cells with reduced pRb. (F) pRb-positive basal cells were quantified as a percentage of DAPI-positive cells. (G) Mean pRb fluorescence intensity in the basal layer was calculated as the sum of the pRb mean pixel intensity divided by the number of DAPI-positive cells. Three rafts generated from siRNA-independent transfections were analyzed; six images per raft were quantified using ImageJ. Mean values are shown. Error bars represent the standard error of the mean. *, P < 0.05 relative to NT controls; ns, no statistical significance.
FIG 2
FIG 2
Increased S-phase progression in suprabasal cells is evident in raft tissue with partial pRb KD. NOK raft tissues were immunostained to detect PCNA, an S-phase marker, or cytoplasmic cyclin B1, a G2 cell cycle marker. (A) Immunofluorescence analysis of PCNA (red signal). (B) Immunofluorescence analysis of cyclin B1 (Cyc B1, green signal). The nuclear stain DAPI is shown in blue. Scale bars, 50 μm. Gray dotted lines indicate the basal layer of tissue. Gray arrows indicate elevated PCNA in suprabasal layers. (C) Nuclear PCNA was quantified as a percentage of DAPI-positive cells in suprabasal layers. (D) Cytoplasmic cyclin B1 was quantified as a percentage of the total DAPI-positive cells. Three independent rafts from independent siRNA transfections were analyzed. Six images per raft were quantified using ImageJ. Mean values are shown. Error bars represent the standard error of the mean. *, P < 0.05 relative to NT controls; ns, no statistical significance.
FIG 3
FIG 3
Loss of pRb inhibits EBV replication after de novo infection. (A) The relative EBV genome copy number per DNA copy (human C-reactive protein [hCRP]) was determined using qPCR in NOKs transfected with NT siRNA (NT, n = 5) or siRNA specific to pRb (n = 7). Acyclovir (Acy) treatment was used to block EBV replication and control for infectivity (NT, n = 6, and pRb, n = 6). Veh, vehicle. (B) EBV DNA in raft tissue was visualized using DNAscope followed by immunofluorescence analysis for pRb. Gray dotted lines indicate the tissue basal layer. Scale bars, 50 μm. A gray arrow indicates reduced EBV DNA foci. (C) Nuclear pRb-positive cells were quantified as a percentage of DAPI-positive cells in the basal layer of raft tissue from NT rafts and pRb KD rafts (n = 2). Data from pRb KD rafts were divided into regions with >10 or <10 EBV DNA foci. A minimum of two images per raft were quantified for NT and pRb KD rafts from regions with <10 EBV DNA foci. One to two images were quantified for pRb KD rafts with >10 EBV DNA foci based on availability. Mean values are shown. Error bars represent the standard error of the mean for four (A) and two (C) independent siRNA transfections. *, P < 0.05 relative to NT controls; ns, no statistical significance.
FIG 4
FIG 4
EBV IE gene expression is not dependent on pRb in raft tissues. (A) DNAscope for EBV DNA (green) was followed by immunofluorescence for Z (red) in NT and pRb KD rafts. (B) RNAscope for BRLF1 RNA (red) was followed by immunofluorescence for Z (green) in NT and pRb KD rafts. The nuclear stain Hoechst 33342 is shown in blue. Arrows in the merged image indicate foci positive for EBV DNA and Z (A and C) or BRLF1 and Z (B and D). (C) Enhanced exposure of the bottom panel in panel A showing Z signal (red) and EBV DNA foci (gray) in pRb KD. (D) Enhanced exposure of the bottom panel in panel B showing R (red) and Z (gray) colocalization pRb KD. (E) The percentage of Z positive per EBV DNA focus was manually counted. (F) Percentage of BRLF1 RNA signal per Z-positive (pos) focus. NT siRNA and pRb KD rafts with <10 EBV DNA foci were quantified from three biologically independent rafts with a minimum of three images per raft analyzed. Areas with >10 EBV DNA foci in pRb KD tissue were quantified from one to two images per raft from two biologically independent rafts. Mean values are shown. Error bars represent the standard error of the mean. *, P < 0.05 relative to NT controls; ns, no statistical significance. (G) Representative images are shown for detection of Z (green) and pRb (red) in pRb KD raft tissues. Gray dotted lines indicate the basal layer of the tissue. Scale bars, 50 μm.
FIG 5
FIG 5
pRb was required for production of EBV early and late genes in differentiated epithelia. (A) DNAscope of EBV DNA followed by immunofluorescence of EA-D (Capricorn no. EBV-018-48180). (B) DNAscope of EBV DNA followed by immunofluorescence of gp350 in rafts. The nuclear stain Hoechst 33342 is shown in blue. Arrows depict EBV DNA foci negative for EA-D (A, D, and E) or gp350 (B). (C) Quantification of EBV DNA foci positive for EA-D in rafts. Images were manually quantified as a percentage of EA-D-positive EBV DNA foci from 3 biologically independent rafts. NT siRNA and regions with <10 EBV DNA foci were quantified from a minimum of three images per raft. Regions with >10 EBV DNA foci were quantified from 1 to 2 images per raft. *, P < 0.05 relative to NT controls; ns, no statistical significance. (D) Sequential immunofluorescence of EA-D (Sigma-Aldrich no. MAB8186) followed by Z. (E) Sequential immunofluorescence of Z and then EA-D, followed by DNAscope of EBV DNA. Gray dotted lines indicate the basal layer of tissue. Scale bars, 50 μm. (F) Percentage of Z- and EA-D-positive foci from sequential immunofluorescence (D). Mean values were manually quantified from 2 biologically independent rafts from a minimum of three images per raft. Mean values with error bars representing the standard error of the mean are shown. nd, no detection of EA-D in 10 Z-positive foci.
FIG 6
FIG 6
Differentiation markers following pRb KD were comparable to those of NT controls. Immunofluorescence analysis was performed to examine the following: involucrin (Inv) (A), cytokeratin 10 (K10) (B), PRDM1 (C), and KLF4 (D). Tissue nuclei (blue) were visualized with DAPI or Hoechst 33342 (Hst). Scale bars, 50 μm. Gray dotted lines indicate the basal layer of tissue. (E and F) Quantification of total PRDM1 (E) and KLF4 (F). Positive cells were quantified as a percentage of total DAPI-positive cells from three biologically independent rafts with six images analyzed per raft. (G) The mRNA expression levels of Inv, filaggrin (Flg), PRDM1, and KLF4 were analyzed by RT-qPCR. Marker expression was normalized to cyclophilin and compared to that of an NT raft arbitrarily set to 1. The mean relative expression is shown, with error bars representing the standard error of the mean from a minimum of 5 rafts per group. ns, no statistical significance relative to the NT control.
FIG 7
FIG 7
Raft tissues with partial loss of pRb did not influence p16 levels or activation of the DNA damage response. Immunofluorescence analysis was performed on raft tissues as follows: γH2AX in rafts from NOKs transfected with NT or pRb siRNAs (KD) (A); γH2AX in rafts from human foreskin keratinocytes (HFKs) immortalized with HPV16 E6E7 (B). Scale bars, 50 μm. Gray dotted lines indicate the basal layer of tissue. (C) Percentage of γH2AX- positive cells in NOK raft tissue (n = 4). γH2AX signal was quantified as a percentage of DAPI- or Hoechst 33342 (Hst)-positive cells using six images per raft. The mean percentage is shown, and error bars represent the standard error of the mean. ns, no statistical significance relative to the NT control. (D) Immunohistochemistry evaluating p16 levels in NOKs and HPV16 E6E7-positive HFK raft tissue. Scale bars, 100 μm. Black dotted lines indicate the basal layer of tissue.
FIG 8
FIG 8
Retinoblastoma pocket proteins, p107 and p130, are deregulated following pRb knockdown. Immunofluorescence analysis was performed on the following NOK-derived raft tissues: p107 (A) and p130 (B). Scale bars, 50 μm; gray dotted lines indicate the basal layer of tissue. (C and D) The number of positive cells in raft tissues was quantified for p107 (C) and p130 (D) and is represented as the percentage of the total Hoechst 33342 (Hst)-positive cells. The average percentages from two (C) and three (D) biologically independent rafts are shown, with a minimum of three images captured per raft. The mean percentage is shown, with error bars representing the standard error of the mean. *, P < 0.05 relative to NT controls.
FIG 9
FIG 9
pRb KD reduces EBV DNA levels following reactivation of Akata BL. (A) Akata BX1 BL cells were electroporated with siRNAs targeting pRb and scrambled siRNA NT controls. Protein lysates were harvested 24 h after siRNA transfection, and pRb KD efficiency was examined by Western blotting. A representative Western blot is shown. Densitometric quantification of pRb signal intensity from 6 independent siRNA transfections was used to measure the pRb KD efficiency. pRb signal intensity was normalized to tubulin and compared to that of an NT control, arbitrarily set to 1. *, P < 0.05. (B) At 24 h posttransfection, cells were treated with 50 μg/mL human anti-IgG antibody to cross-link the B cell receptor and induce EBV reactivation. DNA was collected at 1, 6, 12, and 24 h postinduction. The relative EBV genome copy number per DNA copy (human C-reactive protein [hCRP]) was determined using qPCR in cells transfected with NT siRNA or siRNA specific to pRb (n = 6). Acyclovir (Acy) treatment was used to block EBV replication and control for induction (n = 3). *, P < 0.05 relative to NT controls. un, uninduced. (C) Protein lysates were harvested at various intervals up to 24 h after IgG treatment and blotted for Z and EA-D. A representative Western blot is shown. (D and E) The signal intensities for Z (D) and EA-D (E) from 3 independent siRNA transfections were normalized to tubulin. The mean from 3 independent siRNA transfections is shown and compared to that of the NT control, arbitrarily set to 1. Error bars represent the standard error of the mean (n = 3). RNA was collected prior to induction with 50 μg/mL human anti-IgG antibody and then at 24 h postinduction. (F to H) The mRNA expression levels of BZLF1 (F), BRLF1 (G), and BMRF1 (H) were analyzed by RT-qPCR. Viral gene expression was normalized to cyclophilin (PPIA). The mean relative expression is shown, with error bars representing the standard error of the mean (n = 6). ns, no statistical significance relative to the NT control.
FIG 10
FIG 10
Loss of pRb attenuated B cell differentiation following EBV reactivation in Akata BL. Akata BX1 BL cells were transfected with siRNAs targeting pRb (pRb KD) and scrambled siRNA NT controls and then 24 h posttransfection were induced with 50 μg/mL human anti-IgG antibody. (A) Cells were stained with trypan blue at various intervals, and the percentage of live cells is shown (n = 3). NT and pRb KD protein lysates were harvested prior to induction (un) and various intervals up to 24 h postinduction (in). (B) A representative Western blot for p130 and p107 is shown. (C) The mRNA expression for p130 and p107 was analyzed by RT-qPCR and normalized to cyclophilin (PPIA). The average normalized expression relative to cyclophilin is shown, with error bars representing the standard error of the mean (n = 3). (D) A representative Western blot for PRDM1/Blimp1 and c-Myc is shown. Protein levels were measured by densitometric analysis for (E) PRDM1/Blimp1 and c-Myc (F). The signal intensity from 3 to 4 independent siRNA transfections was normalized to tubulin and compared to values of the uninduced NT control, arbitrarily set to 1. The average is shown, with error bars representing the standard error of the mean (n = 3 for PRDM1/Blimp1 [P < 0.1]; n = 4 for c-Myc [P < 0.08]). (G) PRDM1/Blimp1 RNA levels were normalized to cyclophilin and compared to that of uninduced NT cells, arbitrarily set to 1. The average is shown, with error bars representing the standard error of the mean (n = 6). (H) c-Myc RNA levels were analyzed by RT-qPCR. RNA levels were normalized to PPIA (cyclophilin). The average ratio of MYC to PPIA RNA is shown, with error bars representing the standard error of the mean (n = 6 for Akata [AKBX] BL, n = 3 for NOK epithelial rafts [P < 0.06]). #, P < 0.1; ns, no statistical significance relative to the NT control.

Similar articles

Cited by

References

    1. Cohen JI. 2000. Epstein-Barr virus infection. N Engl J Med 343:481–492. 10.1056/NEJM200008173430707. - DOI - PubMed
    1. Niedobitek G, Meru N, Delecluse HJ. 2001. Epstein-Barr virus infection and human malignancies. Int J Exp Pathol 82:149–170. - PMC - PubMed
    1. Hsu JL, Glaser SL. 2000. Epstein-Barr virus-associated malignancies: epidemiologic patterns and etiologic implications. Crit Rev Oncol Hematol 34:27–53. 10.1016/s1040-8428(00)00046-9. - DOI - PubMed
    1. Tsao SW, Tsang CM, Lo KW. 2017. Epstein-Barr virus infection and nasopharyngeal carcinoma. Philos Trans R Soc Lond B Biol Sci 372:20160270. 10.1098/rstb.2016.0270. - DOI - PMC - PubMed
    1. Brady G, Macarthur GJ, Farrell PJ. 2008. Epstein-Barr virus and Burkitt lymphoma. Postgrad Med J 84:372–377. 10.1136/jcp.2007.047977. - DOI - PubMed

Publication types

MeSH terms

Substances

LinkOut - more resources