. 2023 Feb 28;97(2):e0165522.
doi: 10.1128/jvi.01655-22. Epub 2023 Jan 31.

Sirtuin-2, NAD-Dependent Deacetylase, Is a New Potential Therapeutic Target for HIV-1 Infection and HIV-Related Neurological Dysfunction

Affiliations

Sirtuin-2, NAD-Dependent Deacetylase, Is a New Potential Therapeutic Target for HIV-1 Infection and HIV-Related Neurological Dysfunction

Clara Duran-Castells et al. J Virol. .

Abstract

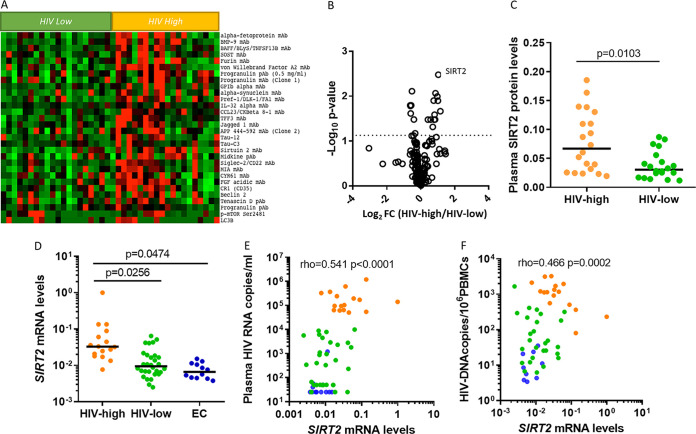
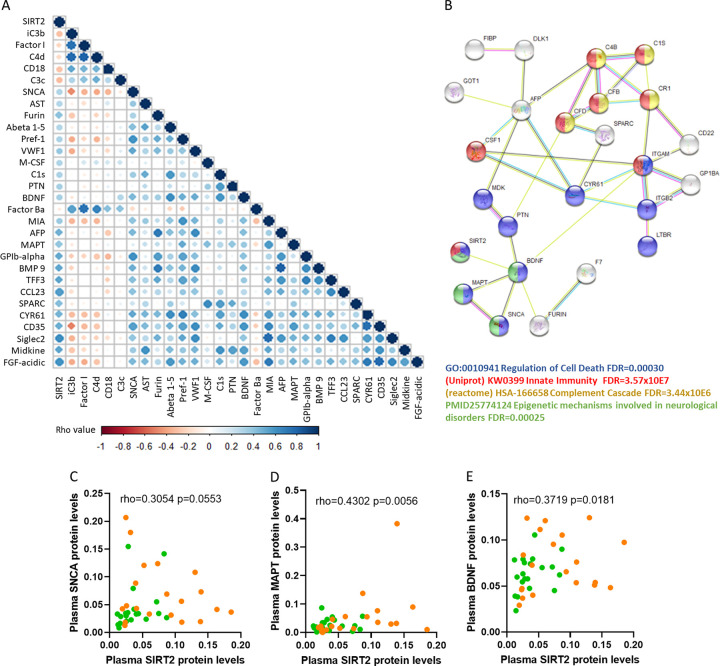
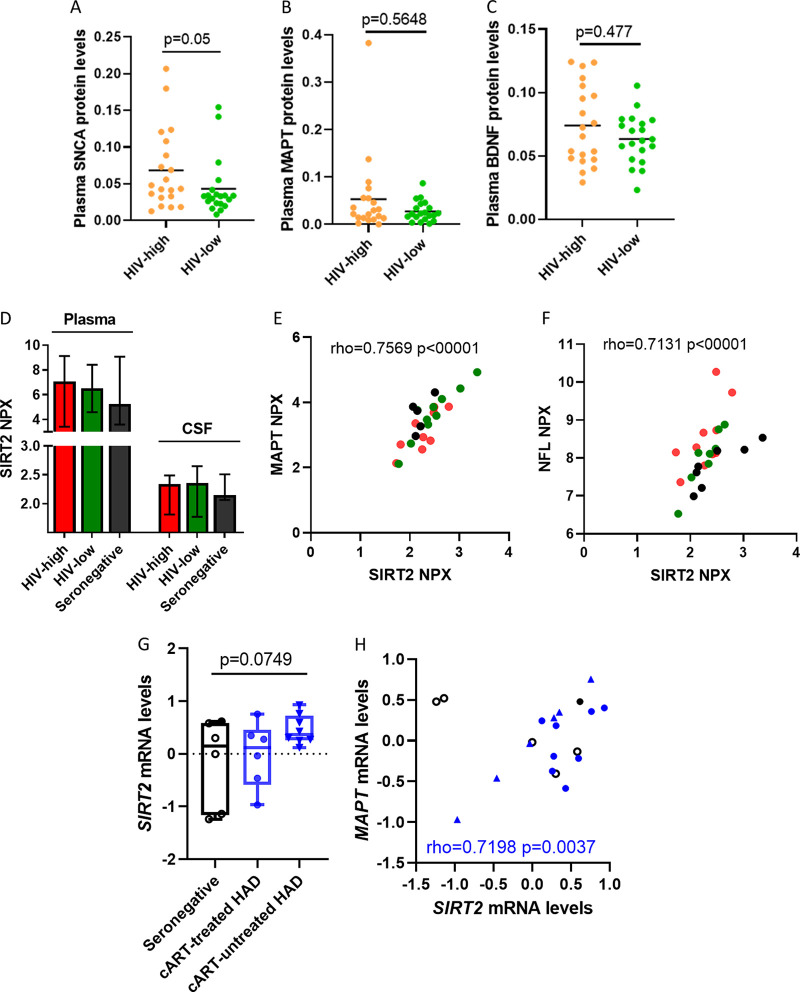
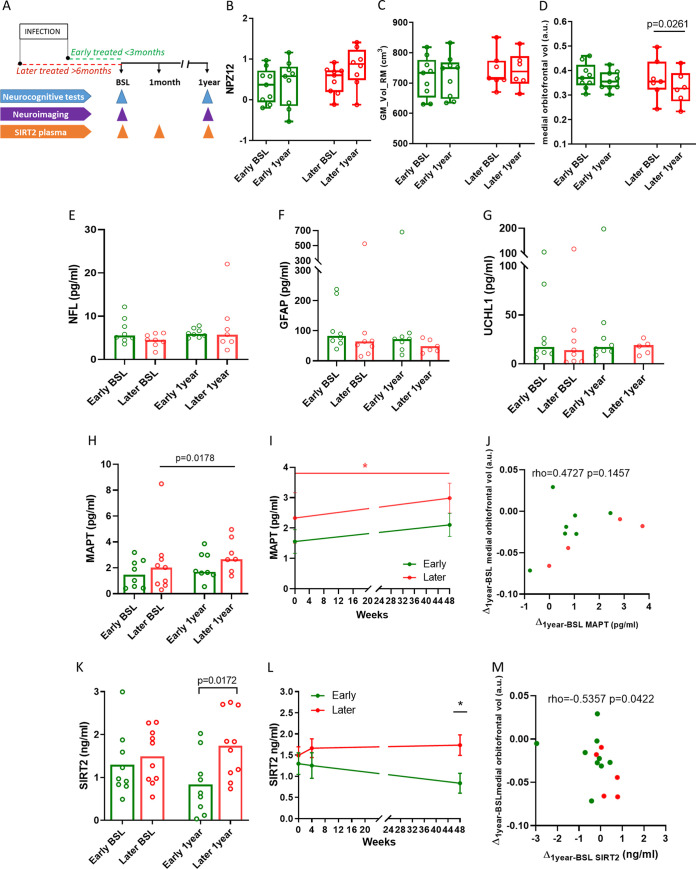
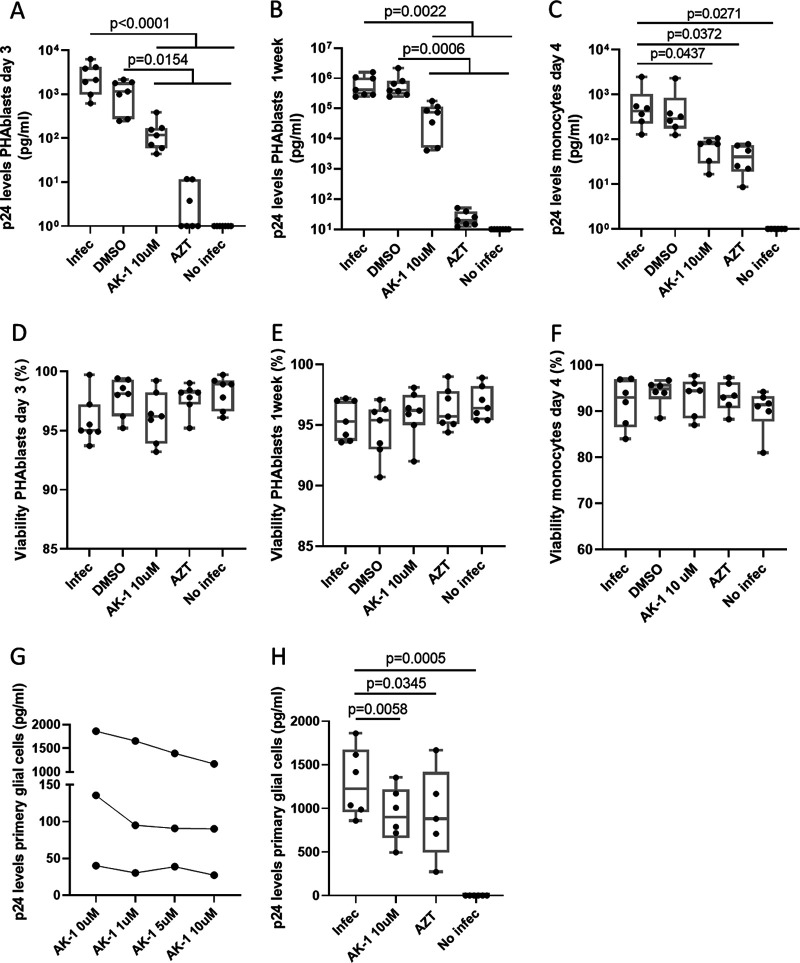
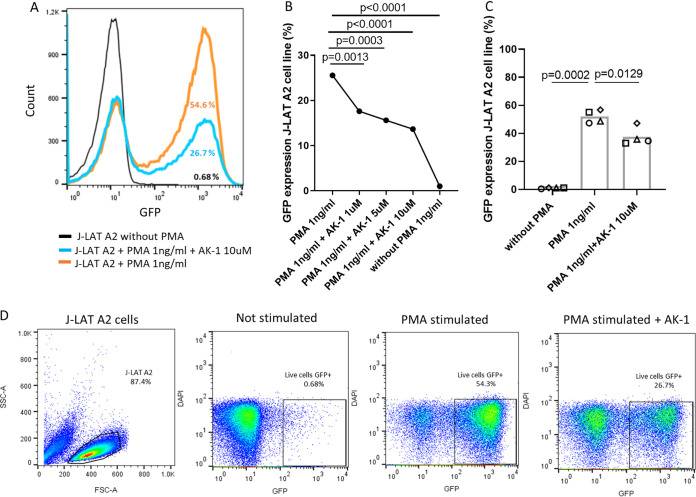
The implementation and access to combined antiretroviral treatment (cART) have dramatically improved the quality of life of people living with HIV (PLWH). However, some comorbidities, such as neurological disorders associated with HIV infection still represent a serious clinical challenge. Soluble factors in plasma that are associated with control of HIV replication and neurological dysfunction could serve as early biomarkers and as new therapeutic targets for this comorbidity. We used a customized antibody array for determination of blood plasma factors in 40 untreated PLWH with different levels of viremia and found sirtuin-2 (SIRT2), an NAD-dependent deacetylase, to be strongly associated with elevated viral loads and HIV provirus levels, as well as with markers of neurological damage (a-synuclein [SNCA], brain-derived neurotrophic factor [BDNF], microtubule-associated protein tau [MAPT], and neurofilament light protein [NFL]). Also, longitudinal analysis in HIV-infected individuals with immediate (n = 9) or delayed initiation (n = 10) of cART revealed that after 1 year on cART, SIRT2 plasma levels differed between both groups and correlated inversely with brain orbitofrontal cortex involution. Furthermore, targeting SIRT2 with specific small-molecule inhibitors in in vitro systems using J-LAT A2 and primary glial cells led to diminished HIV replication and virus reactivation from latency. Our data thus identify SIRT2 as a novel biomarker of uncontrolled HIV infection, with potential impact on neurological dysfunction and offers a new therapeutic target for HIV treatment and cure. IMPORTANCE Neurocognitive disorders are frequently reported in people living with HIV (PLWH) even with the introduction of combined antiretroviral treatment (cART). To identify biomarkers and potential therapeutic tools to target HIV infection in peripheral blood and in the central nervous system (CNS), plasma proteomics were applied in untreated chronic HIV-infected individuals with different levels of virus control. High plasma levels of sirtuin-2 (SIRT2), an NAD+ deacetylase, were detected in uncontrolled HIV infection and were strongly associated with plasma viral load and proviral levels. In parallel, SIRT2 levels in the peripheral blood and CNS were associated with markers of neurological damage and brain involution and were more pronounced in individuals who initiated cART later in infection. In vitro infection experiments using specific SIRT2 inhibitors suggest that specific targeting of SIRT2 could offer new therapeutic treatment options for HIV infections and their associated neurological dysfunction.

Keywords: HIV reservoir; HIV-1; HIV-associated neurocognitive disorders (HAND); neuroimaging; neurological disorder; plasma proteomics; virus infection control.


Conflict of interest statement

The authors declare no conflict of interest.

Figures

FIG 1
FIG 1
Plasma and gene expression levels of SIRT2 are associated with viral parameters in chronic untreated HIV infection. Proteomic array (9) applied to plasma samples from untreated chronically infected individuals with different degrees of HIV control (n = 40). (A) Heatmap showing the relative plasma levels of the most differentially detected soluble factors between untreated HIV-infected individuals with high viral loads (HIV-high, with more than 50,000 viral copies/mL, n = 20) and those with low viral loads (HIV-low, viral loads < 10,000 viral copies/mL, n = 20). Red indicates high protein abundance in plasma, and green indicates reduced protein levels. (B) Volcano plot representing the relative expression of the 185 molecules measured, identifying SIRT2 as the most significant and differentially detected soluble factor between HIV-high and HIV-low (Log2 FC = 1.039; log10 P value = 2.478). The log2 fold change is shown on the x axis and the −log10 of the P value on the y axis. (C) Scatterplot showing the relative plasma protein levels of SIRT2 in both study groups (HIV-high [n = 20, orange dots] and HIV-low [n = 20, green dots]). (D) SIRT2 gene expression in PBMCs from chronic untreated HIV-infected individuals grouped as HIV-high (n = 16, orange dots), HIV-low (n = 30, green dots), and elite controllers (i.e., untreated HIV-infected individuals with undetectable HIV viral load in plasma, n = 12, blue dots). Study groups are shown on the x axis, and relative SIRT2 gene expression corrected for CD4 counts is shown on the y axis. (E and F) Correlation between relative SIRT2 gene expression and plasma viral load (E) and HIV proviral DNA levels (F) in PBMC for all three groups. HIV-high patients (n = 16, orange dots), HIV-low patients (n = 30, green dots), and elite controllers (n = 12, blue dots) are indicated in the plot. Relative SIRT2 gene expression corrected for CD4 counts is shown on the x axis, and viral load (HIV RNA copies/mL) and proviral levels (HIV DNA copies/106 PBMCs) are shown on the y axis. Plasma proteome data were analyzed using the t test. SIRT2 plasma levels between HIV-high and HIV-low were analyzed using the Mann-Whitney test. SIRT2 gene expression levels between HIV-high, HIV-low, and EC were analyzed using ANOVA test for multiple comparisons corrected by original FDR method of Benjamini and Hochberg. The Spearman's rank test was applied for the correlation analysis. Statistical significance was set at P < 0.05.
FIG 2
FIG 2
Plasma levels of SIRT2 are associated with neurological factors in chronic untreated HIV infection. (A) Correlation matrix showing the significant relationship between SIRT2 and proteins measured in the antibody array considering all HIV-infected groups (HIV-high and HIV-low). The color scale shows positive correlations in blue and negative correlations in red. (B) The functional analysis performed using the STRING webpage represents the interaction between SIRT2 and the remaining correlated factors. Several functions derived from Gene Ontology, Uniprot, Reactome, and PubMed were identified as follows: Regulation of Cell Death category (GO, 0010941; FDR = 0.0030) in blue, Innate Immunity (KW0399; FDR = 3.57 × 10E7) in red, Complement Cascade (HSA-166658; FDR = 3.44 × 10E6) in yellow, and epigenetic mechanisms involved in neurological disorders (PMID25774124; FDR = 0.00025) in green. (C to E). Correlation plots showing the associations between sirtuin-2 and plasma levels of SNCA (C), MAPT (D), and BDNF (E) measured in the antibody array across all chronic untreated HIV-infected individuals. HIV-high (n = 20, orange dots) and HIV-low (n = 20, green dots) groups are indicated in the plot. The x axis shows relative plasma SIRT2 levels, and the y axis shows the relative plasma levels for SNCA, BDNF, and MAPT, respectively. The Spearman's rank test was applied for the correlation analysis. Statistical significance was set at P < 0.05.
FIG 3
FIG 3
SIRT2 levels in the CNS of HIV-infected individuals. (A to C) Scatterplot showing the relative plasma protein levels of SNCA (A), MAPT (B), and BDNF (C) in both study groups (HIV-high [n = 20, orange dots] and HIV-low [n = 20, green dots]). (D) Plot representing normalized protein expression (NPX) levels of SIRT2 in the plasma (left) and CSF (right) in HIV-high (n = 10, red bar), HIV-low (n = 10, green bar), and seronegative individuals (n = 5, black bar). The mean and standard deviation are shown. (E and F) Correlation between relative SIRT2 levels and relative CSF levels of MAPT (E) and NFL (F) in HIV-high (n = 10, red dots), HIV-low (n = 10, green dots), and seronegative individuals (n = 5, black dots). Relative MAPT and NFL levels are shown on the y axis, and relative SIRT2 levels are shown on the x axis. (G) Plot representing SIRT2 gene expression in postmortem brain tissues measured by microarray in the GSE28160 study performed in seronegative (n = 6), cART-treated HAD (HIV-associated disorders, n = 6), and cART-untreated HAD individuals (n = 8). Values are expressed as mean and standard deviation. (H) Correlation between gene expression levels of SIRT2 (x axis) and MAPT (y axis) in postmortem brain tissue samples in HIV-infected individuals (cART-treated HAD [n = 6] and cART-untreated HAD individuals [n = 8]). For comparisons between groups, ANOVA test for multiple comparisons corrected by original FDR method of Benjamini and Hochberg was applied. The Spearman's rank test was applied for the correlation analysis. Statistical significance was set at P < 0.05.
FIG 4
FIG 4
Plasma SIRT2 levels are associated with neurological dysfunction in treated HIV infection. (A) Schematic representation of the following two study arms included in the ARBRE study: early-cART (n = 9) and later-cART (n = 10) HIV-infected individuals who started cART at different time points after estimated HIV acquisition and underwent longitudinal neurological evaluation (neuropsychological tests and neuroimaging) and quantification of SIRT2 in plasma. Early-cART patients initiated treatment within a maximum of 3 months since the estimated date of infection, and later-treated patients initiated cART at least 6 months after the estimated date of infection. Study visits were at baseline (BSL), 1 month (4 weeks), and 1 year after initiation of cART. (B to D) Plots representing results of the NPZ12 and global gray matter and medial orbitofrontal cortex volume (peak coordinate at MNI, x = 6, y = 44, z = −29) in early- and later-cART individuals at baseline and after 1 year on treatment (early-cART, n = 9, green group; later-cART, n = 9, red group). The values on the y axis represent the NPZ12 score, global gray matter (cm3) and medial orbitofrontal cortex volume (a.u.). The box plot shows the median and minimum to maximum values for each group. (E to H) Absolute plasma NFL, GFAP, UCHL1, and MAPT levels at baseline (BSL) and after 1 year on treatment in early-cART (n = 9, green group) and later-cART (n = 10, red group) individuals expressed in picograms per milliliter. The upper limit of the bar is the median value of protein plasma levels. (I) Absolute MAPT (tau protein) plasma levels represented longitudinally and expressed in picograms per milliliter. (J) Correlation between longitudinal plasma MAPT (tau protein) levels (x axis, pg/mL) and the results for medial orbitofrontal cortex volumetry (y axis) expressed as the difference between 1 year and baseline in the ARBRE study including early- (n = 9, green dots) and later-cART individuals (n = 5, red dots). (K and L) Plots representing the absolute plasma SIRT2 in early-cART (n = 9, green line) and later-cART (n = 10, red line) individuals cross-sectionally (K) and longitudinally (L) at BSL (baseline) and 1 year time points. Weeks of treatment are shown on the x axis, and absolute plasma levels of SIRT2 (ng/mL) are shown on the y axis. (M) Correlation between longitudinal plasma SIRT2 (x axis, ng/mL) and the results for medial orbitofrontal cortex volumetry expressed as the difference between 1 year on cART and baseline in the ARBRE study including early- (n = 9, green dots) and later-cART individuals (n = 9, red dots). Differences between the groups were analyzed using the Mann-Whitney U test, changes over time were assessed using the paired t test, and the correlation analysis was based on the Spearman's rank test. Statistical significance was set at P < 0.05.
FIG 5
FIG 5
Effect of in vitro SIRT2 inhibition on HIV replication. (A to C) Inhibition of HIV replication in the presence of SIRT2 inhibitor (AK-1), tested in HIV-infected PHA blasts (seven independent experiments) (A and B) with HIVNL4-3 strain, at day 3 and 1 week postinfection, respectively, and HIV-infected monocyte-derived macrophages (MDMs) (six independent experiments) (C) infected with HIVBaL strain at day 4 postinfection. (D to F) Cell viability in the presence of SIRT2 inhibitor (AK-1), tested in HIV-infected PHA blasts (seven independent experiments) (D and E) with HIVNL4-3 strain, at day 3 and 1 week, respectively, and monocyte-derived macrophages (MDMs) (six independent experiments) (F) infected with HIVBaL strain at day 4 postinfection. Experimental conditions are shown on the x axis; quantification of viability (% live cells) is shown on the y axis. (G) Glial cells infected with the HIVNLAD8 virus strain (MOI, 0.01) in the presence of different doses of AK-1 inhibitor. Experimental conditions are shown on the x axis; quantification of absolute p24 supernatant (pg/mL) is shown on the y axis. The data presented correspond to the mean of two duplicates performed in a single experiment. (H) HIV-infected microglial cells (six independent experiments) with the NLAD8 virus strain in the presence of different doses of AK-1 inhibitor. Experimental conditions are shown on the x axis; quantification of p24 levels (pg/mL) is shown on the y axis. For results from HIV-infected PHA blasts, MDMs, and primary glial cells, ANOVA test for multiple comparisons corrected by original FDR method of Benjamini and Hochberg was used to analyzed differences between conditions. For all comparisons, P < 0.05 was considered significant. The plots show the median of all experiments for each condition.
FIG 6
FIG 6
Effect of in vitro SIRT2 inhibition on HIV reactivation. (A) Histogram plot showing green fluorescent protein (GFP) cellular counts of three different conditions of the experiment, including nonstimulated cells (black), PMA-stimulated cells (orange), and cells stimulated with PMA in the presence of AK-1 (blue) from one representative experiment. (B and C) HIV reactivation measured by the percentage of GFP expression measured by flow cytometry in J-LAT A2 cells is shown on the y axis; different conditions of the experiment, including nonstimulated cells, PMA-stimulated cells, and cells stimulated with PMA in the presence of AK-1 are shown on the x axis. (D) Gating strategy of HIV virus reactivation in the J-LAT A2 cell line experiment. For multiple comparisons, ANOVA test corrected by original FDR method of Benjamini and Hochberg was used to analyze differences between conditions. For all comparisons, P < 0.05 was considered significant. The plots show the median of all experiments for each condition.

References

    1. McArthur JC, Steiner J, Sacktor N, Nath A. 2010. Human immunodeficiency virus-associated neurocognitive disorders: mind the gap. Ann Neurol 67:699–714. 10.1002/ana.22053. - DOI - PubMed
    1. Nightingale S, Dreyer AJ, Saylor D, Gisslén M, Winston A, Joska JA. 2021. Moving on from HAND: why we need new criteria for cognitive impairment in persons living with human immunodeficiency virus and a proposed way forward. Clin Infect Dis 73:1113–1118. 10.1093/cid/ciab366. - DOI - PubMed
    1. Calcagno A, Atzori C, Romito A, Vai D, Audagnotto S, Stella ML, Montrucchio C, Imperiale D, Di Perri G, Bonora S. 2016. Blood brain barrier impairment is associated with cerebrospinal fluid markers of neuronal damage in HIV-positive patients. J Neurovirol 22:88–92. 10.1007/s13365-015-0371-x. - DOI - PubMed
    1. Wallet C, De Rovere M, Van Assche J, Daouad F, De Wit S, Gautier V, Mallon PWG, Marcello A, Van Lint C, Rohr O, Schwartz C. 2019. Microglial cells: the main HIV-1 reservoir in the brain. Front Cell Infect Microbiol 9:362. 10.3389/fcimb.2019.00362. - DOI - PMC - PubMed
    1. Heaton RK, Clifford DB, Franklin DR, Woods SP, Ake C, Vaida F, Ellis RJ, Letendre SL, Marcotte TD, Atkinson JH, Rivera-Mindt M, Vigil OR, Taylor MJ, Collier AC, Marra CM, Gelman BB, McArthur JC, Morgello S, Simpson DM, McCutchan JA, Abramson I, Gamst A, Fennema-Notestine C, Jernigan TL, Wong J, Grant I, CHARTER Group . 2010. HIV-associated neurocognitive disorders persist in the era of potent antiretroviral therapy: charter study. Neurology 75:2087–2096. 10.1212/WNL.0b013e318200d727. - DOI - PMC - PubMed

Publication types