. 2023 Apr;307(2):e221373.
doi: 10.1148/radiol.221373. Epub 2023 Jan 31.

Ablative Margins of Colorectal Liver Metastases Using Deformable CT Image Registration and Autosegmentation

Affiliations

Ablative Margins of Colorectal Liver Metastases Using Deformable CT Image Registration and Autosegmentation

Yuan-Mao Lin et al. Radiology. 2023 Apr.

Abstract

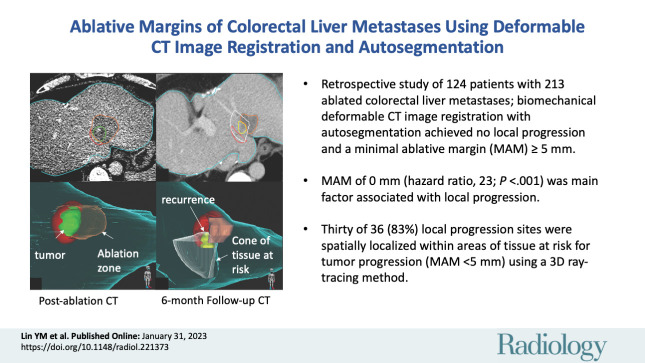
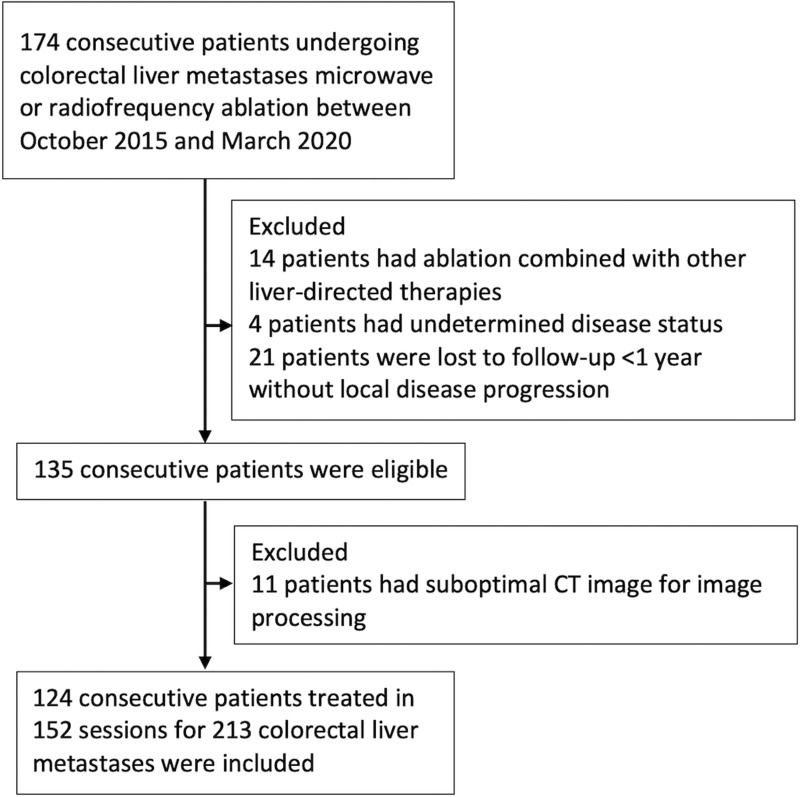
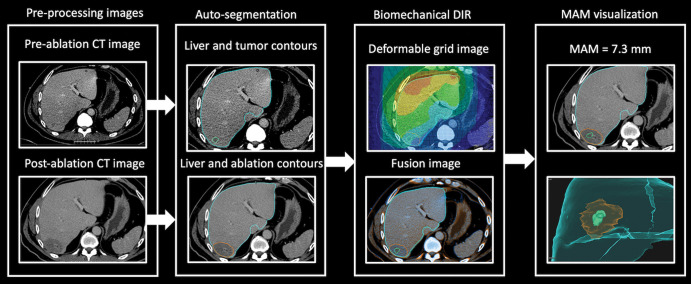
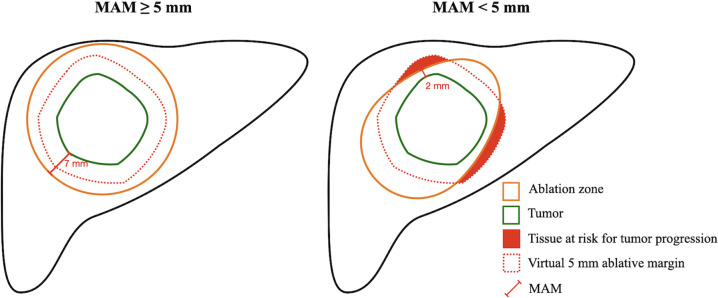
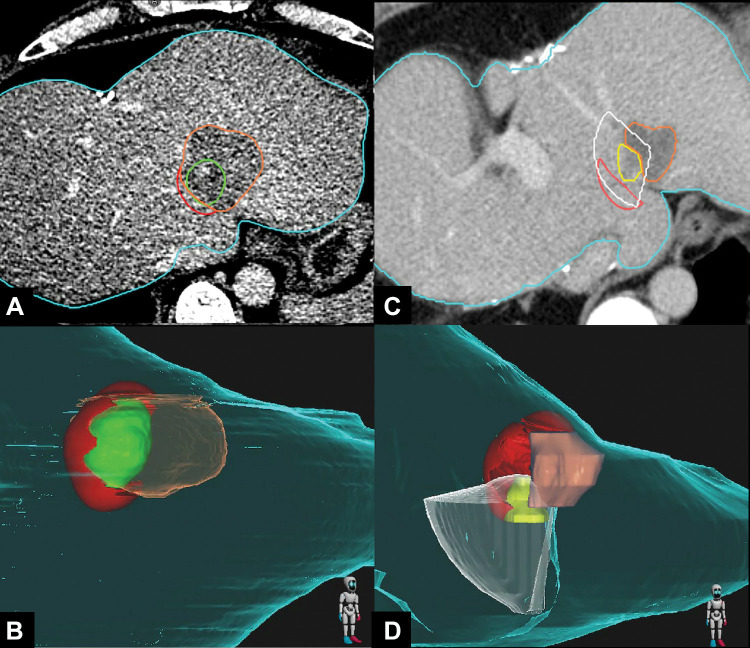
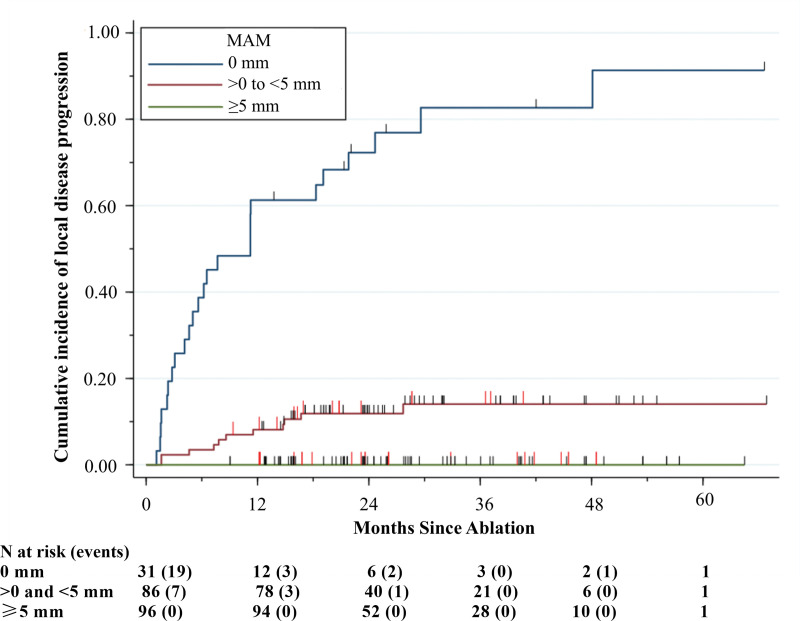
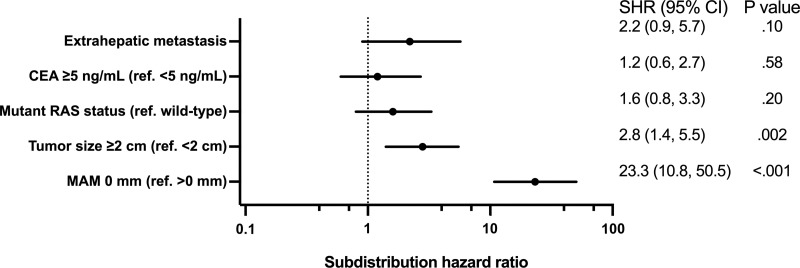
Background Confirming ablation completeness with sufficient ablative margin is critical for local tumor control following colorectal liver metastasis (CLM) ablation. An image-based confirmation method considering patient- and ablation-related biomechanical deformation is an unmet need. Purpose To evaluate a biomechanical deformable image registration (DIR) method for three-dimensional (3D) minimal ablative margin (MAM) quantification and the association with local disease progression following CT-guided CLM ablation. Materials and Methods This single-institution retrospective study included patients with CLM treated with CT-guided microwave or radiofrequency ablation from October 2015 to March 2020. A biomechanical DIR method with AI-based autosegmentation of liver, tumors, and ablation zones on CT images was applied for MAM quantification retrospectively. The per-tumor incidence of local disease progression was defined as residual tumor or local tumor progression. Factors associated with local disease progression were evaluated using the multivariable Fine-Gray subdistribution hazard model. Local disease progression sites were spatially localized with the tissue at risk for tumor progression (<5 mm) using a 3D ray-tracing method. Results Overall, 213 ablated CLMs (mean diameter, 1.4 cm) in 124 consecutive patients (mean age, 57 years ± 12 [SD]; 69 women) were evaluated, with a median follow-up interval of 25.8 months. In ablated CLMs, an MAM of 0 mm was depicted in 14.6% (31 of 213), from greater than 0 to less than 5 mm in 40.4% (86 of 213), and greater than or equal to 5 mm in 45.1% (96 of 213). The 2-year cumulative incidence of local disease progression was 72% for 0 mm and 12% for greater than 0 to less than 5 mm. No local disease progression was observed for an MAM greater than or equal to 5 mm. Among 117 tumors with an MAM less than 5 mm, 36 had local disease progression and 30 were spatially localized within the tissue at risk for tumor progression. On multivariable analysis, an MAM of 0 mm (subdistribution hazard ratio, 23.3; 95% CI: 10.8, 50.5; P < .001) was independently associated with local disease progression. Conclusion Biomechanical deformable image registration and autosegmentation on CT images enabled identification and spatial localization of colorectal liver metastases at risk for local disease progression following ablation, with a minimal ablative margin greater than or equal to 5 mm as the optimal end point. © RSNA, 2023 Supplemental material is available for this article. See also the editorial by Sofocleous in this issue.


Conflict of interest statement

Disclosures of conflicts of interest: Y.M.L. No relevant relationships. I.P. No relevant relationships. C.S.O. No relevant relationships. B.M.A. No relevant relationships. B.R. No relevant relationships. B.M.F. No relevant relationships. K.A.J. No relevant relationships. K.K.B. Grants from the National Institutes of Health and RaySearch Laboratories; licensing agreement with RaySearch Laboratories; travel support from The American Association of Physicists in Medicine; patents planned, issued, or pending; advisory board, RaySearch Laboratories. B.C.O. Research grants from Siemens Healthineers and Johnson & Johnson; consulting fees from Siemens Healthineers.

Figures

None
Graphical abstract
Flowchart shows patient inclusion and exclusion criteria.
Figure 1:
Flowchart shows patient inclusion and exclusion criteria.
Flow diagram shows the steps in biomechanical deformable image
registration (DIR) and minimal ablative margin (MAM) quantification in a
67-year-old man with solitary colorectal liver metastasis. Left: Pre- and
postablation axial contrast-enhanced CT images with artificial
intelligence–based autosegmentation show the liver, tumor, and
ablation zone. Right: Biomechanical DIR is performed to register the pre-
and postablation CT images. Then, the MAM is computed and visualized in
images with two-dimensional and three-dimensional volume
rendering.
Figure 2:
Flow diagram shows the steps in biomechanical deformable image registration (DIR) and minimal ablative margin (MAM) quantification in a 67-year-old man with solitary colorectal liver metastasis. Left: Pre- and postablation axial contrast-enhanced CT images with artificial intelligence–based autosegmentation show the liver, tumor, and ablation zone. Right: Biomechanical DIR is performed to register the pre- and postablation CT images. Then, the MAM is computed and visualized in images with two-dimensional and three-dimensional volume rendering.
Schematic illustrations show minimal ablative margin (MAM)
quantification. Left: The virtual 5-mm ablative margin (red dotted line) is
completely covered by the ablation zone (orange solid line), with an MAM of
7 mm. Right: The virtual 5-mm ablative margin (red dotted line) is not
completely covered by the ablation zone (orange solid line), with remaining
tissue at risk for tumor progression (red) and an MAM of 2 mm.
Figure 3:
Schematic illustrations show minimal ablative margin (MAM) quantification. Left: The virtual 5-mm ablative margin (red dotted line) is completely covered by the ablation zone (orange solid line), with an MAM of 7 mm. Right: The virtual 5-mm ablative margin (red dotted line) is not completely covered by the ablation zone (orange solid line), with remaining tissue at risk for tumor progression (red) and an MAM of 2 mm.
Images in a 41-year-old woman with colorectal liver metastasis who
underwent CT-guided microwave ablation processed with the proposed
biomechanical deformable image registration three-dimensional (3D) minimal
ablative margin (MAM) quantification method. (A, B) Axial contrast-enhanced
CT scan (A) obtained immediately after microwave ablation and corresponding
3D CT volume rendering (B) show autosegmentation of the tumor (green) and
ablation zone (orange). Tissue at risk for tumor progression (red) is
defined as the expanded tumor tissue not covered by the virtual 5-mm
ablative margin. The MAM was determined to be 0 mm. (C, D) Axial
contrast-enhanced CT scan (C) obtained 6 months after ablation and
corresponding 3D CT volume rendering (D) show local tumor progression
(yellow) and the corresponding radiating cone (white), which encompasses the
tissue at risk for tumor progression (red), indicating that the site of
local tumor progression is spatially correlated with the tissue at risk for
tumor progression. The ablation zone (orange) has involuted compared with
previous CT images.
Figure 4:
Images in a 41-year-old woman with colorectal liver metastasis who underwent CT-guided microwave ablation processed with the proposed biomechanical deformable image registration three-dimensional (3D) minimal ablative margin (MAM) quantification method. (A, B) Axial contrast-enhanced CT scan (A) obtained immediately after microwave ablation and corresponding 3D CT volume rendering (B) show autosegmentation of the tumor (green) and ablation zone (orange). Tissue at risk for tumor progression (red) is defined as the expanded tumor tissue not covered by the virtual 5-mm ablative margin. The MAM was determined to be 0 mm. (C, D) Axial contrast-enhanced CT scan (C) obtained 6 months after ablation and corresponding 3D CT volume rendering (D) show local tumor progression (yellow) and the corresponding radiating cone (white), which encompasses the tissue at risk for tumor progression (red), indicating that the site of local tumor progression is spatially correlated with the tissue at risk for tumor progression. The ablation zone (orange) has involuted compared with previous CT images.
Cumulative incidence curve shows the per-tumor cumulative incidence of
local disease progression over time stratified by the three-dimensional
minimal ablative margin (MAM). Vertical red lines indicate death events and
vertical black lines indicate censoring, with death as a competing
risk.
Figure 5:
Cumulative incidence curve shows the per-tumor cumulative incidence of local disease progression over time stratified by the three-dimensional minimal ablative margin (MAM). Vertical red lines indicate death events and vertical black lines indicate censoring, with death as a competing risk.
Forest plot based on multivariable analysis of factors associated with
local disease progression using the competing-risks regression model shows
that tumor size greater than or equal to 2 cm and a minimal ablative margin
(MAM) of 0 mm are independently associated with local disease progression
after thermal ablation. CEA = carcinoembryonic antigen, ref = reference, SHR
= subdistribution hazard ratio.
Figure 6:
Forest plot based on multivariable analysis of factors associated with local disease progression using the competing-risks regression model shows that tumor size greater than or equal to 2 cm and a minimal ablative margin (MAM) of 0 mm are independently associated with local disease progression after thermal ablation. CEA = carcinoembryonic antigen, ref = reference, SHR = subdistribution hazard ratio.

Comment in

References

    1. National Comprehensive Cancer Network . Colon Cancer (Version 1.2022) . https://www.nccn.org/professionals/physician_gls/pdf/colon.pdf. Accessed August 17, 2022 .
    1. Otto G , Düber C , Hoppe-Lotichius M , König J , Heise M , Pitton MB . Radiofrequency ablation as first-line treatment in patients with early colorectal liver metastases amenable to surgery . Ann Surg 2010. ; 251 ( 5 ): 796 – 803 . - PubMed
    1. Abdalla EK , Vauthey JN , Ellis LM , et al . Recurrence and outcomes following hepatic resection, radiofrequency ablation, and combined resection/ablation for colorectal liver metastases . Ann Surg 2004. ; 239 ( 6 ): 818 – 825 ; discussion 825–827 . - PMC - PubMed
    1. Mulier S , Ni Y , Jamart J , Michel L , Marchal G , Ruers T . Radiofrequency ablation versus resection for resectable colorectal liver metastases: time for a randomized trial? Ann Surg Oncol 2008. ; 15 ( 1 ): 144 – 157 . - PubMed
    1. Lin YM , Paolucci I , Brock KK , Odisio BC . Image-Guided Ablation for Colorectal Liver Metastasis: Principles, Current Evidence, and the Path Forward . Cancers (Basel) 2021. ; 13 ( 16 ): 3926 . - PMC - PubMed

Publication types