. 2023 Feb 1;133(3):e162940.
doi: 10.1172/JCI162940.

Neutrophil CEACAM1 determines susceptibility to NETosis by regulating the S1PR2/S1PR3 axis in liver transplantation

Affiliations

Neutrophil CEACAM1 determines susceptibility to NETosis by regulating the S1PR2/S1PR3 axis in liver transplantation

Hirofumi Hirao et al. J Clin Invest. .

Abstract

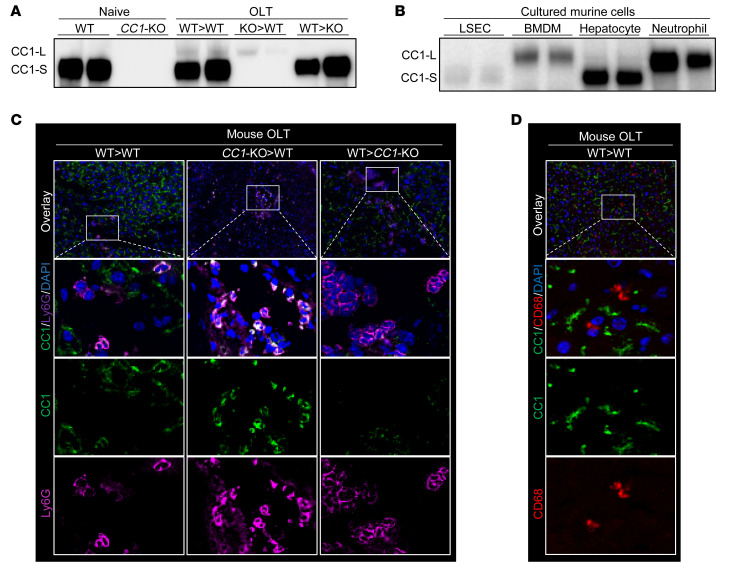
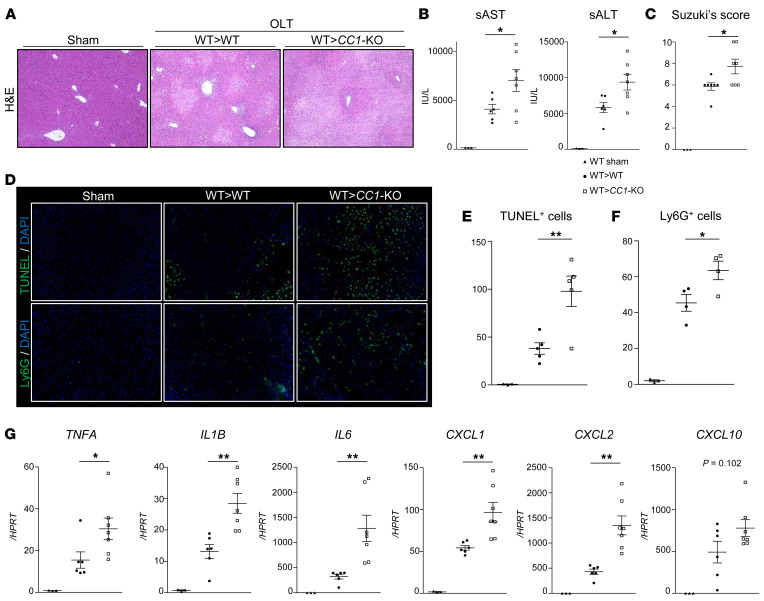
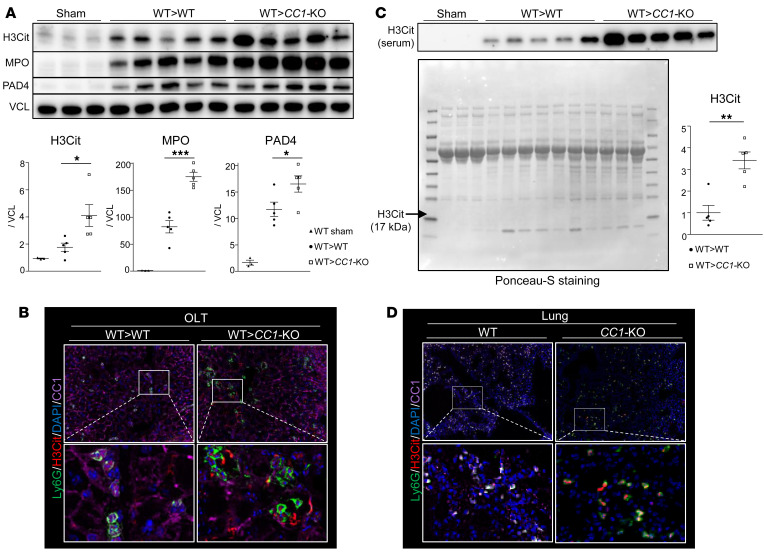
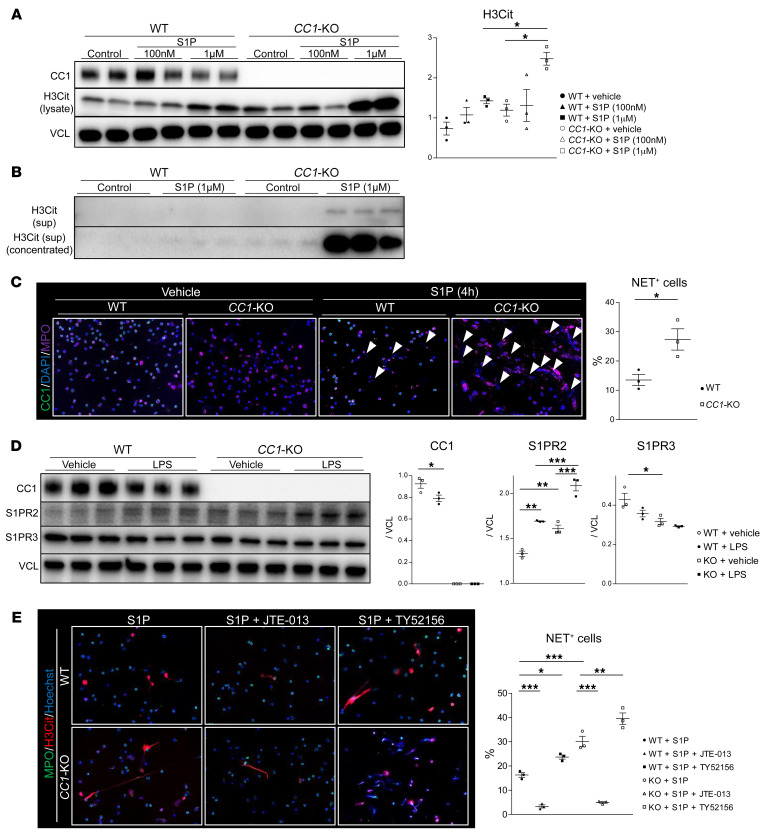
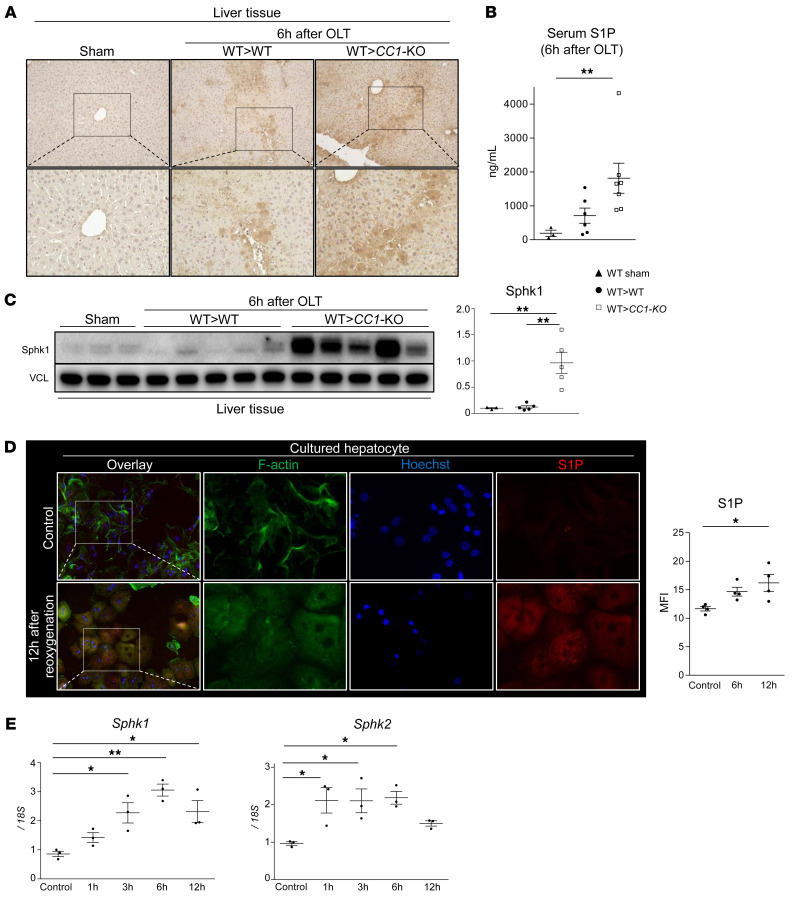
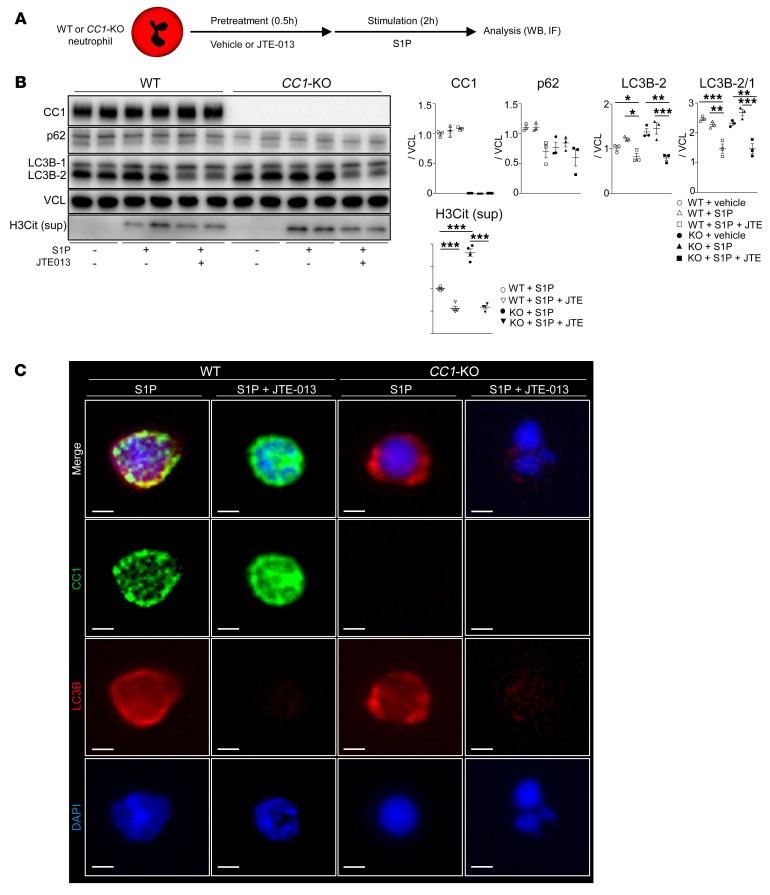
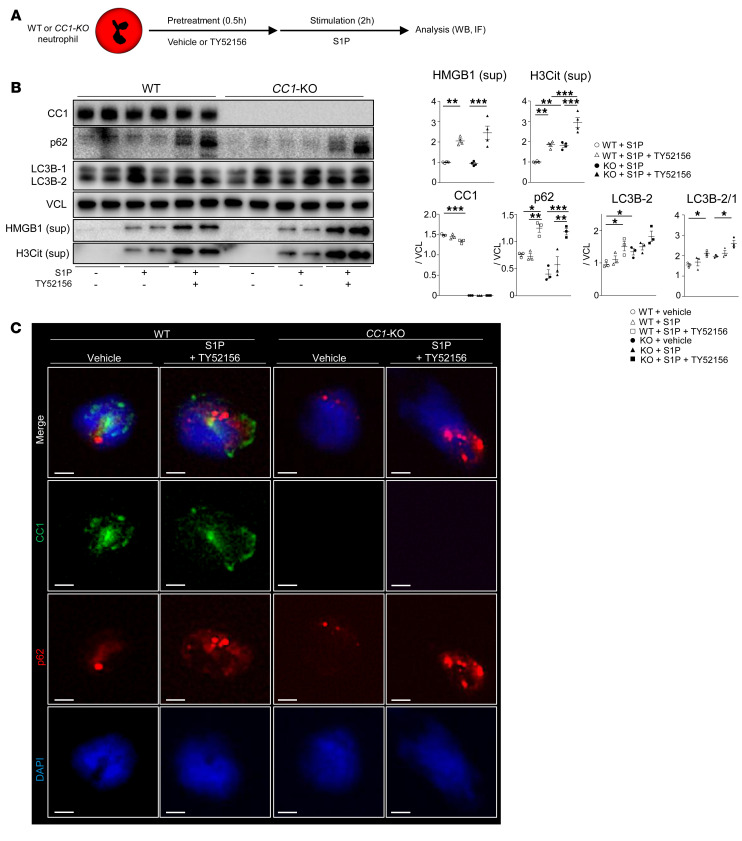
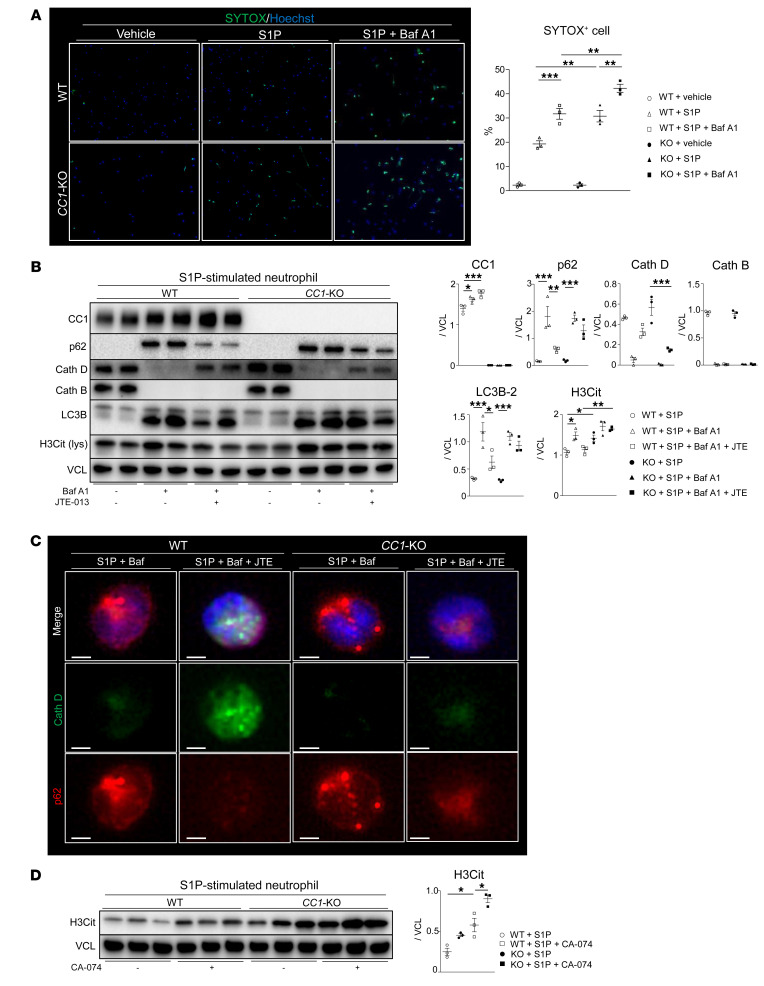
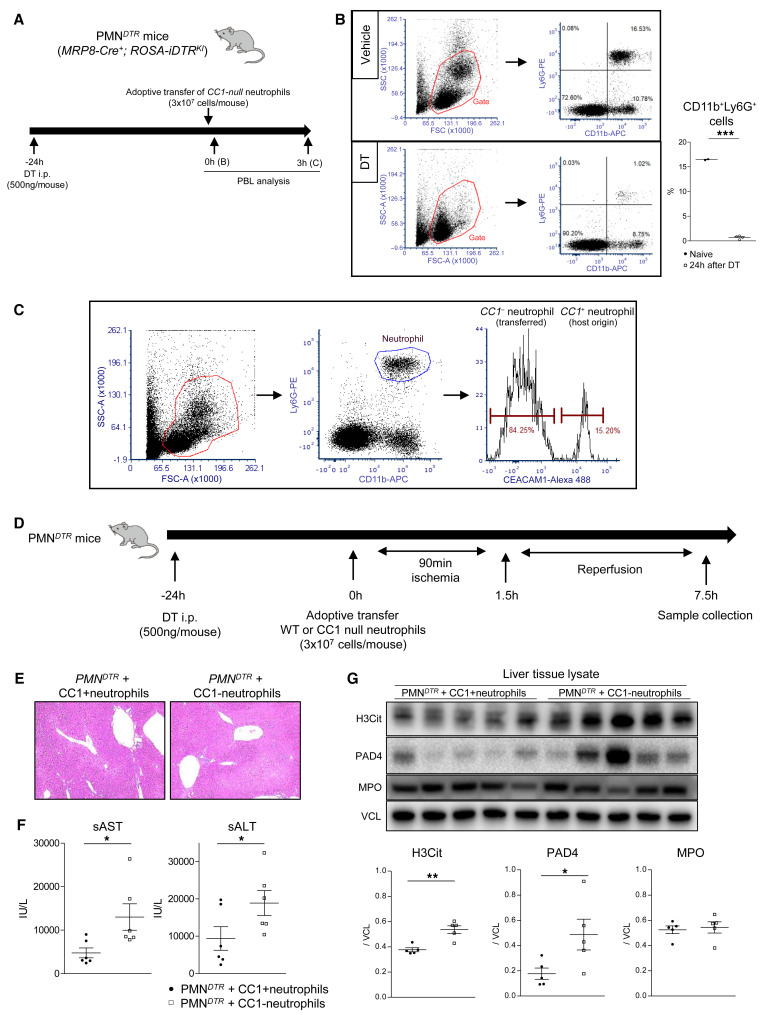
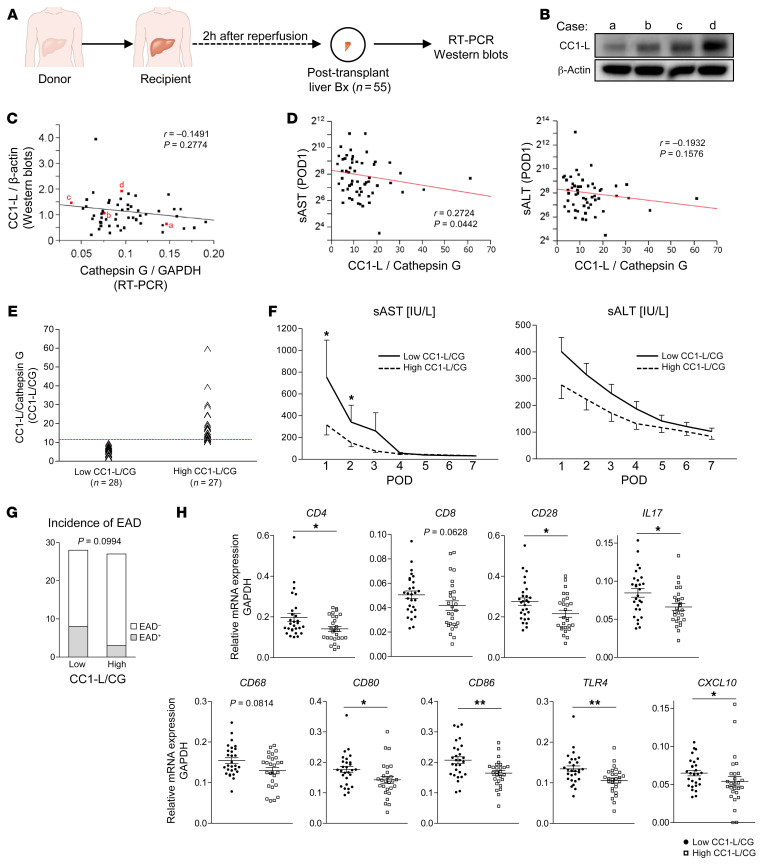
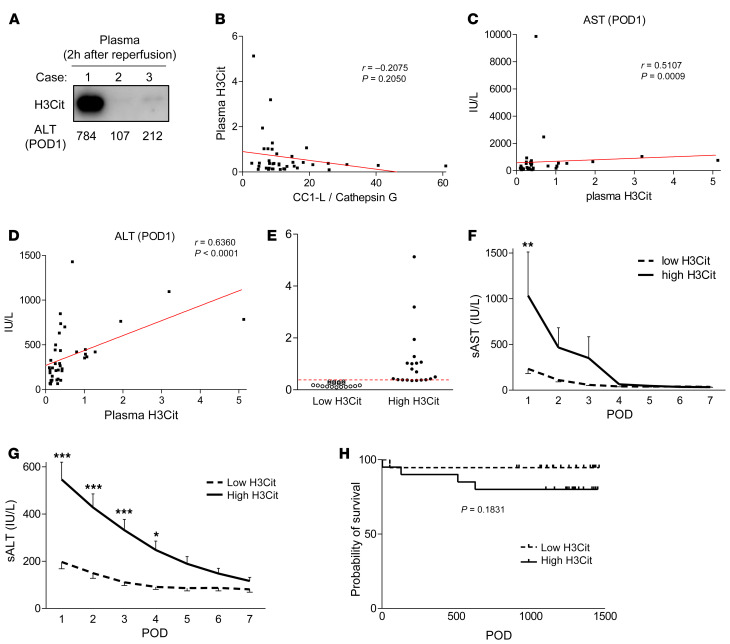
Neutrophils, the largest innate immune cell population in humans, are the primary proinflammatory sentinel in the ischemia-reperfusion injury (IRI) mechanism in orthotopic liver transplantation (OLT). Carcinoembryonic antigen-related cell adhesion molecule 1 (CEACAM1, CC1, or CD66a) is essential in neutrophil activation and serves as a checkpoint regulator of innate immune-driven IRI cascade in OLT. Although CC1 alternative splicing generates two functionally distinct short and long cytoplasmic isoforms, their role in neutrophil activation remains unknown. Here, we undertook molecular and functional studies to interrogate the significance of neutrophil CC1 signaling in mouse and human OLT recipients. In the experimental arm, we employed a mouse OLT model to document that ablation of recipient-derived neutrophil CC1-long (CC1-L) isotype aggravated hepatic IRI by promoting neutrophil extracellular traps (NETs). Notably, by regulating the S1P-S1PR2/S1PR3 axis, neutrophil CC1-L determined susceptibility to NET formation via autophagy signaling. In the clinical arm, liver grafts from 55 transplant patients selectively enriched for neutrophil CC1-L showed relative resistance to ischemia-reperfusion (IR) stress/tissue damage, improved hepatocellular function, and clinical outcomes. In conclusion, despite neutrophils being considered a principal villain in peritransplant tissue injury, their CC1-L isoform may serve as a regulator of IR stress resistance/NETosis in human and mouse OLT recipients.

Keywords: Hypoxia; Neutrophils; Organ transplantation; Transplantation.


Figures

Figure 1
Figure 1. Recipient-derived CC1-L–expressing neutrophils infiltrate mouse OLT.
(A) Mouse donor livers, stored in UW solution (4°C/18 hours), were transplanted into groups of WT and CC1-KO recipients, and OLT samples were collected at 6 hours after reperfusion. WB of CC1-S and CC1-L in naive and posttransplant livers (WT→WT, CC1-KO→WT, WT→CC1-KO). (B) WB of CC1-S and CC1-L in cultured murine cells (LSECs, BMDMs, hepatocytes, and neutrophils). (C) Representative (n = 3) IF images of CC1 (green), Ly6G (purple), and DAPI (blue) in OLT (WT→WT, CC1-KO→WT, WT→CC1-KO). Original magnification, ×200. (D) Representative (n = 3) IF images of CC1 (green), CD68 (red), and DAPI (blue) in OLT (WT→WT). Original magnification, ×200 (top rows); ×1200 (bottom 3 rows).
Figure 2
Figure 2. Recipient CC1-null mutation exacerbates hepatocellular damage and inflammatory response in IR-stressed mouse OLT.
WT donor livers, stored in UW solution (4°C/18 hours), were transplanted into WT or CC1-KO recipients, and OLT samples were collected at 6 hours after reperfusion. (A) Representative H&E staining of sham-treated livers and OLT (WT→WT, WT→CC1-KO). Original magnification, ×100. (B) sAST and sALT levels (IU/L). (C) Suzuki’s histological grading of liver IRI. (D) Representative TUNEL and IF images of OLT-infiltrating Ly6G+ cells/field. Original magnification, ×200. (E and F) Quantification of TUNEL+ cells and Ly6G+ cells. (G) qRT-PCR–assisted detection of mRNA coding for TNFA, IL1B, IL6, CXCL1, CXCL2, and CXCL10. Data were normalized to HPRT gene expression. n = 6–7/group (AC and G); n = 4–5/group (DF). Data are represented as mean ± SEM. *P < 0.05; **P < 0.01, 1-way ANOVA followed by Tukey’s HSD test.
Figure 3
Figure 3. NETs in CC1-deficient OLT.
(A) WB of H3Cit, MPO, and PAD4 in sham-treated and WT livers transplanted into WT versus CC1-KO recipients. Vinculin antibody (VCL) was used as an internal control. Data are represented as mean ± SEM. *P < 0.05; ***P < 0.001, 1-way ANOVA followed by Tukey’s HSD test. n = 3 (sham); n = 5/group (OLT). (B) Representative (n = 3) IF images of H3Cit (red), CC1 (purple), Ly6G (green), and DAPI (blue) in OLT (WT→WT or CC1-KO→WT) are shown. Original magnification, ×400. (C) WB of serum H3Cit expression and Ponceau-S staining of the PVDF membrane. The relative intensity of H3Cit expression in CC1-KO recipients was evaluated by comparing the averages of H3Cit expression in WT recipients’ serum. Data are represented as mean ± SEM. **P < 0.01, Student’s t test. n = 5 each (OLT). (D) Representative (n = 3) IF images of H3Cit (red), CC1 (purple), Ly6G (green), and DAPI (blue) in the lungs of OLT recipients (WT→WT and WT→CC1-KO). Original magnification, ×200 (top rows); ×1200 (bottom rows).
Figure 4
Figure 4. CC1 regulates NETosis via the S1PR2/S1PR3 signaling axis.
(A) WB of CC1, H3Cit (lysate), and VCL in WT or CC1-KO neutrophil cultures after S1P stimulation (100 nM or 1 μM, 4 hours). VCL was used as an internal control. (B) WB of H3Cit in the culture media of WT or CC1-KO neutrophils stimulated with S1P (1 μM, 4 hours). (C) Representative (n = 3) IF images of CC1, MPO, and DAPI in WT versus CC1-null neutrophils stimulated with S1P (1 μM, 4 hours) and quantitated for NET+ cells. Arrowheads indicate nucleus extrusion. Data are represented as mean ± SEM. Original magnification, ×200. *P < 0.05, Student’s t test, n = 3/group. (D) WB-assisted detection and relative intensity ratio of CC1, S1PR2, and S1PR3 expression in LPS-treated WT and CC1-KO neutrophils (500 ng/ml, 3 hours). VCL was used as an internal control for protein analysis. Data are represented as mean ± SEM. *P < 0.05; **P < 0.01; ***P < 0.001, 1-way ANOVA followed by Tukey’s HSD test. n = 3/group. (E) Representative (n = 3) IF images of MPO (green), H3Cit (red), and Hoechst 33342 (blue) in WT versus CC1-null neutrophils stimulated with S1P (1 μM, 4 hours) in the presence of JTE-013 (10 μM, 0.5 hours) or TY52156 (10 μM, 0.5 hours) and quantification of NET+ cells. Original magnification, ×200. Data are represented as mean ± SEM. *P < 0.05; **P < 0.01; ***P < 0.001, 1-way ANOVA followed by Tukey’s HSD test. n = 3/group.
Figure 5
Figure 5. IR stress promotes an S1P-enriched OLT environment.
(A) Representative (n = 2) immunohistochemistry staining for S1P in sham livers and OLT. Original magnification, ×200 (top row); ×400 (bottom row). (B) Serum S1P levels determined by ELISA. (C) WB of Sphk1 in sham-treated and OLT livers (WT→WT versus WT→CC1-KO). VCL was used as an internal control. (D) Representative (n = 3) IF images of F-actin (green), Hoechst 33342 (blue), and S1P (red) in reoxygenated hepatocyte cultures. Original magnification, ×400 (left row); ×1000 (right 3 rows). (E) Time-dependent mRNA expression pattern coding for Sphk1 and Sphk2 in cultured murine hepatocytes subjected to hypoxia reoxygenation. Data are normalized to 18S gene expression. For B, C, D, and E, data are represented as mean ± SEM. *P < 0.05; **P < 0.01, 1-way ANOVA followed by Tukey’s HSD test. n = 3–5/group (B and C); n = 3/group (D and F).
Figure 6
Figure 6. S1PR2 signaling ligation suppresses LC3B lipidation.
(A) Schematic of cell-culture study. (B) WB of CC1, p62, LC3B, and H3Cit (culture media) expression in WT versus CC1-KO neutrophils treated with S1P (1 μM, 2 hours) with or without adjunctive JTE-013 (10 μM, 0.5 hours). Data are represented as mean ± SEM. *P < 0.05; **P < 0.01; ***P < 0.001, 1-way ANOVA followed by Tukey’s HSD test. n = 3/group. (C) Representative (n = 3/group) IF images of CC1 (green), LC3B (red), and DAPI (blue) in WT versus CC1-KO neutrophils stimulated with S1P (1 μM, 2 hours) with or without adjunctive JTE-013 (10 μM, 0.5 hours). Scale bars: 2 μm.
Figure 7
Figure 7. S1PR3 signaling disruption augments p62 and LC3B expression.
(A) Schematic of cell-culture study. (B) WB of CC1, p62, LC3B, HMGB1, and H3Cit in WT versus CC1-KO neutrophils stimulated with S1P (1 μM, 2 hours) with or without adjunctive TY52156 (10 μM, 0.5 hours). VCL was used as an internal control. Data are represented as mean ± SEM. *P < 0.05; **P < 0.01; ***P < 0.001, 1-way ANOVA followed by Tukey’s HSD test. n = 3/group. (C) Representative (n = 3/group) IF images of CC1 (green), p62 (red), and DAPI (blue) in WT versus CC1-KO neutrophil cultures stimulated with S1P (1 μM, 2 hours) with TY52156 (10 μM, 0.5 hours) pretreatment. Scale bars: 2 μm.
Figure 8
Figure 8. Late autophagy stage is essential for H3Cit expression.
(A) Representative IF images of SYTOX green (green) and Hoechst 33342 (blue) in WT or CC1-KO neutrophils conditioned with a vehicle, S1P, and S1P (1 μM, 4 hours) plus Baf A1 (100 nM, 0.5 hours) pretreatment, and quantification of SYTOX green–positive cells. Data are represented as mean ± SEM. **P < 0.01; ***P < 0.001, 1-way ANOVA followed by Tukey’s HSD test. n = 3/group. Original magnification, ×200. (B) WB of CC1, p62, CathD, CathB, LC3B, and H3Cit (cell lysates) in WT versus CC1-KO neutrophils stimulated with S1P (1 μM, 4 hours) with Baf A1 (100 nM, 0.5 hours) alone or Baf A1 plus JTE-013 (100 nM/10 μM, 0.5 hours). VCL was used as an internal control. Data are represented as mean ± SEM. *P < 0.05; **P < 0.01; ***P < 0.001, 1-way ANOVA followed by Tukey’s HSD test. n = 4/group. (C) Representative (n = 3/group) IF images of CathD (green), p62 (red), CC1 (purple), and DAPI (blue) in S1P-stimulated (1 μM, 4 hours) WT or CC1-KO neutrophils with Baf A1 (100 nM, 0.5 hours) or Baf A1 plus JTE-013 (100 nM/10 μM, 0.5 hours) pretreatment. Scale bars: 2 μm. (D) WB of H3Cit in WT versus CC1-KO neutrophils stimulated with S1P (1 μM, 4 hours) with or without CA-074 pretreatment (10 μM, 0.5 hours). VCL was used as an internal control. Data are represented as mean ± SEM. *P < 0.05, 1-way ANOVA followed by Tukey’s HSD test. n = 3/group.
Figure 9
Figure 9. Adoptive transfer of CC1-null neutrophils exacerbates liver IRI and enhances H3Cit expression in PMNDTR mice.
(A) Experimental schematic of DT treatment, followed by adoptive transfer of CC1-null neutrophils into PMNDTR mice. (B) Gating peripheral blood analysis with CD11b+ and Ly6G+ cells by flow cytometry and the proportion of CD11b+Ly6G+ cells after vehicle versus DT administration. Data are represented as mean ± SEM. ***P < 0.001, Student’s t test. n = 2–3/group. (C) Analysis of CC1+ and CC1 neutrophil populations in PMNDTR mouse conditioned with CC1-null neutrophils. (D) Experimental schematic of PMNDTR treatment, followed by neutrophil reconstitution and warm hepatic IRI. (E) Representative H&E staining of IR-stressed livers. Original magnification, ×100. (F) sAST and sALT levels. Data are represented as mean ± SEM. *P < 0.05, Student’s t test. n = 5/group. (G) WB of H3Cit, PAD4, and MPO in post-IRI livers in PMNDTR mice. VCL was used as an internal control. Data are represented as mean ± SEM. *P < 0.05; **P < 0.01, Student’s t test. n = 5/group.
Figure 10
Figure 10. CC1-L level and CC1-L/CathG ratio are associated with hepatocellular function and innate/adaptive immune responses in OLT patients.
(A) Human OLT Bx (n = 55), collected 2 hours after reperfusion, were analyzed for CC1-L by WB with β-actin normalization and for CathG by qRT-PCR with normalization to GAPDH. (B) Four representative WB of CC1-L expression are shown. Case a, low–CC1-L; cases b/c, intermediate CC1-L; case d, high–CC1-L. (C) Relationship between CC1-L and CathG. (D) Relationship between CC1L/CathG and sAST/sALT at POD1. r, Spearman’s correlation coefficient. (E) Human OLT Bx samples (2 hours after reperfusion) were classified into low (n = 28) and high (n = 27) CC1-L/CathG groups. (F) sAST and sALT levels at POD1–7. *P < 0.05, Mann-Whitney U test. Data are represented as mean ± SEM. (G) Incidence of EAD. Fisher’s exact test. (H) qRT-PCR–assisted detection of mRNA coding for CD4, CD8, CD28, IL17, CD68, CD80, CD86, TLR4, and CXCL-10. Data normalized to GAPDH gene expression are shown in dot plots, and bars indicate mean ± SEM. *P < 0.05; **P < 0.01, Mann-Whitney U test.
Figure 11
Figure 11. Post-OLT H3Cit plasma levels determine the hepatocellular function in OLT patients.
(A) WB of H3Cit in human plasma samples collected 2 hours after OLT and sALT levels at POD1. Case 1, high H3Cit; case 2, low H3Cit; case 3, intermediate H3Cit. (B) Relationship between plasma H3Cit and CC1L/CathG ratio. (C and D) Relationship between plasma H3Cit and sAST/sALT at POD1. r, Spearman’s correlation coefficient. (E) Human plasma samples (2 hours after OLT) were classified into low (n = 19) and high (n = 20) H3Cit groups. (F and G) sAST and sALT levels at POD1–7. Data are represented as mean ± SEM. *P < 0.05; **P < 0.01; ***P < 0.001, Mann-Whitney U test. (H) Cumulative probability of overall graft survival. Solid line indicates high H3Cit, while dotted line depicts low H3Cit in OLT patients. Kaplan-Meier method, log-rank test.

Comment in

  • Avoid being trapped by your liver: Ischemia-reperfusion injury in liver transplant triggers SP1-mediated NETosis

Similar articles

Cited by

References

    1. Hirao H, et al. Liver ischaemia-reperfusion injury: a new understanding of the role of innate immunity. Nat Rev Gastroenterol Hepatol. 2022;19(4):239–256. doi: 10.1038/s41575-021-00549-8. - DOI - PubMed
    1. Dery KJ, et al. Mechanistic control of carcinoembryonic antigen-related cell adhesion molecule-1 (CEACAM1) splice isoforms by the heterogeneous nuclear ribonuclear proteins hnRNP L, hnRNP A1, and hnRNP M. J Biol Chem. 2011;286(18):16039–16051. doi: 10.1074/jbc.M110.204057. - DOI - PMC - PubMed
    1. Kim WM, et al. CEACAM1 structure and function in immunity and its therapeutic implications. Semin Immunol. 2019;42:101296. doi: 10.1016/j.smim.2019.101296. - DOI - PMC - PubMed
    1. Nakamura K, et al. Hepatic CEACAM1 expression indicates donor liver quality and prevents early transplantation injury. J Clin Invest. 2020;130(5):2689–2704. doi: 10.1172/JCI133142. - DOI - PMC - PubMed
    1. Castanheira FVS, Kubes P. Neutrophils and NETs in modulating acute and chronic inflammation. Blood. 2019;133(20):2178–2185. doi: 10.1182/blood-2018-11-844530. - DOI - PubMed

Publication types