. 2023 Feb 1;133(3):e157272.
doi: 10.1172/JCI157272.

NLRP12 is an innate immune checkpoint for repressing IFN signatures and attenuating lupus nephritis progression

Affiliations

NLRP12 is an innate immune checkpoint for repressing IFN signatures and attenuating lupus nephritis progression

Yen-Po Tsao et al. J Clin Invest. .

Erratum in

Abstract

Signaling driven by nucleic acid sensors participates in interferonopathy-mediated autoimmune diseases. NLRP12, a pyrin-containing NLR protein, is a negative regulator of innate immune activation and type I interferon (IFN-I) production. Peripheral blood mononuclear cells (PBMCs) derived from systemic lupus erythematosus (SLE) patients expressed lower levels of NLRP12, with an inverse correlation with IFNA expression and high disease activity. NLRP12 expression was transcriptionally suppressed by runt-related transcription factor 1-dependent (RUNX1-dependent) epigenetic regulation under IFN-I treatment, which enhanced a negative feedback loop between low NLRP12 expression and IFN-I production. Reduced NLRP12 protein levels in SLE monocytes was linked to spontaneous activation of innate immune signaling and hyperresponsiveness to nucleic acid stimulations. Pristane-treated Nlrp12-/- mice exhibited augmented inflammation and immune responses; and substantial lymphoid hypertrophy was characterized in NLRP12-deficient lupus-prone mice. NLRP12 deficiency mediated the increase of autoantibody production, intensive glomerular IgG deposition, monocyte recruitment, and the deterioration of kidney function. These were bound in an IFN-I signature-dependent manner in the mouse models. Collectively, we reveal a remarkable link between low NLRP12 expression and lupus progression, which suggests the impact of NLRP12 on homeostasis and immune resilience.

Keywords: Autoimmunity; Cytokines; Inflammation; Innate immunity; Lupus.


Conflict of interest statement

Conflict of interest: The authors have declared that no conflict of interest exists.

Figures

Figure 1
Figure 1. PBMCs from SLE patients exhibit low NLRP12 expression.
(A) NLRP12 expression in SLE PBMCs relative to healthy controls was determined by quantitative reverse-transcriptase PCR (RT-qPCR). Relative NLRP12 expression was analyzed by the ΔΔCt = (ΔC_SLE–CtNorm(health)) and 2(–ΔΔCt) algorithm, and NLRP12 expression level in healthy controls was set as 1. Levels of (B) complement C3, (C) anti-dsDNA, and (D) anti-Sm Abs and corresponding NLRP12 expression were grouped and are shown. (E) Regression of NLRP12 expression and anti-Sm Abs. (F) Relative IFNA expression and corresponding NLRP12 expression were grouped and are shown. (G) Regression of NLRP12 and IFNA expression in SLE PBMCs. (H) Relative NLRP12 expression in PBMCs from SLE patients at visit follow-up. (I) NLRP12 expression in SLE monocytes relative to healthy monocytes. (J) Regression assay of NLRP12 and IFNA expression in SLE monocytes. (K and L) THP-1 cells were transfected with poly(I:C) and poly(dA:dT). NLRP12 and IFNA expression were measured. (M) NLRP12 expression of the IFN-α2–treated THP-1 cells. (N) Regression of NLRP12 expression of serum-treated THP-1 and levels of IFN-α in corresponding serum. (O) NLRP12 expression of serum-treated or 2-fold diluted serum-treated THP-1 cells. (P) THP-1 cells were treated with healthy (n = 10) or SLE (n = 24) sera. (Q) Sera from SLE patients (n = 24) with and without detectable IFN-α were grouped, and corresponding SLEDAI-2K was recorded. (B, C, and F) Two-tailed Student’s t test; (D, P, and Q) Mann-Whitney U test; (E, G, J, and N) Spearman’s correlation; (KM) 1-way ANOVA test (multiple samples with mock control). Data are represented as mean ± SEM. *P < 0.05; **P < 0.01; ***P < 0.001; ****P < 0.0001.
Figure 2
Figure 2. NLRP12 promoter contains RUNX1-binding sites.
(A) Sequence of human NLRP12 promoter region from –751 to +222 bp. Letters in boxes denote binding sequences for RUNX1. (B) Schematic representation of NLRP12 promoter luciferase reporter constructs. For promoter analysis, an 830 bp length of NLRP12 promoter was cloned into pGL4-vector to drive luciferase reporter expression (NLRP12-Luc#1). Deletion constructs of NLRP12 promoter cloned into pGL4 vector are shown. Vertical lines are denoted as the RUNX1-binding motif on the NLRP12 promoter. (C) HEK293T cells were transfected with NLRP12-Luc#1 to NLRP12-Luc#4 plasmid and the internal control plasmid. Relative luciferase activity (rel. luc act.) was determined at 24 hours after transfection. (D) HEK293T cells transfected with NLRP12-Luc#1 and empty vector (EV) (pCDNA3) or RUNX-encoding plasmid (pCDNA3/DDK-RUNX1; 30, 100, 300, 500 ng/sample) and cell lysates were subjected to measurement of luciferase activity at 24 hours. (E and F) Human HT1080 and HEK293T cells were transfected with NLRP12-Luc#1 to NLRP12-Luc#4 for 6 hours, followed by IFN-α2 or VSV stimulation. Luciferase assays were performed at 24 hours. (G) Knockout of RUNX1 in THP-1 cells by CRISPR Cas9/sgRNA. (H) THP-1 cells with scrambled sgRNA or sgRNA targeting RUNX1 were treated with IFN-α2 or infected with VSV for 8 hours. NLRP12 expression was measured. (CF) One-way ANOVA test (multiple samples to a control); (H) 2-tailed Student’s t test. Data are represented as mean ± SEM (n = 5). *P < 0.05; **P < 0.01; ***P < 0.001.
Figure 3
Figure 3. Increased binding of RUNX1 to the NLRP12 promoter region.
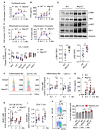
(A and B) THP-1 cells treated with IFN-α2 or infected with VSV. RUNX1 expression was determined at indicated time points. (C) Human CD14+ monocytes treated with IFN-α2 or infected with VSV. Levels of nuclear RUNX1 protein were analyzed with immunoblot. Histone 3 was used as a loading control. (D) Schematic representation of NLRP12 gene from (+1). Vertical lines represent putative RUNX1-binding motifs. The locations of the EMSA probe and PCR products that are covered with the 2 RUNX1-binding sites or 3′ UTR of the NLRP12 promoter are shown. (E and F) Nuclear extracts obtained from CD14+ monocytes were treated with IFN-α2 or VSV. EMSA was conducted by using a biotin-labeled probe, and excess unlabeled probe was used to compete for this binding to validate the binding specificity. (G and H) CD14+ monocytes treated with IFN-α2 or VSV for 2 and 4 hours followed by a ChIP assay. (I) Lysates from CD14+ monocytes of healthy donors (n = 14) and SLE patients (n = 18) were subjected to immunoblot analysis. Representative image and quantitative densitometry are shown. (J) PBMCs from healthy donors and SLE patients (n = 11) were collected for ChIP analysis. (AH) One-way ANOVA (multiple samples to the mock control); (I) 2-tailed Student’s t test; (J) Mann-Whitney U test. Data are represented as mean ± SEM. *P < 0.05; **P < 0.01; ***P < 0.001.
Figure 4
Figure 4. HDAC is involved in IFN-I–mediated transcriptional suppression of NLRP12 expression.
(A and B) THP-1 cells were preincubated with inhibitors for 30 minutes followed by treating cells with IFN-α2 for 6 hours. NLRP12 expression was measured. (B) Restoration of NLRP12 expression was calculated by setting NLRP12 expression in IFN-α2–treated cells (DMSO) as 1. Relative NLRP12 expression in the presence of inhibitors to DMSO group was measured. (C) THP-1/sg-scramble and THP-1/sg-RUNX1 were preincubated with TSA and SAHA and then treated with IFN-α2. NLRP12 expression was measured. (D and E) THP-1/sg-scramble and THP-1/sg-RUNX1 treated with IFN-α2 were collected for ChIP analysis, in which the DNA-protein complex was pulled down by using control IgG and Abs to HDAC1 and acetyl-histone 3. Region of NLRP12 promoter and 3′ UTR was amplified as in previous description. (F) PBMCs (n = 5) from healthy donors and SLE patients were collected for ChIP analysis using a control IgG and an Ab to HDAC1. Region of NLRP12 promoter was amplified. (G) PBMCs from SLE patients (n = 10) were treated with DMSO or TSA for 4 hours.NLRP12 expression relative to healthy PBMCs (n = 10) was measured. (H) CD14+ monocytes (n = 3) were treated with TSA for the entire period or for 4 hours, and TSA was removed, cells were transfected with poly(dA:dT), and IFNA expression was measured at 16 hours. (A) Two-tailed Student’s t test; (BE, G, and H) 1-way ANOVA (multiple samples to the DMSO, or mock, or healthy control); (F) Mann-Whitney U test. Data are represented as mean ± SEM (n ≥ 5). *P < 0.05; **P < 0.01; ***P < 0.001.
Figure 5
Figure 5. NLRP12 involved in innate immune signaling to negatively regulate cytokine production in response to nucleic acid stimulation.
(A) THP-1/sg-scramble and THP-1/sg-RUNX1 were transfected with poly(dA:dT), and gene expression was measured. (B) HEK293T cells were cotransfected with 100 ng of IFN-β luciferase reporter, indicated plasmids (STING, TBK1 or IRF-3), and empty vector (pCDNA3) or NLRP12-encoding plasmid (pCDNA3/HA-NLRP12, 300 ng/sample). Luciferase assays were performed at 24 hours. (C) Mouse BMDCs from WT and Nlrp12–/– mice were transfected with poly(dA:dT). Immunoblot was conducted and representative images and densitometry (relative to 0 hours) are shown. Bands were normalized with individual GAPDH. Ratio of phosphorylated protein to the total target protein was determined from 3 independent experiments. (D) WT and Nlrp12–/– BMDCs were transfected with poly(dA:dT). Cytokine production was measured at 24 hours. (E) Human CD14+ monocytes from healthy donors and SLE patients were transfected with poly(dA:dT). Representative blots and densitometry are shown (n = 6). (F) CD14+ monocytes from healthy donors (n = 8) and SLE patients (n = 10) were transfected with poly(dA:dT). Cytokine production was measured at 24 hours. (G) Human CD14+ monocytes were preincubated with Abs to IFNAR2 for 30 minutes followed by transfecting cells with poly(dA:dT). Gene expression was analyzed at 16 hours. (H) Heatmap showing 2 DEG comparisons: (i) healthy monocytes versus IFN-α2–treated healthy monocytes (IFN-α), and (ii) IFN-α2–treated healthy monocytes versus SLE monocytes in each category. Color bars indicate scores of log2-fold change for each comparison. Data are represented as mean ± SEM. *P < 0.05; **P < 0.01; ***P < 0.001. Student’s t test (AE, G); Mann-Whitney U test (F).
Figure 6
Figure 6. NLRP12-deficient mice display greater immune response and higher IFN-I production in response to pristane injection.
Mice receiving pristane injection were sacrificed at indicated time points. (A) Numbers of infiltrated cells in the peritoneal cavity were recorded. (B) Amount of TNF in peritoneal lavage fluid was measured by cytometric bead array (CBA) analysis. (C) The numbers and percentages of recruited inflammatory monocytes were measured by FACS. (D) The gene expression of IFN signatures in PECs was measured; data were displayed with ΔCt, which stands for absolute gene expression level. (E) Representative immunoblots of the PECs at 1 month after injection and quantitative densitometry are shown. (F) IFN-α expression in peritoneal Ly6ChiCCR2hiCD11B+CD11CF4/80+ inflammatory monocytes and CD11B+CD11C+F4/80+Ly6CLy6G DCs was measured by FACS. Histogram from a representative sample at 0.5 months after injection (left). Data compilations (n = 6~9, right) were expressed as the MFI relative to the corresponding isotype control. (G) IFN-α amounts in peritoneal lavage fluid were measured by ELISA. (H) Relative MHC class II (MHC II) expression of splenic CD11C+ DCs and (I) relative CD44 expression of splenic CD4+ T cells were measured by FACS. (J) Representative dot blots of the proportion of CD19+- and CD138+-expressing cells in splenocytes from mice at 3 months after injection (left). Data (n = 8 each, right) show percentages of B cell (CD3CD19+) and plasma cell (CD3CD19CD138+) populations. Percentages of plasma cells were compared between WT and Nlrp12–/– mice and analyzed with 2-tailed Student’s t test. (FI). Two-tailed Student’s t test. Data are represented as mean ± SEM. *P < 0.05; **P < 0.01; ***P < 0.001.
Figure 7
Figure 7. NLRP12-deficient mice presented more severe disease course in the pristane-induced lupus-like model.
(A) Levels of serum anti-dsDNA Abs and (B) anti-RNP Abs in WT and Nlrp12–/– mice were measured. (C) Immunofluorescence staining of IgG from kidney sections at fifth, seventh, and ninth months in WT and Nlrp12–/– mice. (D) FACS analysis of population of myeloid immune cells in kidney including inflammatory monocytes, Mac2+ macrophages, granulocytes, and CD11C+ cells. (E) Representative CD430- and (F) PAS-stained WT and Nlrp12–/– glomeruli. (G) Calculation of the average of mesangial area in glomerulus using the MetaMorph Imaging System (Molecular Devices). (H) Measurement of mouse urine ACR. (I) Measurement of mouse serum creatinine. (J) Representative IgG-, CD43-, and PAS-stained Nlrp12–/–Ifnar1–/– and Nlrp12–/– glomeruli at the ninth month. (K) Representative IgG- and PAS-stained glomeruli from WT and Nlrp12–/– mice treated with IMQ for 5 weeks. Two-tailed Student’s t test. Data are represented as mean ± SEM. *P < 0.05; **P < 0.01; ***P < 0.001. Scale bars: 50 μm.
Figure 8
Figure 8. NLRP12 deficiency enhances expansion of immune cells in Faslpr mice that exacerbates the progression of GN.
(A) Weight of spleens and total number of splenocytes were recorded. (B) Number of splenic TCRβ+CD3+CD4CD8 B220+ (DN) T cells and (C) expression levels of CD44 in DN T subset were analyzed by FACS. (D) Expression of Isg15 and Cxcl10 in splenocytes. (E) Amounts of serum IFN-α were measured by ELISA. (F) Numbers of splenic CD11B+and CD11C+ cells and (G) expression levels of MHC class II on CD11B+CD11C+ cells were analyzed by FACS. (H) Amounts of serum IL-6 were measured by ELISA. (I) Representative dot blots of the proportion of CD19+- and CD138+-expressing cells in splenocytes from mice. Compiled data (WT and Nlrp12–/–, n = 10; WT/lpr and Nlrp12–/–/lpr mice, n = 20) showed percentages of B cell (CD3CD19+ CD138) and plasma cell (CD3CD19CD138+) populations. (J) Levels of serum anti-dsDNA and anti-RNP Abs from WT/lpr and Nlrp12–/–/lpr mice were measured. (K) Representative IgG-stained WT/lpr mice and Nlrp12–/–/lpr glomeruli. (L) Representative CD43- and PAS-stained WT/lpr mice and Nlrp12–/–/lpr glomeruli at ninth month. Scale bars: 50 μm. (M) Measurement of urine ACR and (N) serum creatinine. (O) Percentages of glomerulus index distribution in WT/lpr and Nlrp12–/–/lpr mice. (AE, F, and G) Shown are data from 28- to 30-week-old mice, n = 10–18; (E and H) 28- to 40-week-old mice, n = 20–28. (A, B, and F) One-way ANOVA; (CE and GN) 2-tailed Student’s t test. Data are represented as mean ± SEM. *P < 0.05; **P < 0.01; ***P < 0.001.

References

    1. Merrill JT, et al. Efficacy and safety of rituximab in moderately-to-severely active systemic lupus erythematosus: the randomized, double-blind, phase II/III systemic lupus erythematosus evaluation of rituximab trial. Arthritis Rheum. 2010;62(1):222–233. doi: 10.1002/art.27233. - DOI - PMC - PubMed
    1. Barrat FJ, et al. Nucleic acids of mammalian origin can act as endogenous ligands for Toll-like receptors and may promote systemic lupus erythematosus. J Exp Med. 2005;202(8):1131–1139. doi: 10.1084/jem.20050914. - DOI - PMC - PubMed
    1. Kato Y, et al. Apoptosis-derived membrane vesicles drive the cGAS-STING pathway and enhance type I IFN production in systemic lupus erythematosus. Ann Rheum Dis. 2018;77(10):1507–1515. doi: 10.1136/annrheumdis-2018-212988. - DOI - PMC - PubMed
    1. Celhar T, et al. TLR7 and TLR9 in SLE: when sensing self goes wrong. Immunol Res. 2012;53(1-3):58–77. doi: 10.1007/s12026-012-8270-1. - DOI - PubMed
    1. Pisitkun P, et al. Autoreactive B cell responses to RNA-related antigens due to TLR7 gene duplication. Science. 2006;312(5780):1669–1672. doi: 10.1126/science.1124978. - DOI - PubMed

Publication types