. 2023 Feb 1;133(3):e160456.
doi: 10.1172/JCI160456.

PD-L1 translocation to the plasma membrane enables tumor immune evasion through MIB2 ubiquitination

Affiliations

PD-L1 translocation to the plasma membrane enables tumor immune evasion through MIB2 ubiquitination

Xinfang Yu et al. J Clin Invest. .

Abstract

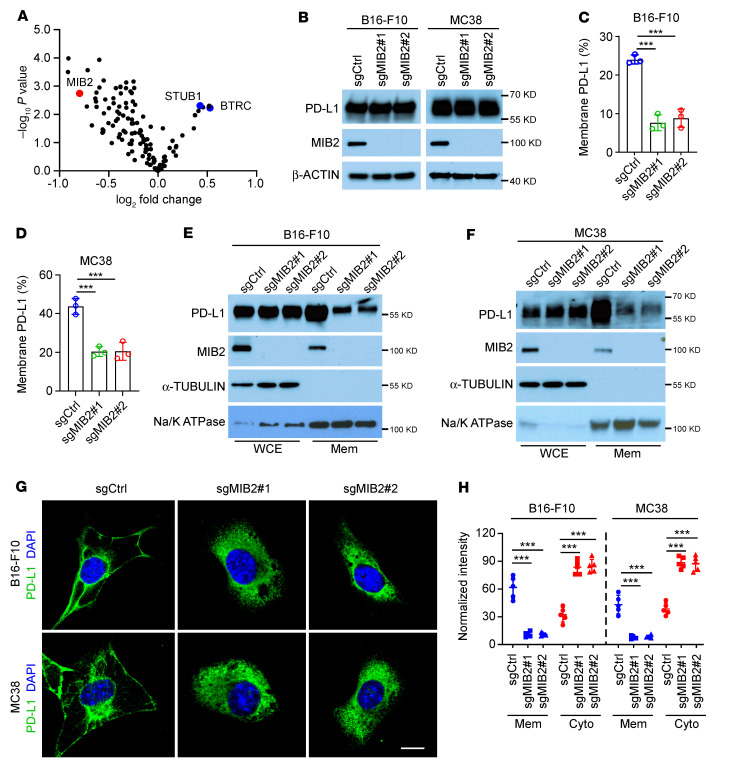
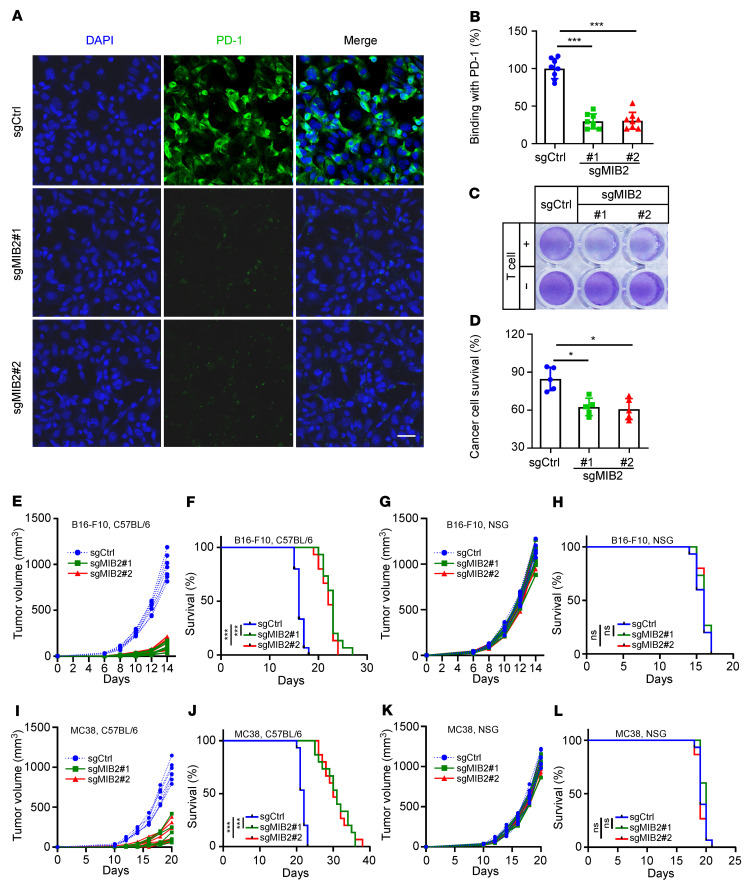
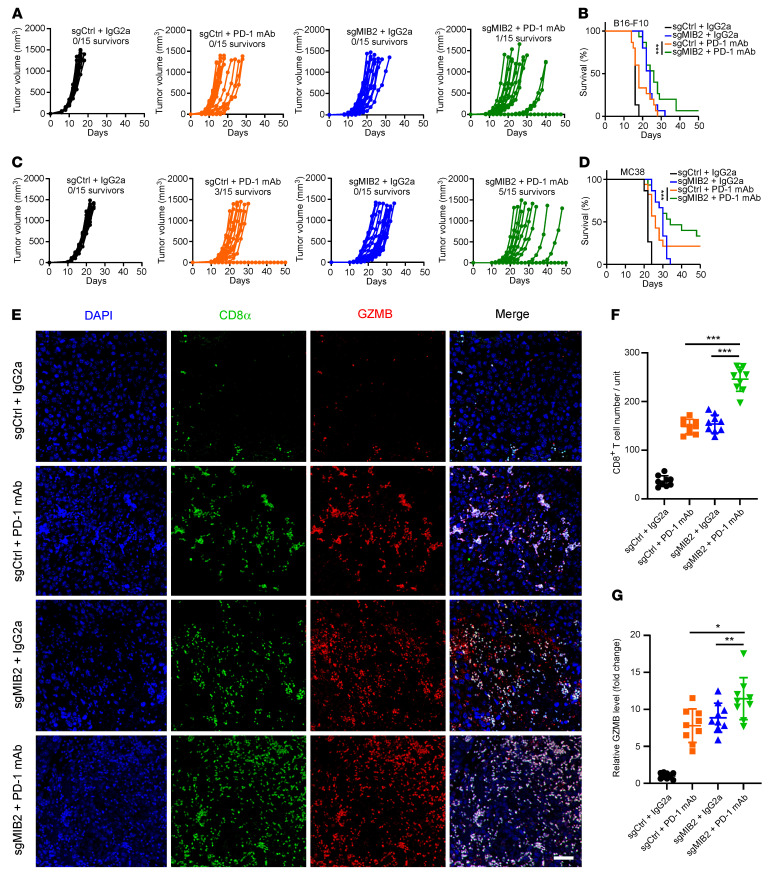
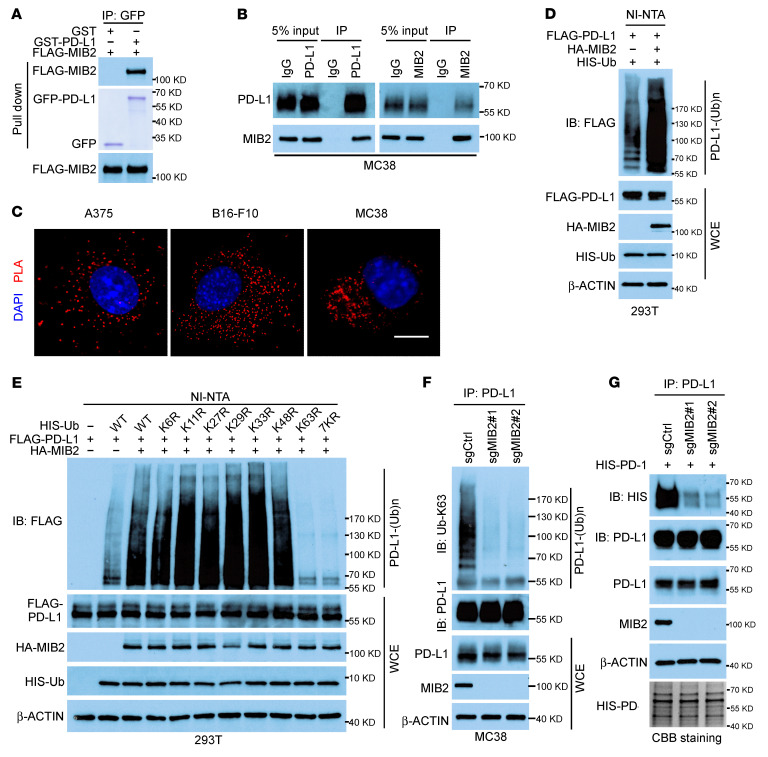
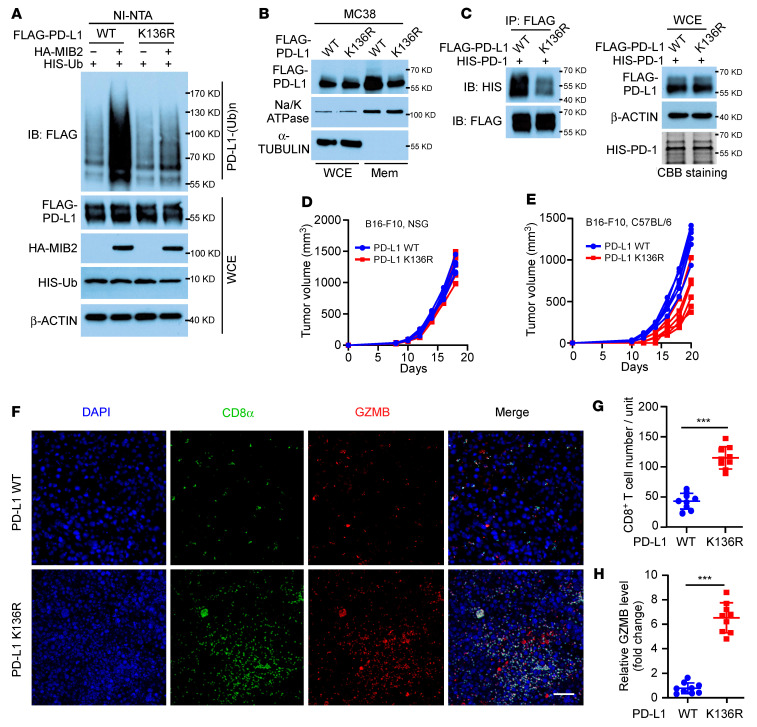
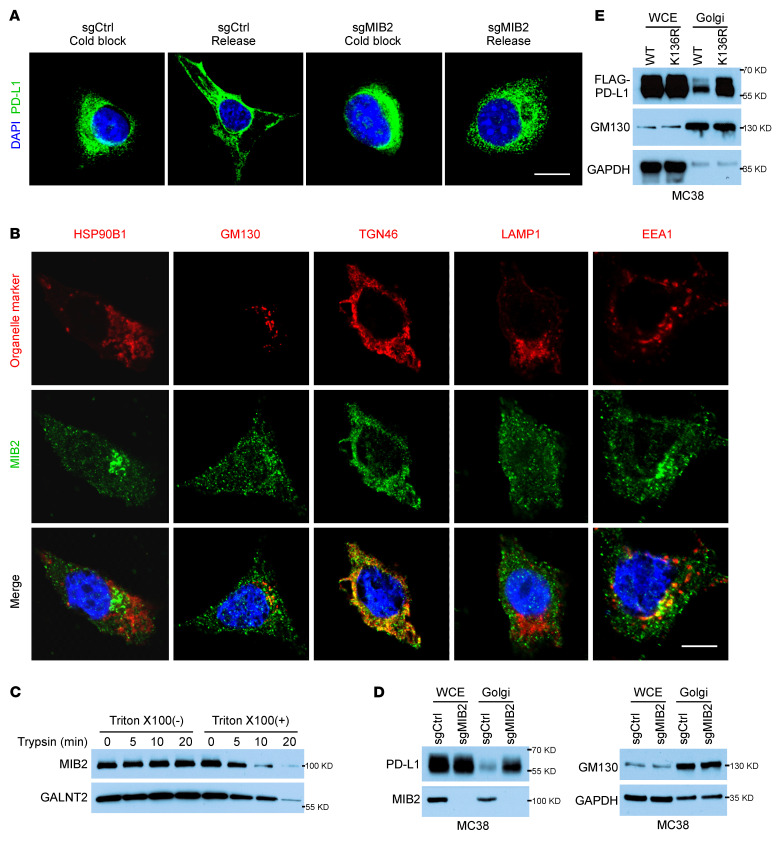
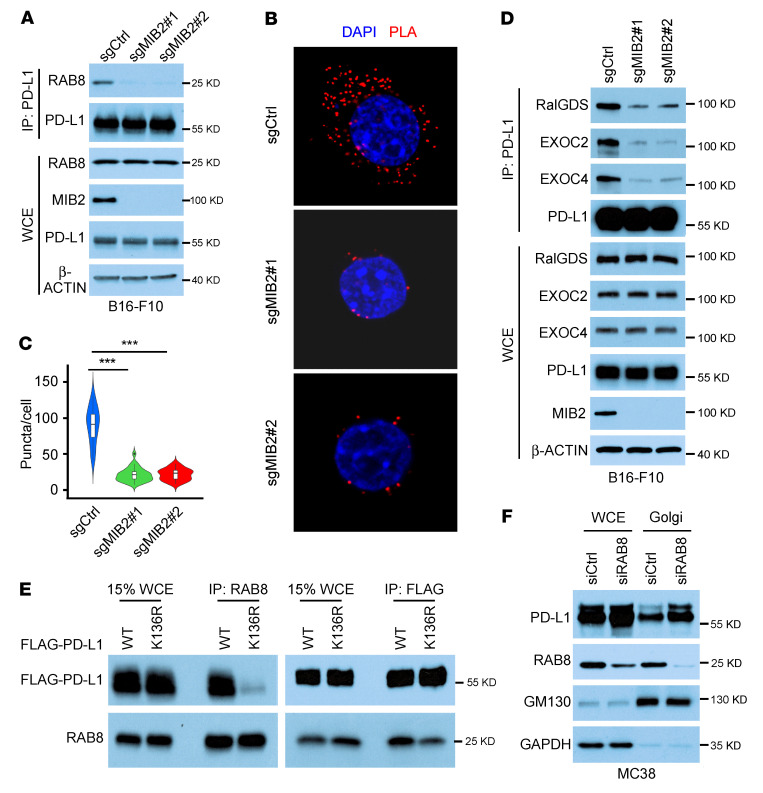
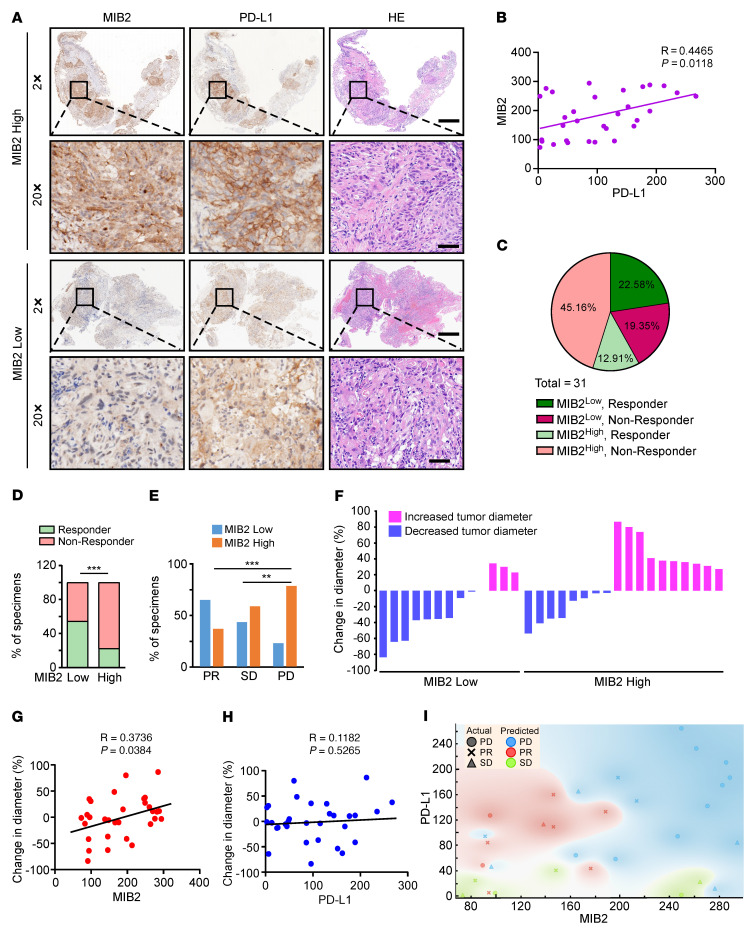
Programmed death-ligand 1 (PD-L1), a critical immune checkpoint ligand, is a transmembrane protein synthesized in the endoplasmic reticulum of tumor cells and transported to the plasma membrane to interact with programmed death 1 (PD-1) expressed on T cell surface. This interaction delivers coinhibitory signals to T cells, thereby suppressing their function and allowing evasion of antitumor immunity. Most companion or complementary diagnostic devices for assessing PD-L1 expression levels in tumor cells used in the clinic or in clinical trials require membranous staining. However, the mechanism driving PD-L1 translocation to the plasma membrane after de novo synthesis is poorly understood. Herein, we showed that mind bomb homolog 2 (MIB2) is required for PD-L1 transportation from the trans-Golgi network (TGN) to the plasma membrane of cancer cells. MIB2 deficiency led to fewer PD-L1 proteins on the tumor cell surface and promoted antitumor immunity in mice. Mechanistically, MIB2 catalyzed nonproteolytic K63-linked ubiquitination of PD-L1, facilitating PD-L1 trafficking through Ras-associated binding 8-mediated (RAB8-mediated) exocytosis from the TGN to the plasma membrane, where it bound PD-1 extrinsically to prevent tumor cell killing by T cells. Our findings demonstrate that nonproteolytic ubiquitination of PD-L1 by MIB2 is required for its transportation to the plasma membrane and tumor cell immune evasion.

Keywords: Cancer; Cancer immunotherapy; Cell Biology; Cellular immune response; Oncology.


Figures

Figure 1
Figure 1. MIB2 regulates membrane PD-L1 levels in tumor cells.
(A) Volcano plot showing the E3 ligases identified from FACS. MIB2 is indicated in red, and STUB1 and BTRC are indicated in blue. (B) Immunoblotting (IB) analysis of PD-L1 levels in MIB2-KO B16-F10 and MC38 cells. (C and D) FACS analysis of membrane PD-L1 levels in (C) B16-F10 and (D) MC38 cells. (E and F) IB analysis of PD-L1 protein levels in whole-cell extract (WCE) and membrane fractions (Mem) from (E) B16-F10 and (F) MC38 cells. (G and H) Immunofluorescence analysis of PD-L1 in B16-F10 and MC38 cells. (G) Representative images of green fluorescence–labeled PD-L1. Scale bar: 10 μm. (H) Quantitative analysis of membrane- and cytoplasmic-expressed PD-L1 (n = 5). Cyto, cytoplasm. ***P < 0.001 by 1-way ANOVA test with Dunnett’s multiple comparisons test (C, D, and H).
Figure 2
Figure 2. Depletion of MIB2 enhances antitumor immunity.
(A and B) Immunofluorescence analysis of PD-1 at the A375 cell surface. (A) Representative images of binding of green fluorescence–labeled exogenous PD-1-Fc. Scale bar: 25 μm. (B) Quantitation (n = 7). (C and D) A375 cell survival upon incubation with allogeneic T cells. A375 cells were cocultured with or without activated T cells at a ratio of 1:5 for 48 hours and subjected to crystal violet staining. (C) Representative images. (D) Quantitation. (E) Growth curve of B16-F10 tumors in C57BL/6 mice (n = 7 per group). (F) Kaplan-Meier survival curves of B16-F10 tumor-bearing C57BL/6 mice (n = 15 per group). (G) Growth curve of B16-F10 tumors in NSG mice (n = 7 per group). (H) Kaplan-Meier survival curves of B16-F10 tumor-bearing NSG mice (n = 15 per group). (I) Growth curve of MC38 tumors in C57BL/6 mice (n = 7 per group). (J) Kaplan-Meier survival curves of MC38 tumor-bearing C57BL/6 mice (n = 15 per group). (K) Growth curve of MC38 tumors in NSG mice (n = 7 per group). (L) Kaplan-Meier survival curves of MC38 tumor-bearing NSG mice (n = 15 per group). *P < 0.05; ***P < 0.001; by log-rank (Mantel-Cox) test (F, H, J, and L) and by 1-way ANOVA test with Dunnett’s multiple comparisons test (B and D). Data are shown as the mean ± SEM.
Figure 3
Figure 3. Depletion of MIB2 improves the efficacy of anti–PD-1 immunotherapy.
(A) Volumes of B16-F10 syngeneic tumors treated with control antibody (IgG2a) or PD-1 mAb. (B) Kaplan-Meier survival curves for each treated group from A (n = 15 per group). (C) Volumes of MC38 syngeneic tumors treated with control antibody (IgG2a) or PD-1 mAb. (D) Kaplan-Meier survival curves for each treated group from C (n = 15 per group). (EG) Immunostaining of CD8 and granzyme B (GZMB) in the B16-F10 tumors treated with control (IgG2a) or PD-1 mAb. Data are shown as the mean ± SD (n = 9); 3 tissue slides per tumor. (E) Representative images. Scale bar: 50 μm. (F) Quantification of CD8+ T cells. (G) Relative GZMB level. Unit = 262,144 μm2 (the area of the tumor tissue). *P < 0.05; **P < 0.01; ***P < 0.001 by log-rank (Mantel-Cox) test (B and D) and by 1-way ANOVA test with Dunnett’s multiple comparisons test (F and G). Data are shown as the mean ± SEM.
Figure 4
Figure 4. MIB2 promotes K63-linked ubiquitination of PD-L1.
(A) Direct binding between PD-L1 and MIB2. FLAG-MIB2 immunoprecipitated from 293T cells bound to purified GST–PD-L1 in vitro. Purified GST–PD-L1 was examined by Coomassie Blue staining. (B) Co-IP analysis of the endogenous PD-L1 and MIB2 in MC38 cells. (C) Proximity ligation assay (PLA) analysis of PD-L1 and MIB2 in A375, B16-F10, and MC38 cells. Scale bar: 10 μm. (D) In vivo PD-L1 ubiquitination by MIB2 in 293T cells transfected with expression constructs. (E) Immunoprecipitation (IP) and immunoblotting (IB) analysis of 293T cells transfected with various ubiquitin mutant constructs. (F) IP and IB analysis of MIB2-KO MC38 cells using Ub-K63–specific antibody. (G) IP and IB analysis of PD-L1 in A375 cells interacting with purified HIS–PD-1.
Figure 5
Figure 5. MIB2 catalyzes PD-L1 ubiquitination on K136 residue.
(A) In vivo PD-L1 ubiquitination by MIB2 in 293T cells transfected with PD-L1 WT or the K136R mutant expression construct. (B) Immunoblotting (IB) analysis of PD-L1 protein levels in whole-cell extract (WCE) and membrane fractions (Mem) from MC38 cells expressing WT PD-L1 or the K136R mutant. (C) Immunoprecipitation (IP) and immunoblotting (IB) analysis of A375 cells with WT PD-L1 or K136R mutant interacting with purified HIS–PD-1. (D and E) Tumor growth curves of (D) NSG and (E) C57BL/6 mice inoculated with B16-F10 cells expressing PD-L1 WT or the K136R mutant (n = 5 per group). (FH) CD8 and granzyme B (GZMB) immunostaining in the B16-F10 PD-L1 WT and PD-L1 K136R mutant tumors from C57BL/6 mice (n = 9); 3 tissue slides per tumor. (F) Representative images. Scale bar: 50 μm. (G) Quantification of CD8+ T cells. (H) Relative GZMB level. Unit = 262,144 μm2 (the area of the tumor tissue). **P < 0.01; ***P < 0.001, by unpaired, 2-tailed t test between 2 groups (G and H). Data are shown as the mean ± SEM.
Figure 6
Figure 6. Ubiquitination by MIB2 is required for PD-L1 exocytosis.
(A) Immunofluorescence analysis of PD-L1 in B16-F10 cells after cold block release. Scale bar: 10 μm. (B) Colocalization of MIB2 and subcellular organelles markers in B16-F10 cells. Scale bar: 10 μm. (C) Immunoblotting (IB) analysis of MIB2 and Galnt2 in trypsin-digested Golgi fractions with or without permeabilization. (D) IB analysis of PD-L1 in the whole-cell extract (WCE) and isolated Golgi from MC38 cells. (E) IB analysis of PD-L1 in the WCE and isolated Golgi from MC38 cells expressing PD-L1 WT or K136R mutant.
Figure 7
Figure 7. Ubiquitination by MIB2 is required for the PD-L1 and RAB8 interaction and exocytosis.
(A) Coimmunoprecipitation (Co-IP) and immunoblotting (IB) analysis of endogenous PD-L1 and RAB8 in B16-F10 cells. (B and C) Proximity ligation assay (PLA) analysis of the PD-L1 and RAB8 interaction in MC38 cells. (B) Representative images. Scale bar: 10 μm. (C) Quantitation. Lines within the boxes denote median values; the tops of boxes represent the upper quartile (75th percentile), and bottoms of boxes represent the lower quartile (25th percentile); and widths denote cell densities. (D) Co-IP and IB analysis of endogenous PD-L1 and exocyst components in B16-F10 cells. (E) Co-IP analysis of the PD-L1 (WT or K136R) and RAB8 interaction in PD-L1–KO B16-F10 cells transfected with the indicated constructs. (F) IB analysis of PD-L1 in the whole-cell extract (WCE) and isolated Golgi from RAB8-silenced MC38 cells. ***P < 0.001, by 1-way ANOVA among 3 groups (B and C). Data are shown as the mean ± SEM.
Figure 8
Figure 8. Membrane PD-L1 levels positively correlate with MIB2 expression in non–small cell lung cancer.
(A) Representative IHC images for MIB2 and PD-L1 from nivolumab-treated patients with non–small cell lung cancer (NSCLC). The top two rows show images from a nonresponder; the bottom two rows show images from a responder. Scale bar: 500 μm (first and third rows); 50 μm (second and fourth rows). (B) Scatterplot showing the correlation between MIB2 and membrane PD-L1 levels in NSCLC specimens. Each plot represent 1 patient (n = 31). (C) Pie chart of MIB2 and membrane PD-L1 levels in 31 NSCLC specimens. (D) The percentage of responders and nonresponders displaying low or high MIB2 protein levels in 31 NSCLC specimens. (E) The percentages of patients with tumors exhibiting low or high MIB2 levels in the groups with partial response (PR), stable disease (SD), or progressive disease (PD). (F) Change in the diameter of tumors from patients with NSCLC treated with PD-1 mAb. Pink represents increased tumor diameter; and blue represents decreased tumor diameter. (G and H) Scatterplot showing the correlation between (G) MIB2 or (H) membrane PD-L1 levels and the response to PD-1 mAb treatment. (I) Naive Bayes model to classify 3 response groups based on the ratio of MIB2 and PD-L1 IHC scores. **P < 0.01; ***P < 0.001 by χ2 test for contingency (D and E).

Similar articles

Cited by

References

    1. Iwai Y, et al. Involvement of PD-L1 on tumor cells in the escape from host immune system and tumor immunotherapy by PD-L1 blockade. Proc Natl Acad Sci U S A. 2002;99(19):12293–12297. doi: 10.1073/pnas.192461099. - DOI - PMC - PubMed
    1. Dong H, et al. Tumor-associated B7-H1 promotes T-cell apoptosis: a potential mechanism of immune evasion. Nat Med. 2002;8(8):793–800. doi: 10.1038/nm730. - DOI - PubMed
    1. Qu QX, et al. Membranous and cytoplasmic expression of PD-L1 in ovarian cancer cells. Cell Physiol Biochem. 2017;43(5):1893–1906. doi: 10.1159/000484109. - DOI - PubMed
    1. Ukpo OC, et al. B7-H1 expression model for immune evasion in human papillomavirus-related oropharyngeal squamous cell carcinoma. Head Neck Pathol. 2013;7(2):113–121. doi: 10.1007/s12105-012-0406-z. - DOI - PMC - PubMed
    1. Gao Y, et al. Acetylation-dependent regulation of PD-L1 nuclear translocation dictates the efficacy of anti-PD-1 immunotherapy. Nat Cell Biol. 2020;22(9):1064–1075. doi: 10.1038/s41556-020-0562-4. - DOI - PMC - PubMed

Publication types