. 2023 Mar 15;133(6):e164809.
doi: 10.1172/JCI164809.

Single-cell characterization of anti-LAG-3 and anti-PD-1 combination treatment in patients with melanoma

Affiliations

Single-cell characterization of anti-LAG-3 and anti-PD-1 combination treatment in patients with melanoma

Jani Huuhtanen et al. J Clin Invest. .

Abstract

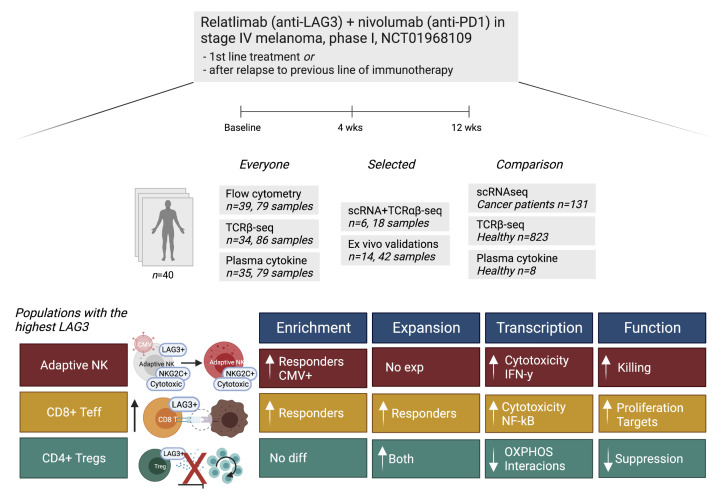
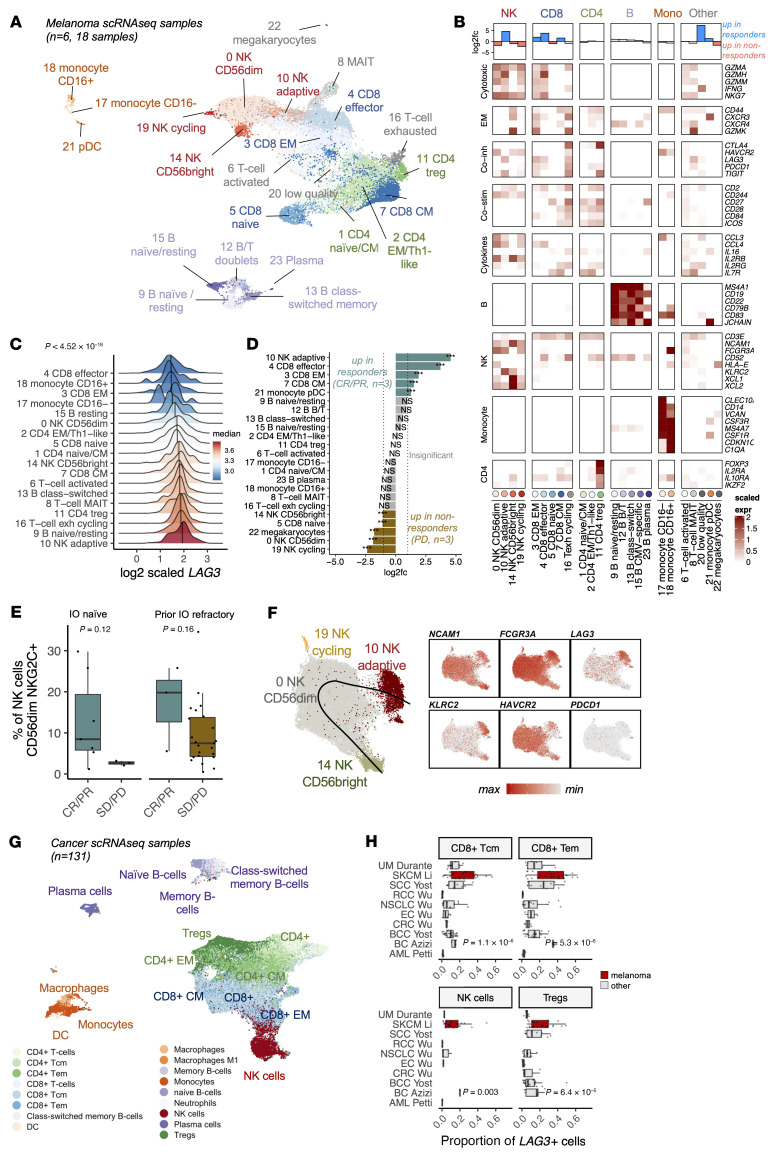
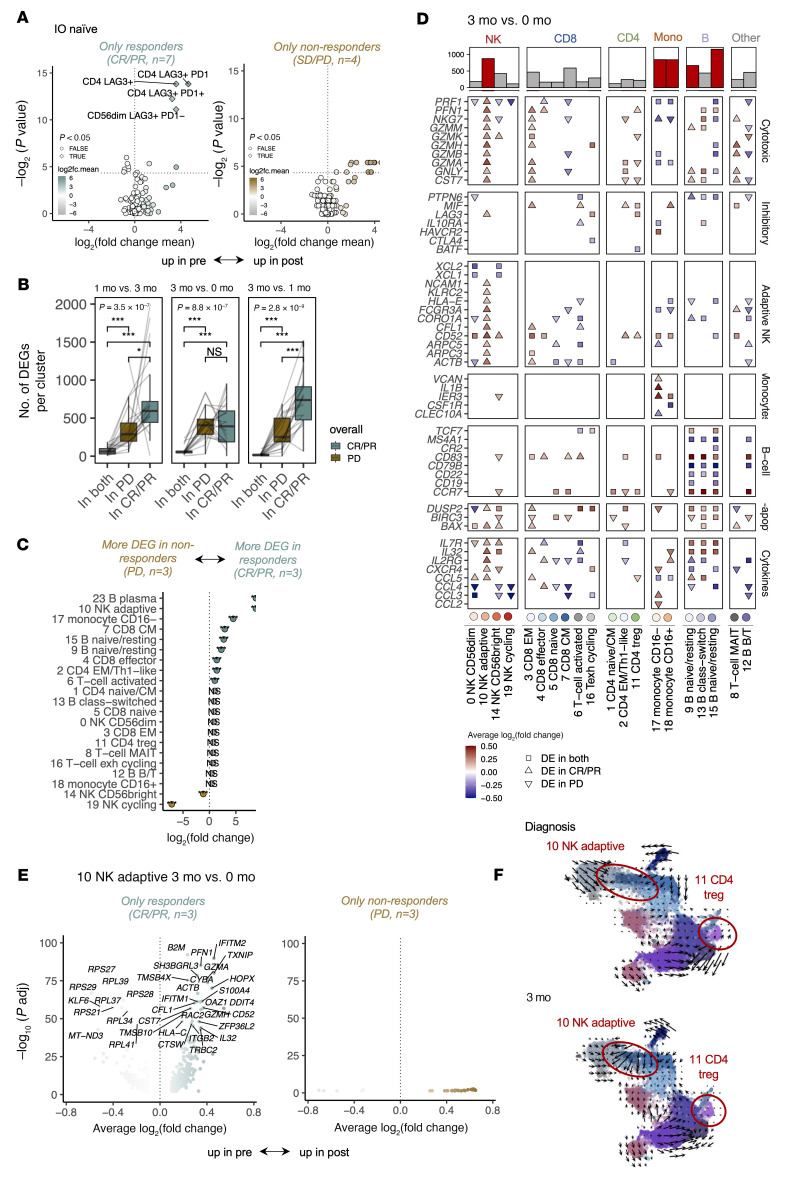
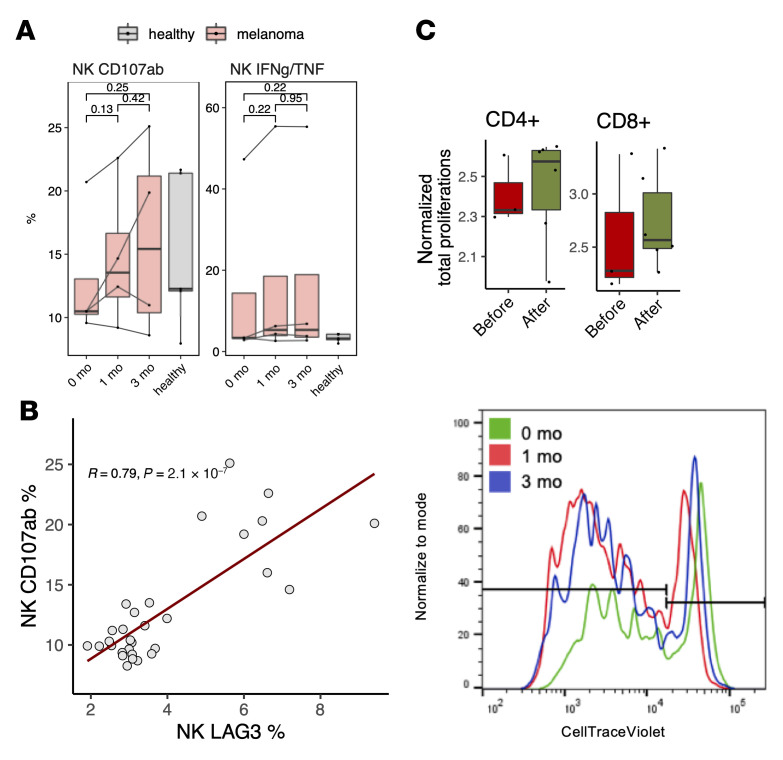
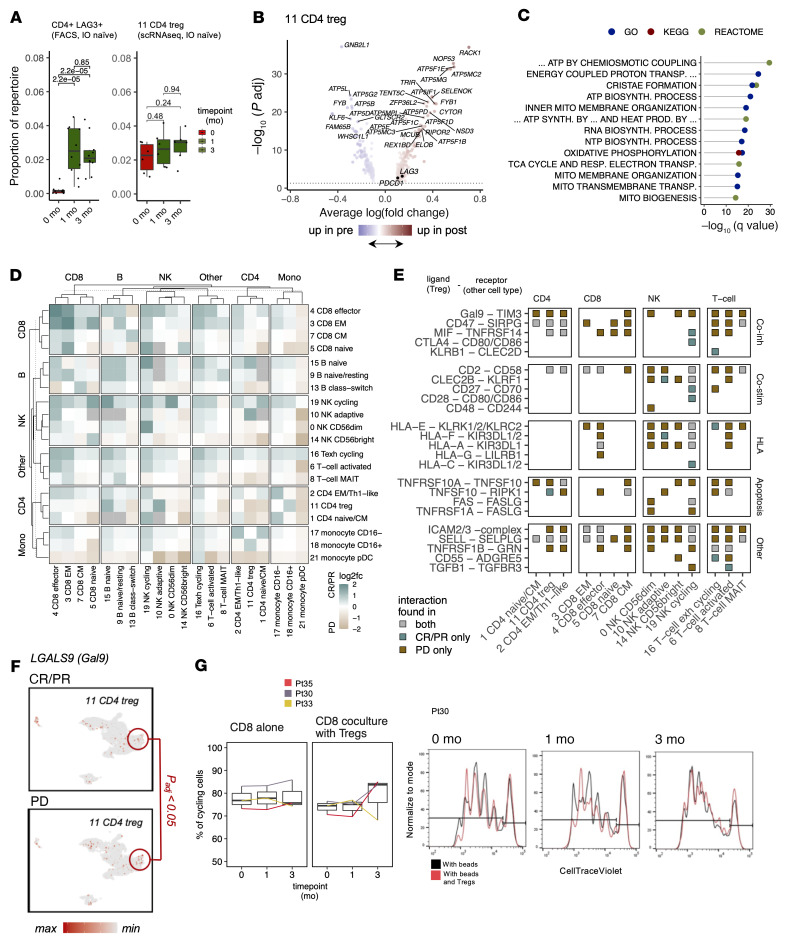
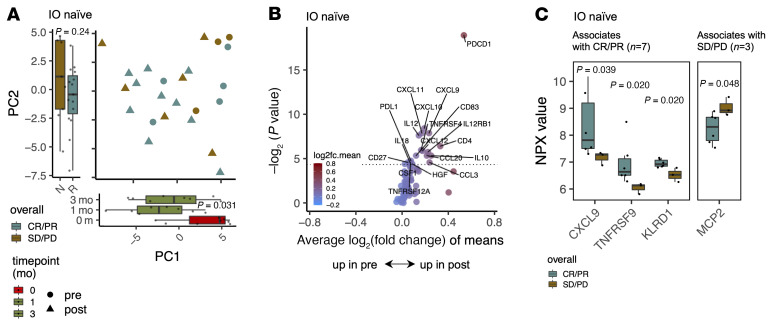
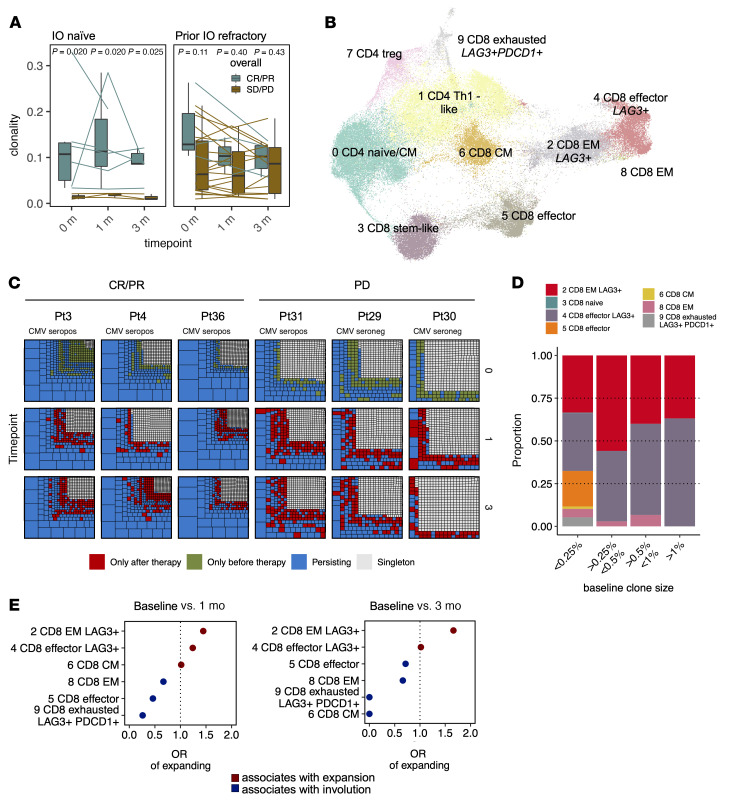
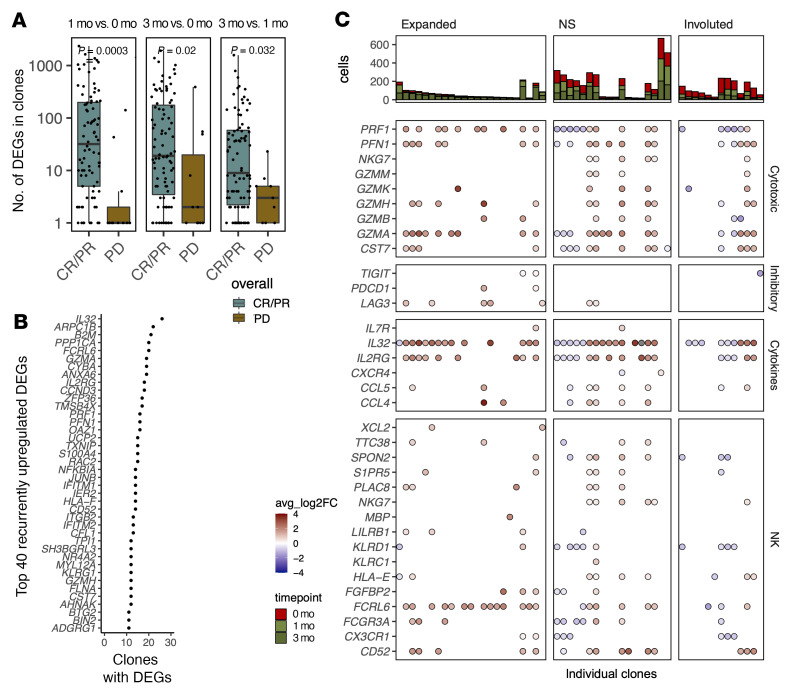
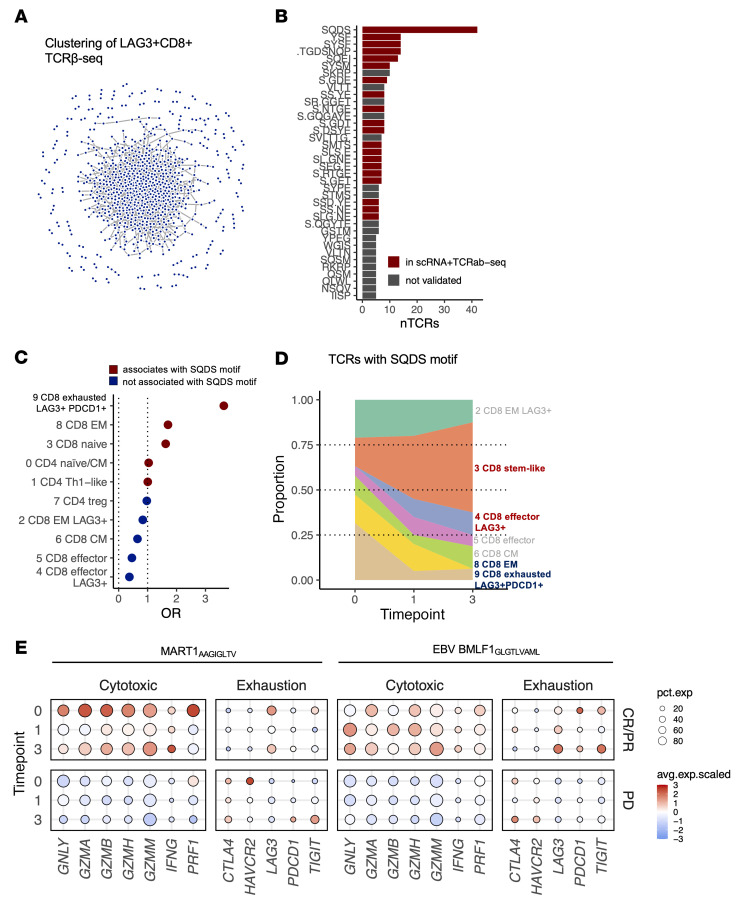
BackgroundRelatlimab plus nivolumab (anti-lymphocyte-activation gene 3 plus anti-programmed death 1 [anti-LAG-3+anti-PD-1]) has been approved by the FDA as a first-line therapy for stage III/IV melanoma, but its detailed effect on the immune system is unknown.MethodsWe evaluated blood samples from 40 immunotherapy-naive or prior immunotherapy-refractory patients with metastatic melanoma treated with anti-LAG-3+anti-PD-1 in a phase I trial using single-cell RNA and T cell receptor sequencing (scRNA+TCRαβ-Seq) combined with other multiomics profiling.ResultsThe highest LAG3 expression was noted in NK cells, Tregs, and CD8+ T cells, and these cell populations underwent the most significant changes during the treatment. Adaptive NK cells were enriched in responders and underwent profound transcriptomic changes during the therapy, resulting in an active phenotype. LAG3+ Tregs expanded, but based on the transcriptome profile, became metabolically silent during the treatment. Last, higher baseline TCR clonality was observed in responding patients, and their expanding CD8+ T cell clones gained a more cytotoxic and NK-like phenotype.ConclusionAnti-LAG-3+anti-PD-1 therapy has profound effects on NK cells and Tregs in addition to CD8+ T cells.Trial registrationClinicalTrials.gov (NCT01968109)FundingCancer Foundation Finland, Sigrid Juselius Foundation, Signe and Ane Gyllenberg Foundation, Relander Foundation, State funding for university-level health research in Finland, a Helsinki Institute of Life Sciences Fellow grant, Academy of Finland (grant numbers 314442, 311081, 335432, and 335436), and an investigator-initiated research grant from BMS.

Keywords: Immunology; NK cells; Oncology; Skin cancer; T cells.


Figures

Figure 1
Figure 1. Single-cell profiling of anti-LAG3+anti–PD-1 treatment in patients with melanoma.
Schematic of the study cohorts and main findings. diff, difference; exp, expansion. This figure was created with BioRender.com.
Figure 2
Figure 2. LAG3 is expressed at high levels in Tregs and CMV-associated adaptive NK cells.
(A) UMAP representation of CD45+-sorted cells in 18 scRNA+TCRαβ-Seq samples from 6 patients with melanoma before and after 4 weeks and 12 weeks of anti–LAG-3+anti–PD-1 treatment, profiled with scRNA+TCRαβ-Seq. (B) Scaled expression (expr) of selected differentially expressed markers (Padj < 0.05, Bonferroni-corrected t test) used to annotate clusters. The top row shows the log2 fold change (log2fc) of population abundances between patients with (CR/PR, n = 3) and without (PD, n = 3) a response at baseline. CM, central memory; Co-stim, costimulation; Co-inh, coinhibition; EM, effector memory; Mono, monocyte. (C) LAG3 expression at baseline as scaled, log2(× + 1) transformed values. The adjusted P value (Bonferroni-corrected t test) indicates the difference between adaptive NK cells and the other cell types. exh, exhausted. (D) scRNA-Seq population abundances between patients with (CR/PR, n = 3) and without (PD, n = 3) a response at baseline. P values were calculated with a Fisher’s 2-sided exact test, and significant values needed to have at least a |log2 fold change| >1. ***P < 0.001. (E) Proportion of CD56dimNKG2C+ adaptive NK cells among NK cells in IO-naive (CR/PR n = 7; SD/PD n = 4) and IO-refractory (CR/PR n = 3; SD/PD n = 26) groups at baseline. P values were calculated with the 2-sided Mann-Whitney U test. (F) Focused UMAP of NK cells, where the superimposed line corresponds to the predicted pseudotime maturation trajectory and scaled expression of markers used to identify the subpopulations. max, maximum; min, minimum. (G) UMAP representation of cells from 131 scRNA-Seq tumor biopsies or bone marrow aspirate samples from 10 different cancers profiled with 10× technology. Annotation was done with SingleR. (H) Proportion of LAG3+ cells across different cancers. P values were calculated with the Kruskal-Wallis test.
Figure 3
Figure 3. Anti–LAG-3+anti–PD-1 treatment upregulates LAG3 and invigorates adaptive NK cells.
(A) Differentially abundant (Padj < 0.05, Benjamini-Hochberg–corrected Mann-Whitney U test) flow cytometry subpopulations between 3 months of anti–LAG-3+anti–PD-1 treatment and baseline in IO-naive patients (n = 13) with a response (CR/PR n = 7) and with a nonresponse (SD/PD n = 4). The dashed line denotes P = 0.05. (B) The number of DEGs (Padj < 0.05, Bonferroni-corrected t test) between different time points in the different scRNA-Seq populations (Figure 2A) of cells from patients with (CR/PR, n = 3) or without (PD, n = 3) a response. P values were calculated with the Kruskal-Wallis test. (C) The log2 fold change of DEGs in scRNA-Seq data of patients with (CR/PR, n = 3) or without (PD, n = 3) a response after 1 month of anti–LAG-3+anti–PD-1 treatment. P values were calculated with Fisher’s 2-sided exact test, and significant values needed to have at least a |log2 fold change| >1. **P < 0.01 and ***P < 0.001. (D) DEGs in the scRNA-Seq data as log2 average fold changes (avg_logFC) between 3 months of anti–LAG-3+anti–PD-1 treatment and baseline. The shape denotes whether the gene was a DEG in patients with a response (DE in CR/PR), without a response (DE in PD), or in both (DE in both). Colors indicate upregulation at 3 months (red) or baseline (blue), and the shape indicates whether the DEG was found in patients with CR/PR, PD, or both. The bar plot on top shows the number of DEGs between 3 months of anti–LAG-3+anti–PD-1 treatment and baseline in different immune cell subpopulations, with the top 5 cell populations colored red. (E) DEGs (Padj < 0.05, Bonferroni-corrected t test) in adaptive NK cells (cluster 10) between 3 months (right) and baseline (left) in the scRNA-Seq data of patients with (CR/PR, n = 3) or without (PD, n = 3) a response. (F) UMAP representation of the scRNA-Seq samples from CMV-seropositive patients (n = 4), where superimposed arrows represent the directional flow calculated with Velocyto by comparing the abundances of spliced and unspliced mRNA reads. Arrows are smoothed with Gaussians.
Figure 4
Figure 4. Anti–LAG-3+anti–PD-1 enhances NK cell degranulation, cytokine secretion, and T cell proliferation.
(A) Degranulation (CD107a/b) and IFN-γ/TNF-α production of primary NK cells after stimulation with the chronic myelogenous leukemia (CML) cell line K562 in patients before (up in pre) and after (up in post) anti–LAG-3+anti–PD-1 treatment and in healthy donors at different time points (n = 4, 12 samples). When samples were available, they were examined as 3 replicates, but here, values are shown as averages. P values were calculated with the Kruskal-Wallis test. (B) Relationship between extracellular LAG-3 and degranulation responses (CD107a/b) to K562 target cells in melanoma samples before and after anti–LAG-3+anti–PD-1 treatment (n = 10, 30 samples). P values and correlation coefficients were calculated with Spearman’s rank correlation. (C) Top: Proliferation of CD4+ and CD8+ T cells induced by anti-CD3 and -CD28 beads (n = 3, 9 samples). Bottom: Cell divisions in CD4+ and CD8+ T cells after anti-CD3 and -CD28 bead stimulation in a selected patient. Cell proliferation was traced with flow cytometry by dilution of CellTrace Violet dye. Cells from different time points (before and after therapy) are marked with different colors.
Figure 5
Figure 5. Anti–LAG-3+anti–PD-1 treatment expands peripheral Tregs but reduces their suppressive function.
(A) Box plot showing the expansion of putative Tregs (CD4+LAG-3+) in flow cytometric data (left) for IO-naive patients (n = 11) and Tregs (cluster 11) in scRNA-Seq data (n = 6, right). P values were calculated with a 2-sided Mann-Whitney U test. (B) DEGs (Padj < 0.05, Bonferroni-corrected t test) in Tregs (cluster 11) between 1 month (right) and baseline (left) in the scRNA-Seq data. (C) The 15 most significantly downregulated pathways (Padj < 0.05, Benjamini-Hochberg corrected Fisher’s 2-sided exact test) in Tregs between 1 month and baseline in the scRNA-Seq data in different pathway databases (HALLMARK, GO, Reactome, and KEGG). Pathway names have been abbreviated for visualization purposes; full names are shown in Supplemental Table 2. (D) scRMA-Seq data–generated heatmap of the interactome in patients with (CR/PR, n = 3) or without (PD, n = 3) a response at baseline. The interactome is presented as a number of statistically significant ligand-receptor pairs (Padj < 0.05) calculated with CellPhoneDB. Green color indicates a higher number of interactions in patients with a response; beige color indicates a higher number of interactions in patients without a response. (E) Statistically significant inhibitory ligand-receptor interactions (Padj < 0.05, Benjamini-Hochberg–corrected CellPhoneDB permutation test) of Tregs with different immune cell subpopulations. The color denotes whether the interaction was exclusive in patients with (CR/PR) or without (PD) a response. (F) Expression of LGALS9 (Gal9) in the scRNA-Seq of patients with (CR/PR, n = 3) or without (PD, n = 3) a response (Tregs are highlighted in red). (G) Suppression of CD8+ T cell proliferation by Tregs. Samples from 3 patients prior to and 1 month and 3 months after combination treatment were analyzed. The amount of cell proliferation was traced with flow cytometry by dilution of CellTrace Violet dye with the presence of CD3/CD28 beads and of CD3/CD28 beads and Tregs.
Figure 6
Figure 6. Cytokine profiling reveals increased chemotaxis and chemoattraction following anti–LAG-3+anti–PD-1 therapy.
(A) PCA plot showing the serum protein profiles of individual samples from IO-naive samples (n = 11, R = CR/PR n = 7, N = SD/PD n = 4) at different time points, where the largest variation (PC1, 12.11%) is associated with before and after treatment, and the second-largest variation (PC2, 8.90%) is associated with an overall response. P values were calculated with the Kruskal-Wallis test. (B) Differentially expressed serum proteins (P < 0.05, 2-sided Mann-Whitney U test) between pre- and post-therapy samples in IO-naive patients (n = 11). No protein was upregulated at baseline. The dashed line denotes P = 0.05. (C) NPX values for all the soluble molecules associated with a response (CR/PR, n = 7) and without a response (SD/PD, n = 4) in the IO-naive patients. P values were calculated with the 2-sided Mann-Whitney U test.
Figure 7
Figure 7. Higher baseline clonality is associated with a response to anti–LAG-3+anti–PD-1 therapy.
(A) TCR repertoire clonality before and after anti–LAG-3+anti–PD-1 therapy in IO-naive patients (IO-naive n = 9, CR/PR n = 6, SD/PD n = 3, 26 samples) and IO-refractory patients (IO-refractory, n = 25, CR/PR n = 4, SD/PD n = 21, 44 samples). P values were calculated with a 2-sided Mann-Whitney U test. (B) UMAP representation of cells with detected TCRs from 18 scRNA+TCRαβ-Seq samples from patients with melanoma before treatment and 4 weeks and 12 weeks after treatment with anti–LAG-3+anti–PD-1 (n = 6, 18 samples), where the clusters are the same as in Figure 2A but renumbered based on size. (C) Treemap showing the clonal structure of the 500 most abundant clones from scRNA+TCRαβ-Seq–profiled patients, where each facet is a patient’s TCR repertoire at a different time point, and a box denotes a clonotype and the size of the box corresponds to the clonotype’s size. The boxes are colored on the basis of whether the clone is a singleton (gray, i.e., only 1 TCR read found) or persisting (blue; found before and following the therapy), novel (red; found only after the therapy), or contracting (green; found only before the therapy). The CMV serostatus of the patients is highlighted. seropos, seropositive; seroneg, seronegative. (D) The proportion of phenotypes of different clone size bins in pre-therapy samples. Different clones were assigned to different bins based on their size in the repertoire. (E) ORs for the expansion potential of clonotypes between 1 month after therapy and before therapy (baseline) and 3 months after therapy and before therapy (baseline), where higher ORs indicate a higher probability of expansion after therapy.
Figure 8
Figure 8. Clones from responding patients undergo more transcriptional alterations.
(A) Number of DEGs (Padj < 0.05, Bonferroni-corrected t test) between different time points in the T cell clones (with at least 3 cells in each time point) from patients with (CR/PR, n = 3) and without (PD, n = 3) a response. P values were calculated with the 2-sided Mann-Whitney U test. (B) The top 40 most recurrently upregulated DEGs (Padj < 0.05, Bonferroni-corrected t test) in the clones from responders (CR/PR, n = 3). (C) Selected list of DEGs (Padj < 0.05, Bonferroni-corrected t test) in the scRNA-Seq data with log2 average fold changes between 3 months of anti–LAG-3+anti–PD-1 treatment and baseline in individual clonotypes. The facets are divided by whether the clone expanded over 2-fold, involuted over 2-fold, or persisted (NS) between the 2 time points. The bar plots on top show the number of cells in the clones at different time points.
Figure 9
Figure 9. Anti–LAG-3+anti–PD-1 treatment invigorates LAG-3+CD8+ T cells targeting melanoma-associated antigens.
(A) Network plot showing connections of similar TCRs in the LAG-3+CD8+–sorted TCRβ-Seq samples (n = 6), where a line between dots denotes amino acid–level similarities according to GLIPH2. (B) The number of clustered cells per TCR motif identified by GLIPH2 in the LAG-3+CD8+-sorted TCRβ-Seq samples, where the coloring indicates whether the motif was also identified in the analysis of TCRαβ-Seq data (n = 6, 18 samples). (C) ORs for TCRs with shared SQDS motifs showing a bias toward 9 CD8+ exhausted LAG3+PDCD1+ phenotypes. (D) A change in the phenotype of cells with the shared SQDS motif in their TCRs showed a decrease in the number of exhausted cells and an increase in cytotoxic cells in a responding patient. (E) Scaled average expression (avg.exp) and proportion of antigen-specific T cells (pct.exp) expressing canonical T cell markers in patients with CR/PR (n = 3) and PD (n = 3). Anti-MAA T cells were defined with TCRGP prediction against the MART1AAGIGLTV target and against the antiviral EBV BMLF1GLCTLVAML target.

References

    1. Davidson S, et al. Single-cell RNA sequencing reveals a dynamic stromal niche that supports tumor growth. Cell Rep. 2020;31(7):107628. doi: 10.1016/j.celrep.2020.107628. - DOI - PMC - PubMed
    1. Gagliani N, et al. Coexpression of CD49b and LAG-3 identifies human and mouse T regulatory type 1 cells. Nat Med. 2013;19(6):739–746. doi: 10.1038/nm.3179. - DOI - PubMed
    1. Petti AA, et al. A general approach for detecting expressed mutations in AML cells using single cell RNA-sequencing. Nat Commun. 2019;10(1):3660. doi: 10.1038/s41467-019-11591-1. - DOI - PMC - PubMed
    1. Triebel F, et al. LAG-3, a novel lymphocyte activation gene closely related to CD4. J Exp Med. 1990;171(5):1393–1405. doi: 10.1084/jem.171.5.1393. - DOI - PMC - PubMed
    1. Wherry EJ, et al. Molecular signature of CD8+ T cell exhaustion during chronic viral infection. Immunity. 2007;27(4):670–684. doi: 10.1016/j.immuni.2007.09.006. - DOI - PubMed

Publication types

MeSH terms

Associated data