. 2023 Jan 31;19(1):e1010863.
doi: 10.1371/journal.pcbi.1010863. eCollection 2023 Jan.

maxATAC: Genome-scale transcription-factor binding prediction from ATAC-seq with deep neural networks

Affiliations

maxATAC: Genome-scale transcription-factor binding prediction from ATAC-seq with deep neural networks

Tareian A Cazares et al. PLoS Comput Biol. .

Abstract

Transcription factors read the genome, fundamentally connecting DNA sequence to gene expression across diverse cell types. Determining how, where, and when TFs bind chromatin will advance our understanding of gene regulatory networks and cellular behavior. The 2017 ENCODE-DREAM in vivo Transcription-Factor Binding Site (TFBS) Prediction Challenge highlighted the value of chromatin accessibility data to TFBS prediction, establishing state-of-the-art methods for TFBS prediction from DNase-seq. However, the more recent Assay-for-Transposase-Accessible-Chromatin (ATAC)-seq has surpassed DNase-seq as the most widely-used chromatin accessibility profiling method. Furthermore, ATAC-seq is the only such technique available at single-cell resolution from standard commercial platforms. While ATAC-seq datasets grow exponentially, suboptimal motif scanning is unfortunately the most common method for TFBS prediction from ATAC-seq. To enable community access to state-of-the-art TFBS prediction from ATAC-seq, we (1) curated an extensive benchmark dataset (127 TFs) for ATAC-seq model training and (2) built "maxATAC", a suite of user-friendly, deep neural network models for genome-wide TFBS prediction from ATAC-seq in any cell type. With models available for 127 human TFs, maxATAC is the largest collection of high-performance TFBS prediction models for ATAC-seq. maxATAC performance extends to primary cells and single-cell ATAC-seq, enabling improved TFBS prediction in vivo. We demonstrate maxATAC's capabilities by identifying TFBS associated with allele-dependent chromatin accessibility at atopic dermatitis genetic risk loci.


Conflict of interest statement

I have read the journal’s policy and the authors of this manuscript have the following competing interests: AB is a co-founder of Datirium, LLC.

Figures
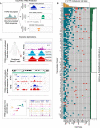
Fig 1
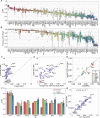
Fig 1. Overview of maxATAC.
(A) maxATAC deep neural network models use DNA sequence and ATAC-seq signal to predict TFBS in new cell types. (B) The maxATAC training data per TF and cell type with OMNI-ATAC-seq (top: 74 "benchmarkable" TF models with ≥ 3 cell types available, bottom: 53 TF models with only 2 cell types for training). Teal boxes indicate ChIP-seq from ENCODE, while red boxes indicate data from GEO. Red stars denote cell types for which we generated OMNI-ATAC-seq. (C) Example applications of maxATAC TFBS prediction to primary cells, scATAC-seq and clinical studies combining DNA sequencing with ATAC-seq. Human image was created with BioRender.com.
Fig 2
Fig 2. maxATAC model architecture, inputs, and standard workflow.
(A) maxATAC inputs are a 1,024bp one-hot encoded DNA-sequence with ATAC-seq signal for the corresponding region, while maxATAC output is an array of 32 TFBS predictions at 32bp resolution, spanning the 1024bp input sequence interval. Inputs go through a total of 5 convolutional blocks. Each convolutional block consists of two layers, each composed of ReLU-activated, 1D convolutional operations and batch normalization. A max pooling layer is interspersed between the convolutional blocks to reduce the spatial dimensions of the input. The kernel width is fixed at 7 across all convolutional blocks. The model uses 15 filters in the first convolutional block, and the number of filters is increased by a factor of 1.5 for every subsequent block. The dilation rate of the convolutional filters increases from one, one, two, four, eight, to sixteen across blocks. Increasing the dilation rate increases the receptive field, so that spatially distant regions share information. In this network, the receptive field grows to +/-512bp, with information sharing proportional to spatial proximity. The final output is produced by a single sigmoid-activated convolutional layer. (B) Schematic overview of a standard maxATAC workflow. maxATAC takes as input a BAM file or scATAC-seq fragments TSV file that is processed to Tn5 cut sites, smoothed and converted to a read-depth-normalized ATAC-seq signal track (robustly min-max normalized between 0–1, see Methods). (C) The maxATAC predict function takes as input the genome reference DNA 2bit sequence file, a trained maxATAC model h5 file and the normalized ATAC-seq signal track to predict TFBS. (D) The outputs of maxATAC are a bigwig file of maxATAC TFBS scores, ranging 0–1, and a BED file of predicted TFBS, thresholded according to a user-selected confidence cutoff (e.g., precision, F1-score, see Methods).
Fig 3
Fig 3. The maxATAC models offer state-of-the-art TFBS prediction from ATAC-seq.
For every TF model, one cell type and two chromosomes (chr1, chr8) were held out during training to assess predictive (test) performance in a new cell type. Test (A) AUPR (median = 0.43) and (B) precision at 5% recall (median = 0.85). Boxplots display median (horizontal line), interquartile range (box), 3-quartile range (whiskers) and points outside the 3-quartile range (diamonds). maxATAC model performance is compared to (C) TF motif-scanning in ATAC-seq peaks and (D) TFBS prediction using the averaged ChIP-seq signal from the training cell types; each dot represents AUPRMEDIAN across train-test cell type splits. Red dots indicate TFs with no known motifs in CIS-BP. (E) Test AUPR of maxATAC models compared to Leopard (DNase-seq-based) model using ATAC-seq input and maxATAC ChIP-seq gold standards for 8 cell lines and 7 TFs. maxATAC outperforms Leopard for 20 out of 29 test performance comparisons. (F) Test AUPR of the maxATAC models on ATAC-seq compared to test AUPR reported by state-of-the-art deep learning models (Factornet, Leopard and DeepGRN) on DNase-seq. (G) Validation performance (AUPRMEDIAN) on chr2 (training cell types) as a function of test performance (AUPRMEDIAN) on chr1 (held-out test cell type) (n = 74; ⍴Pearson = 0.97, P < 10−15).
Fig 4
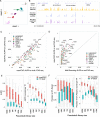
Fig 4. maxATAC offers state-of-the-art TFBS prediction from scATAC-seq.
(A) UMAP of 10x scATAC-seq data from 7 cell types in a cell line-mixing experiment [37] that enabled test performance evaluation for 193 maxATAC models. (B) IGV tracks comparing BHLE40 TFBS predicted by maxATAC in GM12878 from scATAC-seq (blue) or bulk ATAC-seq (purple), relative to BHLE40 ChIP-seq (–log10(p-value) signal tracks in yellow) located at chr1:23,502,599–23,661,052 (158kb region). (C) Test AUPR for maxATAC in scATAC-seq relative to maxATAC performance on bulk ATAC-seq. (D) Test AUPR of maxATAC on scATAC-seq versus AUPR of TF motif scanning on scATAC-seq. Test (E) AUPR and (F) precision at 5% recall performances for maxATAC (red) and TF motif scanning (teal) as a function of down-sampled pseudobulk library sizes from scATAC-seq of GM12878 (n = 55 TFs with maxATAC models and TF motifs available). Given the range of performances per TF model, performances are also z-score normalized per TF, to better visualize model- and library-size-dependent trends.
Fig 5
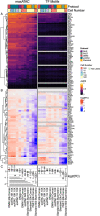
Fig 5. Protocol and cell input numbers influence the performance of TFBS predictions.
(A) Test AUPR in cell line GM12878 for 60 TFs across chromatin-accessibility experimental designs (OMNI-, sc- and standard ATAC-seq or DNase-seq protocols, with variable input number of cells indicated). Grey squares indicate no predictions, due to lack of TF motif. TFs are hierarchically clustered based on maxATAC performance. (B) To visualize protocol-dependent trends for each method, AUPRs were normalized per TF (row-wise) as the log2(AUPR:AUPRMEAN), independently for maxATAC and TF motif-scanning AUPRs. (C) Distribution of the log2(AUPR:AUPRMEAN) per ATAC-seq sample. Given the maxATAC models were trained on OMNI-ATAC-seq ~50k cells, we compared each experiment to the reference "OMNI 50k Corces" sample (red boxplot). Black lines indicate protocol-dependent performance differences relative to the reference (Student’s two-sided t-test, Bonferonni-corrected P < 0.05).
Fig 6
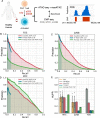
Fig 6. maxATAC models perform well in primary human cells.
(A) Study design for maxATAC benchmarking in primary human CD4+ T cells. Precision-recall curves for TFBS predictions from maxATAC (red line), motif-scanning (blue) and averaged training ChIP-seq signal (green) for (B) FOS, (C) JUNB and (D) MYC, relative to experimentally measured TFBS (ChIP-seq). (E) Comparison of test performance in primary cells (red) to the estimates of test (green) and validation (yellow) performance (available with each trained maxATAC model) as well as TFBS prediction by TF motif scanning (blue) or average training ChIP-seq (green). Each point corresponds to a unique train-test cell type split. Error bars indicate standard deviation. Test performance minimally requires 3 cell types and therefore was available for MYC (n = 6 cell types) and JUNB (n = 5 cell types) but not FOS (n = 2 cell types). Human and cells image was created with BioRender.com.
Fig 7
Fig 7. maxATAC TFBS prediction at atopic dermatitis risk loci in patient-derived CD4+ T cells.
(A) In a previous study [54], peripheral CD4+ T cells were isolated from atopic dermatitis (AD) patients and age-matched controls (CTL) and TCR-stimulated prior to ATAC-seq, RNA-seq and whole genome sequencing (WGS) data generation. (B) We identified a pair of donors in which the AD patient (AD2) was homozygous for the risk allele and the age-matched control (CTL2) was homozygous for the non-risk allele at two independent loci: rs1758201 and rs6062490. (C) 105 of the 127 maxATAC TFs were nominally expressed for the donor pair, and these TFs were selected for TFBS prediction with maxATAC. We identified differential TFBS in the haplotype blocks containing (D) rs6062490 and (E) rs1758201. Purple triangles represent SNPs in linkage disequilibrium (R2>.8) with the AD risk alleles. In the heatmap below, red or blue intervals (32bp) indicate respective gain or loss of TFBS in the AD patient relative to control and black denotes intervals of shared TFBS. TFBS were determined using the cutoff that maximizes the predicted F1-score per TF model. (F) The 20 TFs with the greatest number of differential binding regions between AD2 and CTL2 are shown. (G) IGV screenshots showing regions (highlighted in yellow) of predicted differential TFBS in CTL2 (blue tracks) compared to AD2 (red tracks). The haplotype block is indicated in green. The top 4 signal tracks represent donor-specific ATAC-seq signal and genetic variants. The bottom 6 signal tracks represent predicted TFBS. Human and cells image was created with BioRender.com.

Similar articles

Cited by

References

    1. Hindorff LA, Sethupathy P, Junkins HA, Ramos EM, Mehta JP, Collins FS, et al.. Potential etiologic and functional implications of genome-wide association loci for human diseases and traits. Proceedings of the National Academy of Sciences. 2009;106: 9362–9367. doi: 10.1073/pnas.0903103106 - DOI - PMC - PubMed
    1. Maurano MT, Humbert R, Rynes E, Thurman RE, Haugen E, Wang H, et al.. Systematic localization of common disease-associated variation in regulatory DNA. Science (1979). 2012; 1222794. doi: 10.1126/science.1222794 - DOI - PMC - PubMed
    1. Farh KK-H, Marson A, Zhu J, Kleinewietfeld M, Housley WJ, Beik S, et al.. Genetic and epigenetic fine mapping of causal autoimmune disease variants. Nature. 2015;518: 337–343. doi: 10.1038/nature13835 - DOI - PMC - PubMed
    1. Harley JB, Chen X, Pujato M, Miller D, Maddox A, Forney C, et al.. Transcription factors operate across disease loci, with EBNA2 implicated in autoimmunity. Nat Genet. 2018;50. doi: 10.1038/s41588-018-0102-3 - DOI - PMC - PubMed
    1. Davidson EH. Emerging properties of animal gene regulatory networks. Nature. 2010;468: 911–20. doi: 10.1038/nature09645 - DOI - PMC - PubMed

Publication types

MeSH terms