. 2023 Apr 4;83(7):1111-1127.
doi: 10.1158/0008-5472.CAN-22-2553.

CD73-Dependent Adenosine Signaling through Adora2b Drives Immunosuppression in Ductal Pancreatic Cancer

Affiliations

CD73-Dependent Adenosine Signaling through Adora2b Drives Immunosuppression in Ductal Pancreatic Cancer

Erika Y Faraoni et al. Cancer Res. .

Abstract

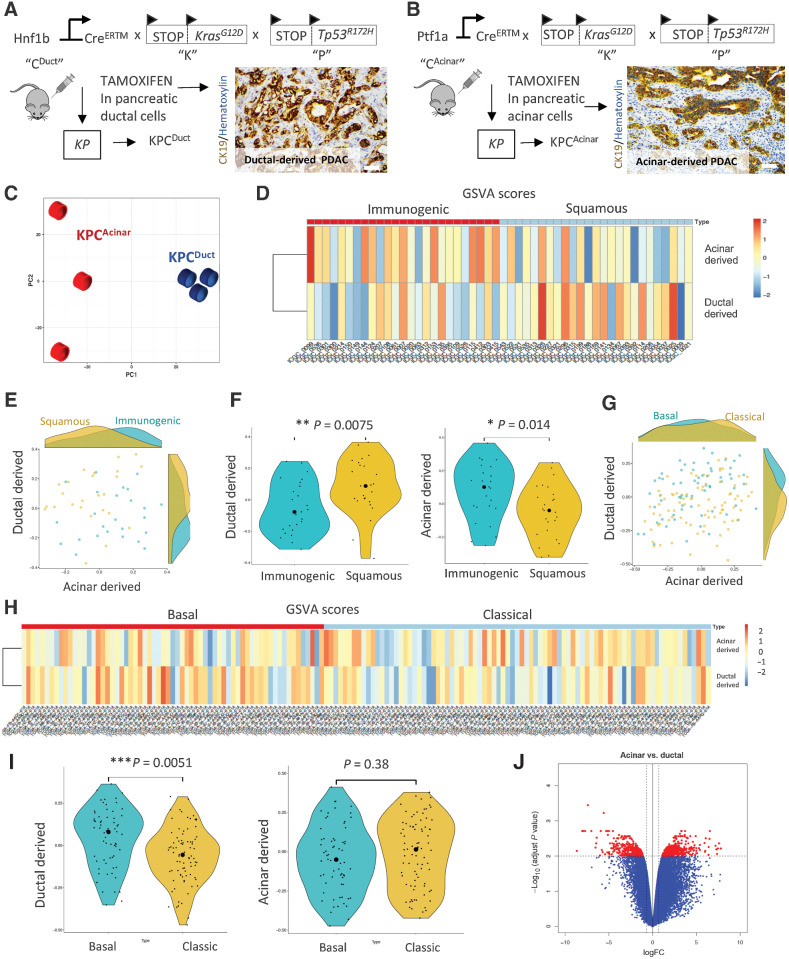
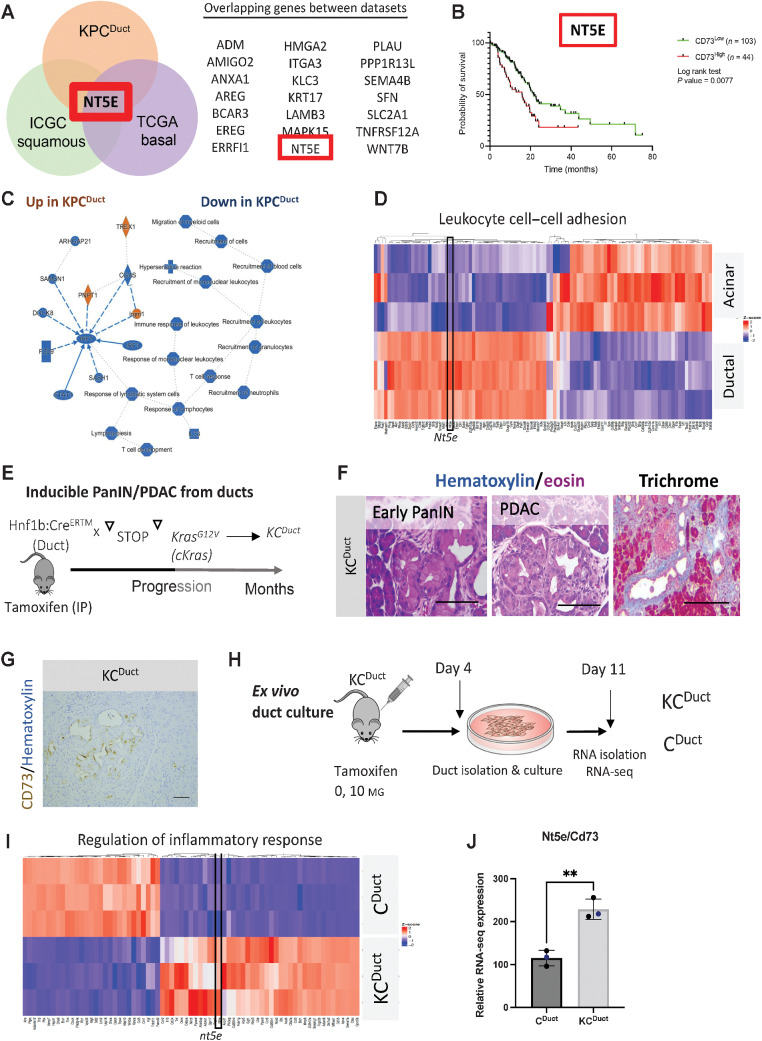
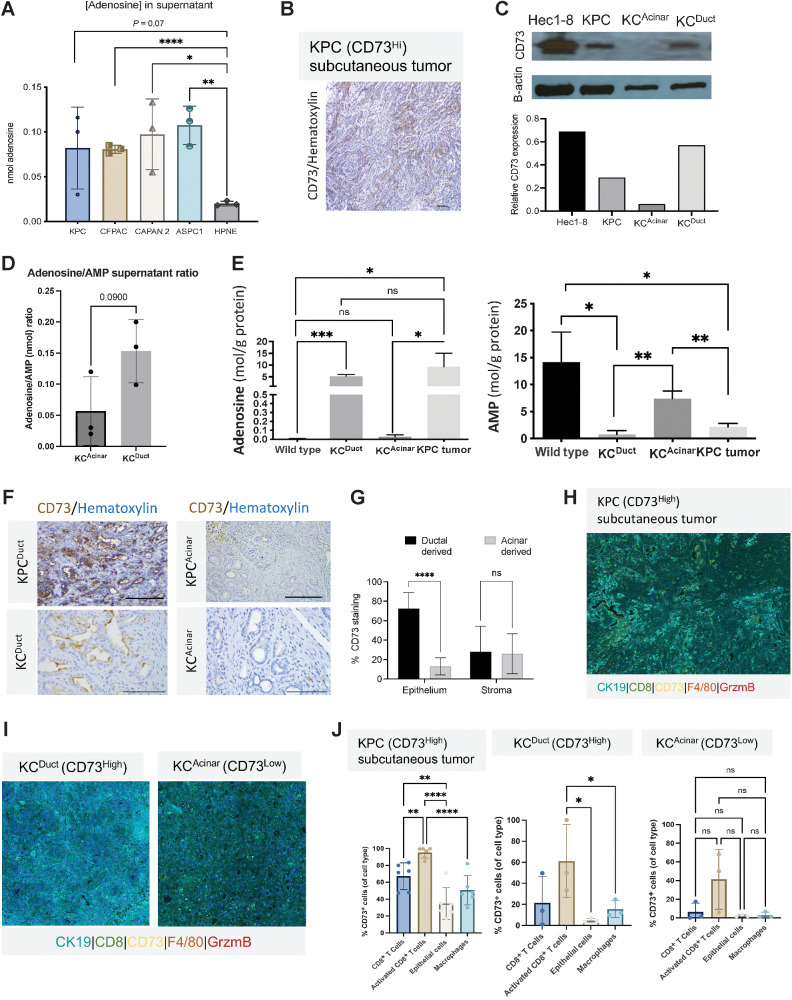
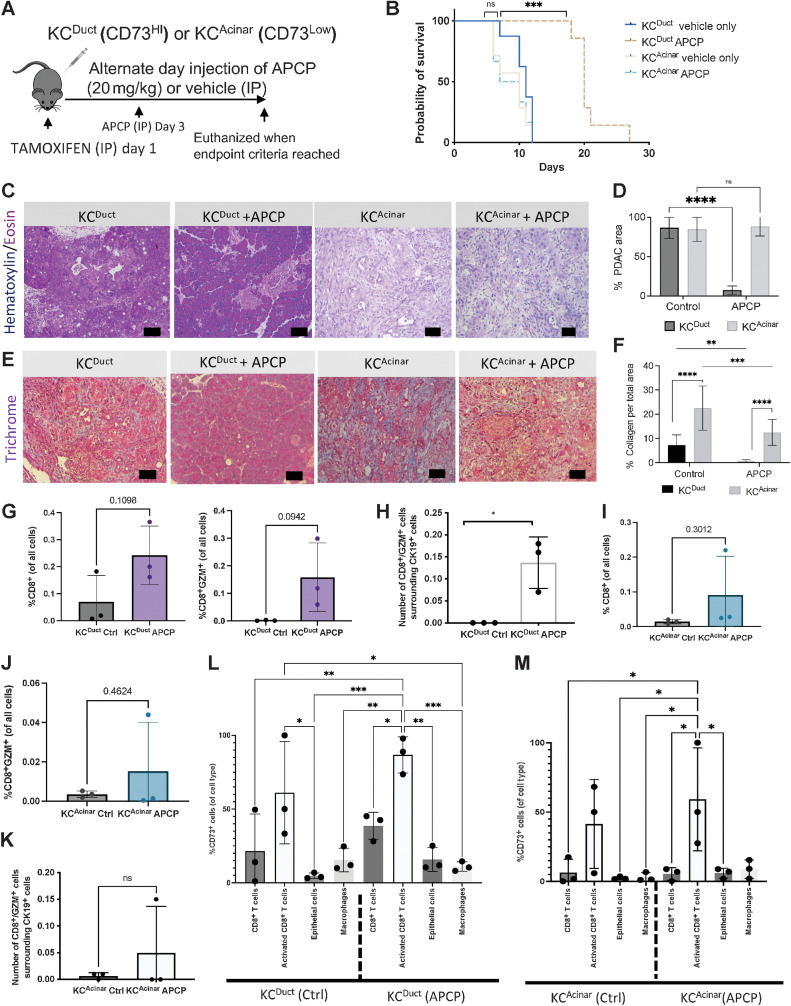
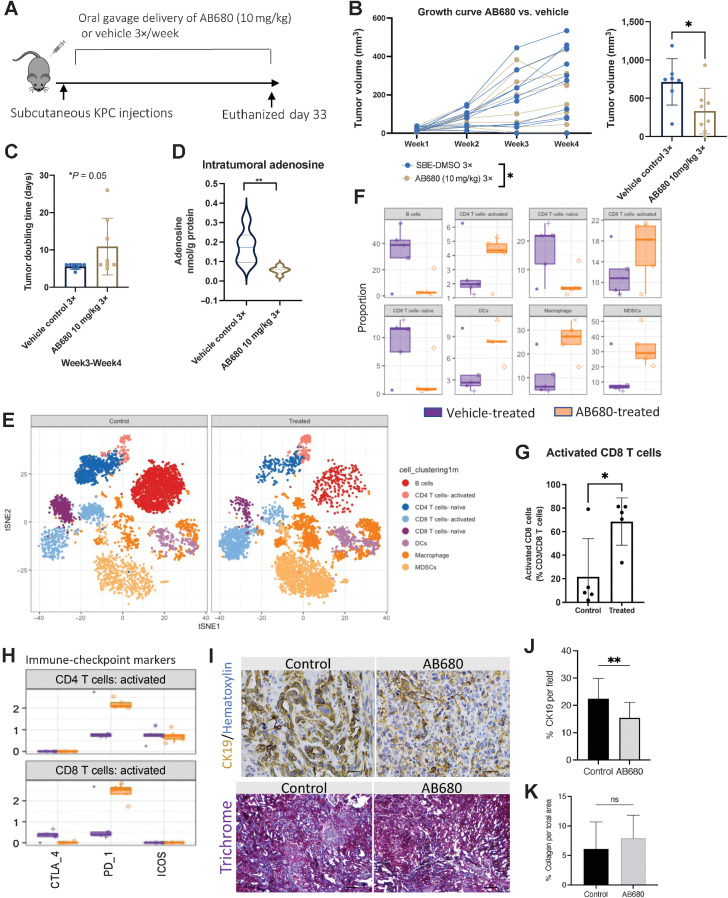
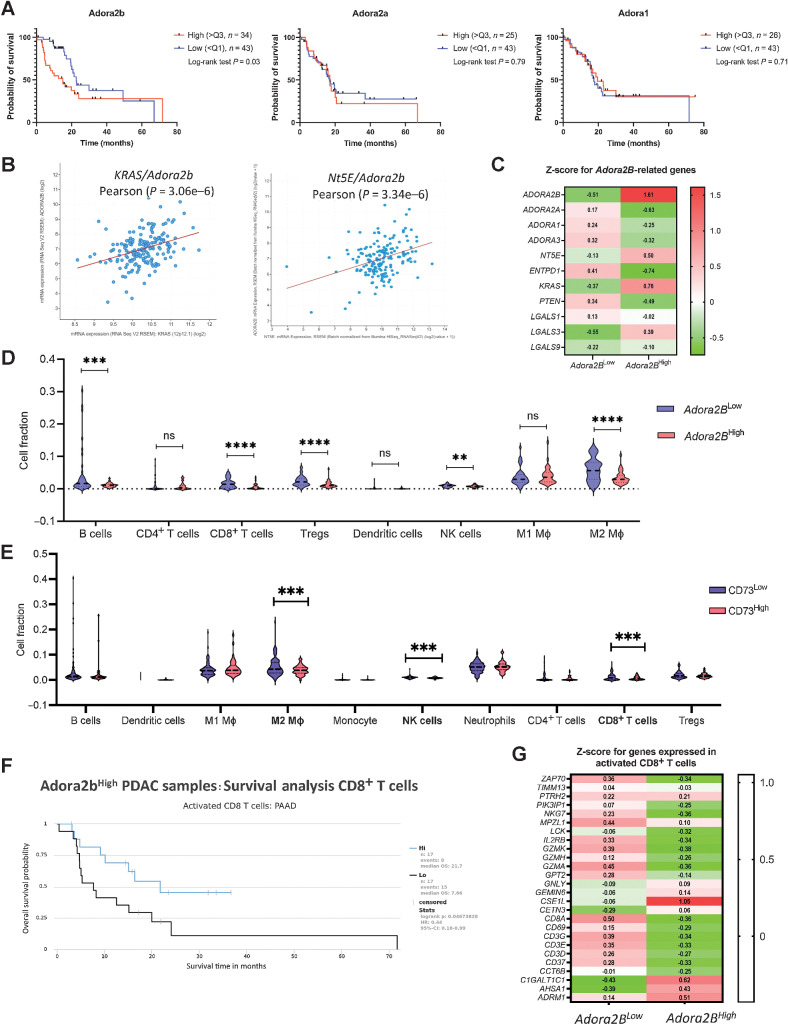
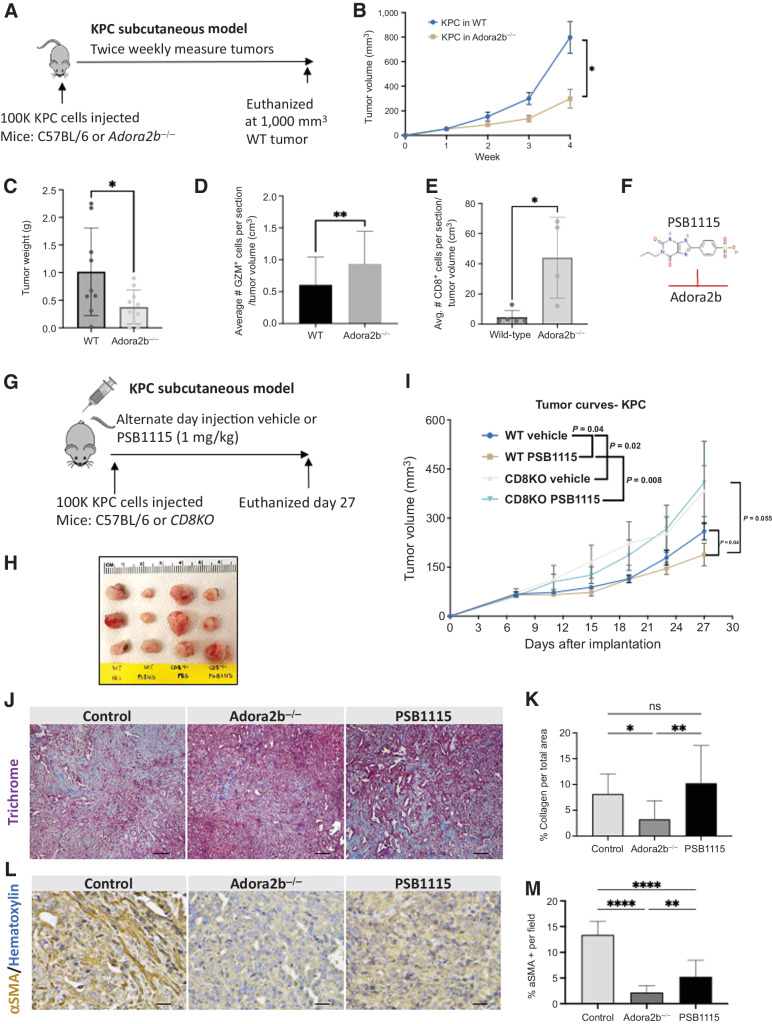
The microenvironment that surrounds pancreatic ductal adenocarcinoma (PDAC) is profoundly desmoplastic and immunosuppressive. Understanding triggers of immunosuppression during the process of pancreatic tumorigenesis would aid in establishing targets for effective prevention and therapy. Here, we interrogated differential molecular mechanisms dependent on cell of origin and subtype that promote immunosuppression during PDAC initiation and in established tumors. Transcriptomic analysis of cell-of-origin-dependent epithelial gene signatures revealed that Nt5e/CD73, a cell-surface enzyme required for extracellular adenosine generation, is one of the top 10% of genes overexpressed in murine tumors arising from the ductal pancreatic epithelium as opposed to those rising from acinar cells. These findings were confirmed by IHC and high-performance liquid chromatography. Analysis in human PDAC subtypes indicated that high Nt5e in murine ductal PDAC models overlaps with high NT5E in human PDAC squamous and basal subtypes, considered to have the highest immunosuppression and worst prognosis. Multiplex immunofluorescent analysis showed that activated CD8+ T cells in the PDAC tumor microenvironment express high levels of CD73, indicating an opportunity for immunotherapeutic targeting. Delivery of CD73 small-molecule inhibitors through various delivery routes reduced tumor development and growth in genetically engineered and syngeneic mouse models. In addition, the adenosine receptor Adora2b was a determinant of adenosine-mediated immunosuppression in PDAC. These findings highlight a molecular trigger of the immunosuppressive PDAC microenvironment elevated in the ductal cell of origin, linking biology with subtype classification, critical components for PDAC immunoprevention and personalized approaches for immunotherapeutic intervention.

Significance: Ductal-derived pancreatic tumors have elevated epithelial and CD8+GZM+ T-cell CD73 expression that confers sensitivity to small-molecule inhibition of CD73 or Adora2b to promote CD8+ T-cell-mediated tumor regression. See related commentary by DelGiorno, p. 977.


Figures

Figure 1. Comparison of ductal and acinar cell–derived tumor signatures to human molecular subtypes of PDAC. A and B, Schematic of the transgenic mouse breeding scheme to generate mutant Kras and Tp53 tumors from acinar and ductal cells and IHC analysis of CK19 to show ductal adenocarcinoma arising in ductal and acinar mouse models of PDAC. C, PCA of KPCDuct and KPCAcinar RNA-seq samples. Tumors arising in ductal and acinar cells have distinct profiles. D, Heat map shows the GSVA scores for human homolog genes derived from mouse ductal and acinar signatures in different samples from ICGC immunogenic and squamous subtypes. The color represents the relative GSVA score. E, Scatter plot of the GSVA scores for human homolog genes derived from mouse ductal and acinar signature genes in ICGC immunogenic and squamous subtypes. F, Violin plot of the GSVA scores for human homolog genes derived from mouse ductal and acinar signature genes in ICGC immunogenic and squamous subtypes. G, Scatter plot of the GSVA scores for human homolog genes derived from mouse ductal and acinar signature genes in TCGA basal and classic subtypes. The big round dots represent the medium of the GSVA scores, while the small round dots represent the score for each sample. We used a nonparametric Wilcoxon rank sum test for both groups. *, P < 0.05; **, P < 0.01. H, Heat map shows the GSVA scores for human homolog genes derived from mouse ductal and acinar signatures in different samples from TCGA basal and classic subtypes. I, Violin plot of the GSVA scores for human homolog genes derived from mouse ductal and acinar signature genes in TCGA basal and classic subtypes. J, Volcano plot showing distinct transcriptomic signatures in the duct and acinar tumors.
Figure 1.
Comparison of ductal and acinar cell–derived tumor signatures with human molecular subtypes of PDAC. A and B, Schematic of the transgenic mouse breeding scheme to generate mutant Kras and Tp53 tumors from acinar and ductal cells and IHC analysis of CK19 to show ductal adenocarcinoma arising in ductal and acinar mouse models of PDAC. C, Principal component analysis of KPCDuct and KPCAcinar RNA-seq samples. Tumors arising in ductal and acinar cells have distinct profiles. D, Heat map shows the GSVA scores for human homolog genes derived from mouse ductal and acinar signatures in different samples from ICGC immunogenic and squamous subtypes. The color represents the relative GSVA score. E, Scatter plot of the GSVA scores for human homolog genes derived from mouse ductal and acinar signature genes in ICGC immunogenic and squamous subtypes. F, Violin plot of the GSVA scores for human homolog genes derived from mouse ductal and acinar signature genes in ICGC immunogenic and squamous subtypes. G, Scatter plot of the GSVA scores for human homolog genes derived from mouse ductal and acinar signature genes in TCGA basal and classic subtypes. The big round dots represent the medium of the GSVA scores, while the small round dots represent the score for each sample. We used a nonparametric Wilcoxon rank sum test for both groups. *, P < 0.05; **, P < 0.01. H, Heat map shows the GSVA scores for human homolog genes derived from mouse ductal and acinar signatures in different samples from TCGA basal and classic subtypes. I, Violin plot of the GSVA scores for human homolog genes derived from mouse ductal and acinar signature genes in TCGA basal and classic subtypes. J, Volcano plot showing distinct transcriptomic signatures in the duct and acinar tumors.
Figure 2. NT5E/CD73 is highly expressed in murine ductal-derived PDAC. A, Venn diagram showing the number of top overlapping genes in murine KPCDuct and human squamous and basal subtypes. NT5E/CD73 is one of the top overlapping genes expressed between KPCDuct, squamous, and basal subtypes. B, TCGA analysis reveals high expression of NT5E/CD73 in human PDAC significantly correlates with worse prognosis. C, IPA analysis of top altered pathways increased (orange) or decreased (blue) in KPC murine cell of origin tumors. D, Leukocyte cell–cell adhesion was one of the top differentially expressed GO categories and nt5e was a significantly elevated gene in ductal-derived PDAC in this category. E, Schematic of a mouse model to generate PanIN and PDAC from ductal cells using an inducible KrasG12V allele. F, Representative H&E and trichrome staining from KCDuct mice. G, IHC analysis of CD73 expression in KCDuct mice. H, Schematic of the experimental setup to generate whole transcriptomic profiles of Kras-mutant pancreatic ducts. I, Gene Ontology Heat Map of highly enriched pathways in Kras-mutant ducts. Regulation of inflammatory response is one of the top GO pathways. Nt5e is elevated in GO: Regulation of inflammatory response. J, Relative RNA-seq signature of Nt5e/CD73 in ex vivo–cultured pancreatic ducts. CD73 is significantly increased in Kras-mutant pancreatic ducts (****, P < 0.001) Student t test (n = 3 per group analyzed by RNA-seq).
Figure 2.
NT5E/CD73 is highly expressed in murine ductal-derived PDAC. A, Venn diagram showing the number of top overlapping genes in murine KPCDuct and human squamous and basal subtypes. NT5E/CD73 is one of the top overlapping genes expressed between KPCDuct, squamous, and basal subtypes. B, TCGA analysis revealed high expression of NT5E/CD73 in human PDAC significantly correlates with worse prognosis. C, Ingenuity Pathway Analysis of top altered pathways increased (orange) or decreased (blue) in KPC murine cell-of-origin tumors. D, Leukocyte cell–cell adhesion was one of the top differentially expressed GO categories and nt5e was a significantly elevated gene in ductal-derived PDAC in this category. E, Schematic of a mouse model to generate PanIN and PDAC from ductal cells using an inducible KrasG12V allele. F, Representative hematoxylin and eosin and trichrome staining from KCDuct mice. G, IHC analysis of CD73 expression in KCDuct mice. H, Schematic of the experimental setup to generate whole transcriptomic profiles of Kras-mutant pancreatic ducts. I, GO heat map of highly enriched pathways in Kras-mutant ducts. Regulation of inflammatory response is one of the top GO pathways. Nt5e is elevated in GO: Regulation of inflammatory response. J, Relative RNA-seq signature of Nt5e/CD73 in ex vivo–cultured pancreatic ducts. CD73 is significantly increased in Kras-mutant pancreatic ducts. **, P < 0.01. Student t test. n = 3 per group analyzed by RNA-seq.
Figure 3. CD73 expression levels on epithelial cells and immune cells correlate with adenosine concentrations in supernatant and tissue. KCDuct and KPC subcutaneous tumors present the highest intratumoral levels of adenosine. A, Supernatant adenosine levels are significantly increased in PDAC cell lines relative to control pancreatic cells (HPNE; P < 0.05; P < 0.001; P < 0.0001), a Student t test was used for statistical comparison. B, IHC images of CD73+ KPC tumor. C, Western blot image and quantification of CD73 levels in Hec1-8 cell lines and lysates from KPC subcutaneous tumors, KCAcinar, and KCDuct pancreata. D, HPLC analysis of the adenosine:AMP ratio from ex vivo–cultured KCDuct and KCAcinar pancreata at the time of euthanasia (n = 3 mice per group). Adenosine:AMP ratios are elevated in cultured KCDuct pancreata compared with KCAcinar pancreata (P = 0.09). E, HPLC analysis of adenosine and AMP levels in WT pancreas, KCDuct or KCAcinar N = 3 samples per group. Intrapancreatic adenosine levels are significantly elevated in KCDuct pancreata consistent with high CD73 expression in KCDuct neoplasia (**, P < 0.01) and intrapancreatic AMP levels are highest in WT and KCAcinar tissue indicating lack of CD73 activity in these tissues (*, P < 0.05). F, Representative CD73 IHC showing high percentage expression of CD73 in ductal-derived PDAC from both KPCDuct and KCDuct when compared with acinar-derived PDAC from KPCAcinar and KCAcinar. G, ImageJ quantification of CD73 expression in the epithelium compared with stroma in ductal-derived compared with acinar-derived PDAC. A Student t test was used for statistical analysis (****, P < 0.0001; ns; n = 5). H, Representative composite multiplex immunofluorescent image from a KPC subQ tumor and (I) KCDuct and KCAcinar pancreata. J, Quantitative assessment of KPC subQ tumor, KCDuct and KCAcinar pancreata using multiplex immunofluorescence. In all groups, activated CD8+ T cells have the highest fluorescence intensity compared with CD8+ T cells, epithelial cells, and macrophages. The overall percentage of CD73 cells was the highest in KPC and KCDuct samples compared. Scale bars, 50 μm.
Figure 3.
CD73 expression levels on epithelial cells and immune cells correlate with adenosine concentrations in supernatant and tissue. KCDuct and KPC subcutaneous tumors present the highest intratumoral levels of adenosine. A, Supernatant adenosine levels are significantly increased in PDAC cell lines relative to control pancreatic cells (HPNE). B, IHC images of CD73+ KPC tumor. C, Western blot image and quantification of CD73 levels in Hec1-8 cell lines and lysates from KPC subcutaneous tumors, KCAcinar and KCDuct pancreata. D, HPLC analysis of the adenosine:AMP ratio from ex vivo–cultured KCDuct and KCAcinar pancreata at the time of euthanasia (n = 3 mice per group). Adenosine:AMP ratios are elevated in cultured KCDuct pancreata compared with KCAcinar pancreata (P = 0.09). E, HPLC analysis of adenosine and AMP levels in WT pancreas, KCDuct, or KCAcinar. N = 3 samples per group. Intrapancreatic adenosine levels are significantly elevated in KCDuct pancreata, consistent with high CD73 expression in KCDuct neoplasia and intrapancreatic AMP levels are highest in WT and KCAcinar tissue, indicating lack of CD73 activity in these tissues. F, Representative CD73 IHC showing high percentage expression of CD73 in ductal-derived PDAC from both KPCDuct and KCDuct when compared with acinar-derived PDAC from KPCAcinar and KCAcinar. G, ImageJ quantification of CD73 expression in the epithelium compared with stroma in ductal-derived compared with acinar-derived PDAC (n = 5). H and I, Representative composite multiplex immunofluorescent image from a KPC subQ tumor (H) and KCDuct and KCAcinar pancreata (I). J, Quantitative assessment of KPC subQ tumor, KCDuct and KCAcinar pancreata using multiplex immunofluorescence. In all groups, activated CD8+ T cells have the highest fluorescence intensity compared with CD8+ T cells, epithelial cells, and macrophages. The overall percentage of CD73 cells was the highest in KPC and KCDuct samples compared. Scale bars, 50 μm. A Student t test was used for statistical comparison. *, P < 0.05; **, P < 0.01; ***, P < 0.001; ****, P < 0.0001; ns, nonsignificant.
Figure 4. Inhibition of CD73 using intraperitoneal delivery of APCP significantly reduces spontaneous aggressive ductal-derived PDAC. A, Schematic of the preclinical model to evaluate the requirement for CD73 in a spontaneous GEM model of ductal-derived PDAC. B, APCP significantly improved survival only in KCDuct GEM mice (n = 5 mice per group). C, Representative H&Es of vehicle-treated compared with APCP-treated KCDuct and KCAcinar pancreata. D, Inhibition of CD73 significantly reduced PDAC area in KCDuct (n = 2) compared with control (n = 3) but not KCAcinar GEM mice (n = 2) compared with control (n = 2) (****, P < 0.0001; ***, P < 0.001; **, P < 0.01). E, Trichrome images showing PDAC areas in KCDuct and KCAcinar GEM mice in both vehicle and APCP-treated groups. F, APCP treatment significantly reduced the percentage of collagen in both KCDuct and KCAcinar pancreata. A two-way ANOVA was used to compare groups. G, Quantification of multiplex immunofluorescent analysis of %CD8+ cells or %CD8+GZM+ cells per whole tissue on the section from KCDuct Ctrl- and APCP-treated mice (n = 3). H, Spatial quantification showing a significant increase in CD8+GZM+ cells within 80 μm radius of CD19+ cells in APCP-treated KCDuct pancreata compared with Ctrl KCDuct (*, P < 0.05; n = 3). I, Quantification of multiplex immunofluorescent analysis of %CD8+ cells or (J) %CD8+GZM+ cells per field in pancreata from KCAcinar Ctrl- and APCP-treated mice (n = 3). K, Spatial quantification showing an increase in CD8+GZM+ cells within 80 μm radius of CD19+ cells in APCP-treated KCAcinar pancreata compared with Ctrl KCAcinar (ns; n = 3). L and M, Quantification of %CD73+ cells per cell type in Ctrl versus APCP-treated samples. In KCDuct, but not KCAcinar, we quantified a 2-fold increase in CD73+CD8+ T cells, 1.5-fold increase in CD73+CD8+GZM+ T cells, and a 4-fold increase in CD73+ epithelium in pancreata from APCP-treated mice (n = 3).
Figure 4.
Inhibition of CD73 using intraperitoneal delivery of APCP significantly reduces spontaneous aggressive ductal-derived PDAC. A, Schematic of the preclinical model to evaluate the requirement for CD73 in a spontaneous GEM model of ductal-derived PDAC. B, APCP significantly improved survival only in KCDuct GEM mice (n = 5 mice per group). C, Representative hematoxylin and eosin staining of vehicle-treated compared with APCP-treated KCDuct and KCAcinar pancreata. D, Inhibition of CD73 significantly reduced PDAC area in KCDuct (n = 2) compared with control (n = 3) but not KCAcinar GEM mice (n = 2) compared with control (n = 2). E, Trichrome images showing PDAC areas in KCDuct and KCAcinar GEM mice in both vehicle and APCP-treated groups. F, APCP treatment significantly reduced the percentage of collagen in both KCDuct and KCAcinar pancreata. A two-way ANOVA was used to compare groups. G, Quantification of multiplex immunofluorescent analysis of %CD8+ cells or %CD8+GZM+ cells per whole tissue on the section from KCDuct Ctrl- and APCP-treated mice (n = 3). H, Spatial quantification showing a significant increase in CD8+GZM+ cells within 80 μm radius of CD19+ cells in APCP-treated KCDuct pancreata compared with Ctrl KCDuct (n = 3). I and J, Quantification of multiplex immunofluorescent analysis of %CD8+ cells (I) or %CD8+GZM+ cells (J) per field in pancreata from KCAcinar Ctrl- and APCP-treated mice (n = 3). K, Spatial quantification showing an increase in CD8+GZM+ cells within 80 μm radius of CD19+ cells in APCP-treated KCAcinar pancreata compared with Ctrl KCAcinar (n = 3). L and M, Quantification of %CD73+ cells per cell type in Ctrl versus APCP-treated samples. In KCDuct, but not KCAcinar, we quantified a 2-fold increase in CD73+CD8+ T cells, 1.5-fold increase in CD73+CD8+GZM+ T cells, and a 4-fold increase in CD73+ epithelium in pancreata from APCP-treated mice (n = 3). *, P < 0.05; **, P < 0.01; ***, P < 0.001; ****, P < 0.0001; ns, nonsignificant.
Figure 5. AB680 oral gavage treatment reduces tumor KPC tumor growth rate and elevates intratumoral activated CD8+ T cells. A, KPC subcutaneous tumors were analyzed weekly (n = 10 per group). B, AB680 treatment significantly decreased KPC subcutaneous growth rates and at the conclusion of this experiment, AB680-treated mice had significantly smaller tumor volume than vehicle control-treated mice. *, P < 0.05. Statistical analysis was performed using a Student t test in Prism GraphPad software. C, Graphical representation of subcutaneous tumor growth rates for analysis of individual tumor doubling time (*, P < 0.05), n = 6. D, HPLC analysis shows a significant decrease in adenosine levels in tumors from AB680-treated mice versus vehicle-treated mice. **, P < 0.01 compared with vehicle controls (n = 8 per group). E, CyTOF vSNE plots by group show elevated clusters of activated CD8 T cells, CD4 T cells, MDSCs, and macrophages. F, Quantitative global population analysis reveals increased activated CD4 T cells, CD8 T cells, macrophages, and MDSCs. G, Quantitative analysis of significantly increased activated CD8 T cells. *, P < 0.05 and a Student test using Prism GraphPad software was used to calculate statistics. H, Activated CD4 and CD8 T cells increased expression of PD-1. I, Representative CK19 and trichrome staining of tumors from control- (vehicle) and AB680-treated mice. J, Tumors from AB680-treated mice had significantly reduced expression of CK19 (**, P < 0.01) and no significant difference in % collagen per total area. K, Scale bars, 50 μm.
Figure 5.
AB680 oral gavage treatment reduces tumor KPC tumor growth rate and elevates intratumoral activated CD8+ T cells. A, KPC subcutaneous tumors were analyzed weekly (n = 10 per group). B, AB680 treatment significantly decreased KPC subcutaneous growth rates and at the conclusion of this experiment, AB680-treated mice had significantly smaller tumor volume than vehicle control-treated mice. *, P < 0.05. Statistical analysis was performed using a Student t test in Prism GraphPad software. C, Graphical representation of subcutaneous tumor growth rates for analysis of individual tumor doubling time. n = 6. *, P < 0.05. D, HPLC analysis shows a significant decrease in adenosine levels in tumors from AB680-treated mice versus vehicle-treated mice. **, P < 0.01 compared with vehicle controls (n = 8 per group). E, CyTOF vSNE plots by group show elevated clusters of activated CD8 T cells, CD4 T cells, MDSCs, and macrophages. F, Quantitative global population analysis reveals increased activated CD4 T cells, CD8 T cells, macrophages, and MDSCs. G, Quantitative analysis of significantly increased activated CD8 T cells. *, P < 0.05. A Student test using Prism GraphPad software was used to calculate statistics. H, Activated CD4 and CD8 T cells increased expression of PD-1. I, Representative CK19 and trichrome staining of tumors from control- (vehicle) and AB680-treated mice. J and K, Tumors from AB680-treated mice had significantly reduced expression of CK19 (**, P < 0.01; J) and no significant difference (ns) in % collagen per total area (K). Scale bars, 50 μm.
Figure 6. Adenosine signaling through Adora2b on CD8+ T cells correlates with reduced survival and PDAC progression. A, TCGA analysis reveals that high expression of Adora2b human PDAC significantly correlates with worse prognosis (left). No differences were found in Adora2a (middle) or Adora1 (right). B, Adora2b expression in human PDAC positively correlates with Kras and Nt5E. C, Z score comparison of Adora2b-related genes shows a positive correlation with Kras and Nt5E, whereas a negative correlation was observed for Adora2a, Adora1, Adora3, Entpd1/CD39, and Pten. Z scores were downloaded from TCGA–PAAD cBioPortal. D, To analyze the distribution of immune cells in patients with high (n = 26) and low (n = 46) Adora2b expression in two groups, data analyzed with the Quantiseq algorithm were downloaded from The Cancer Immunome Database. Patients with high Adora2b expression presented a decreased abundance of B cells, CD8+ T cells, Tregs, NK cells, and M2 macrophages. Student t test was used to analyze significance. E, Similar results were observed when analyzing Immunome atlas data from patients with high (n = 44) and low (n = 103) expression levels of NT5E. Student t test was used to analyze significance. F, Patients with high Adora2b expression who have a lower abundance of activated CD8+ T cells present a worse prognosis. G, Analysis of genes expressed in activated CD8+ T cells confirmed lower overall expression of activated CD8+ T-cell gene expression in patients with high Adora2b expression. Z scores were extracted from The Cancer Immunome Database and TCGA–PAAD cBioPortal.
Figure 6.
Adenosine signaling through Adora2b on CD8+ T cells correlates with reduced survival and PDAC progression. A, TCGA analysis revealed that high expression of Adora2b human PDAC significantly correlates with worse prognosis (left). No differences were found in Adora2a (middle) or Adora1 (right). B,Adora2b expression in human PDAC positively correlates with Kras and Nt5E. C, Z score comparison of Adora2b-related genes shows a positive correlation with Kras and Nt5E, whereas a negative correlation was observed for Adora2a, Adora1, Adora3, Entpd1/CD39, and Pten. Z scores were downloaded from TCGA–PAAD cBioPortal. D, To analyze the distribution of immune cells in patients with high (n = 26) and low (n = 46) Adora2b expression in two groups, data analyzed with the Quantiseq algorithm were downloaded from The Cancer Immunome Database. Patients with high Adora2b expression presented a decreased abundance of B cells, CD8+ T cells, Tregs, NK cells, and M2 macrophages. Student t test was used to analyze significance. E, Similar results were observed when analyzing Immunome atlas data from patients with high (n = 44) and low (n = 103) expression levels of NT5E. Student t test was used to analyze significance. F, Patients with high Adora2b expression who have a lower abundance of activated CD8+ T cells present a worse prognosis. G, Analysis of genes expressed in activated CD8+ T cells confirmed lower overall expression of activated CD8+ T-cell gene expression in patients with high Adora2b expression. Z scores were extracted from The Cancer Immunome Database and TCGA–PAAD cBioPortal. **, P < 0.01; ***, P < 0.001; ****, P < 0.0001; ns, nonsignificant.
Figure 7. Antitumoral effect of Adora2b inhibition is CD8+ T-cell dependent. A, Schematic of KPC subcutaneous preclinical model to evaluate the role of Adora2b in PDAC tumor development. B, Mice lacking Adora2b (Adora2b−/−) presented delayed KPC subQ tumor growth compared with WT mice and (C) decreased tumor weight compared with WT mice. D, Tumor that developed in mice lacking Adora2b (Adora2b−/−) presented significantly increased CD8+ T cells (*, P < 0.05) and (E) significantly increased GZM staining per tumor volume compared with WT mice (**, P < 0.01; n = 14 fields/group). F, Chemical structure of PSB1115, Adora2b inhibitor, and (G) schematic of KPC subcutaneous preclinical model to evaluate the role of Adora2b in PDAC tumor development. H and I, Inhibition of Adora2b with PSB1115 reduces tumor growth rate only when injected in WT mice. The effect is lost when KPC cells are injected in CD8KO mice (*, P < 0.05; n = 8 mice per group). J, Trichrome staining to evaluate collagen abundance in control, Adora2b−/− and PSB1115-treated tumors. K, KPC tumors growing in Adora2b−/− had significantly reduced collagen compared with control tumors (*, P < 0.05); however, there was no difference in the percentage of collagen per field in tumors from PSB1115-treated mice (n = 12 fields analyzed per group). L, IHC for ⍺SMA to evaluate stromal changes in KPC tumors from Adora2b−/− and tumors from PSB1115-treated mice. M, The %⍺SMA+ staining was significantly decreased in KPC tumors grown in Adora2b−/− mice (****, P < 0.0001) and in tumors from PSB1115-treated mice (****, P < 0.0001); n = 15 sections per group.
Figure 7.
Antitumoral effect of Adora2b inhibition is CD8+ T-cell dependent. A, Schematic of KPC subcutaneous preclinical model to evaluate the role of Adora2b in PDAC tumor development. B, Mice lacking Adora2b (Adora2b−/−) presented delayed KPC subQ tumor growth compared with WT mice and (C) decreased tumor weight compared with WT mice. D and E, Tumors that developed in mice lacking Adora2b (Adora2b−/−) presented significantly increased GZM staining per tumor volume compared with WT mice (n = 14 fields/group; D) and presented significantly increased CD8+ T cells (E). F and G, Chemical structure of PSB1115 (F), Adora2b inhibitor, and schematic of KPC subcutaneous preclinical model (G) to evaluate the role of Adora2b in PDAC tumor development. H and I, Inhibition of Adora2b with PSB1115 reduces tumor growth rate only when injected in WT mice. The effect is lost when KPC cells are injected in CD8KO mice (n = 8 mice per group). J, Trichrome staining to evaluate collagen abundance in control, Adora2b−/−, and PSB1115-treated tumors. K, KPC tumors growing in Adora2b−/− had significantly reduced collagen compared with control tumors; however, there was no difference in the percentage of collagen per field in tumors from PSB1115-treated mice (n = 12 fields analyzed per group). L, IHC for αSMA to evaluate stromal changes in KPC tumors from Adora2b−/− and tumors from PSB1115-treated mice. M, The percentage of αSMA+ staining was significantly decreased in KPC tumors grown in Adora2b−/− mice and in tumors from PSB1115-treated mice. n = 15 sections per group. *, P < 0.05; **, P < 0.01; ****, P < 0.0001; ns, nonsignificant.

Comment in

References

    1. Freed-Pastor WA, Lambert LJ, Ely ZA, Pattada NB, Bhutkar A, Eng G, et al. . The CD155/TIGIT axis promotes and maintains immune evasion in neoantigen-expressing pancreatic cancer. Cancer Cell 2021;39:1342–60. - PMC - PubMed
    1. Hosein AN, Brekken RA, Maitra A. Pancreatic cancer stroma: an update on therapeutic targeting strategies. Nat Rev Gastroenterol Hepatol 2020;17:487–505. - PMC - PubMed
    1. Katz MHG, Shi Q, Meyers J, Herman JM, Chuong M, Wolpin BM, et al. . Efficacy of preoperative mFOLFIRINOX vs mFOLFIRINOX plus hypofractionated radiotherapy for borderline resectable adenocarcinoma of the pancreas: the A021501 phase 2 randomized clinical trial. JAMA Oncol 2022;8:1263–70. - PMC - PubMed
    1. Grenz A, Zhang H, Eckle T, Mittelbronn M, Wehrmann M, Köhle C, et al. . Protective role of ecto-5'-nucleotidase (CD73) in renal ischemia. J Am Soc Nephrol 2007;18:833–45. - PubMed
    1. Synnestvedt K, Furuta GT, Comerford KM, Louis N, Karhausen J, Eltzschig HK, et al. . Ecto-5'-nucleotidase (CD73) regulation by hypoxia-inducible factor-1 mediates permeability changes in intestinal epithelia. J Clin Invest 2002;110:993–1002. - PMC - PubMed

Publication types