. 2023 Feb 14;56(2):369-385.e6.
doi: 10.1016/j.immuni.2023.01.003. Epub 2023 Jan 30.

Graft-versus-host disease is locally maintained in target tissues by resident progenitor-like T cells

Affiliations

Graft-versus-host disease is locally maintained in target tissues by resident progenitor-like T cells

Faruk Sacirbegovic et al. Immunity. .

Abstract

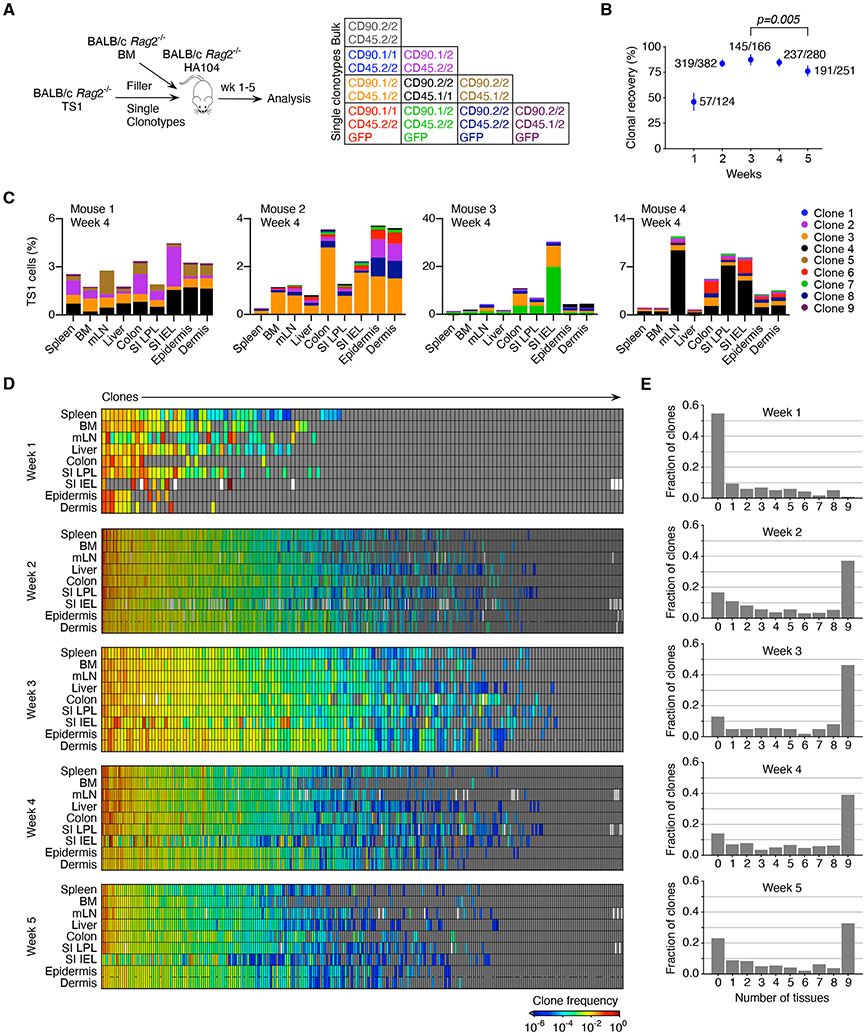
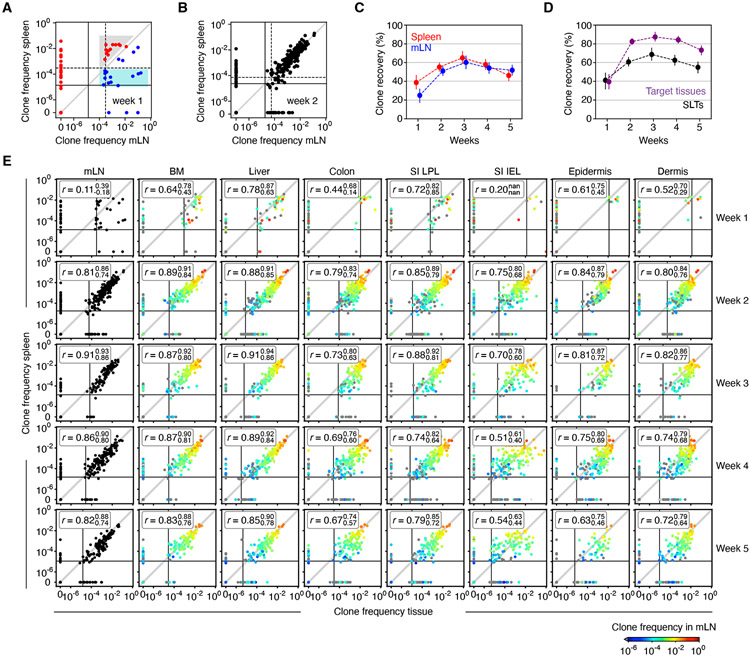
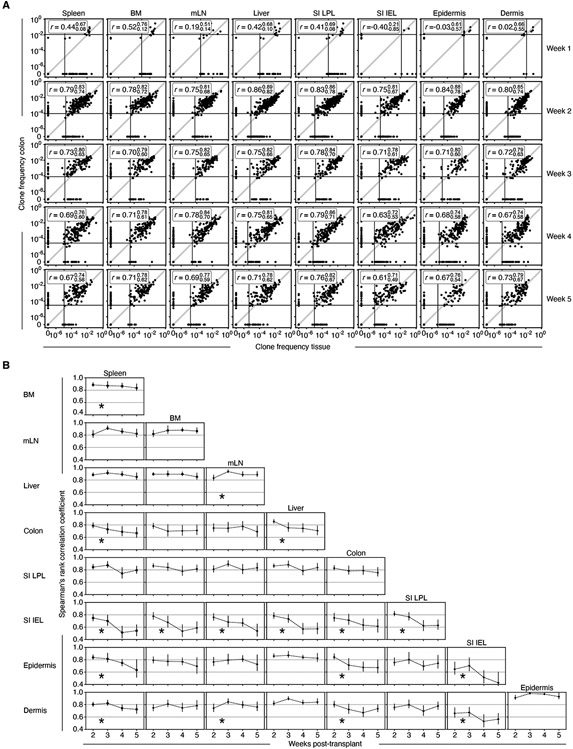
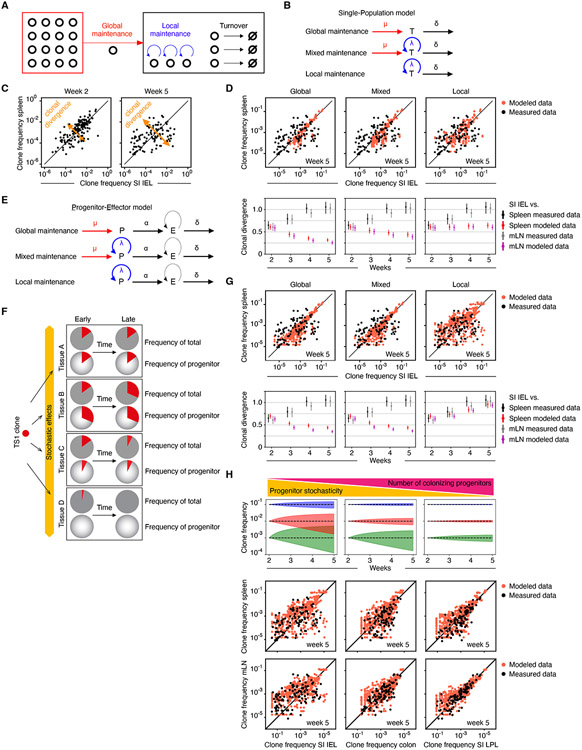
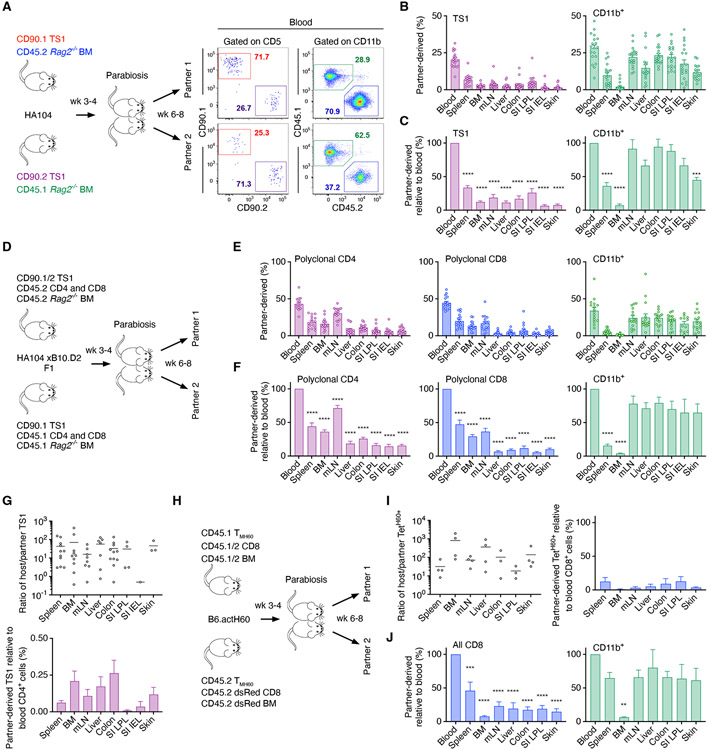
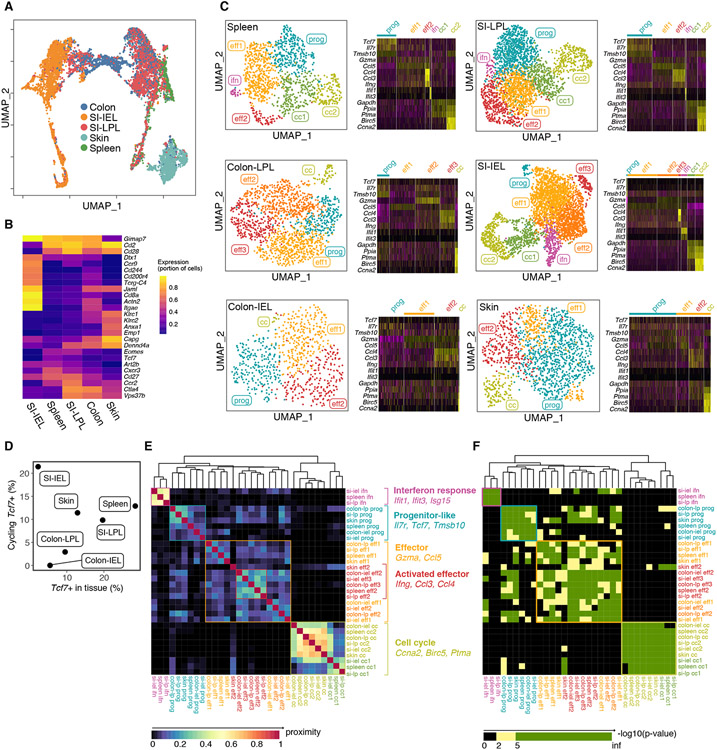
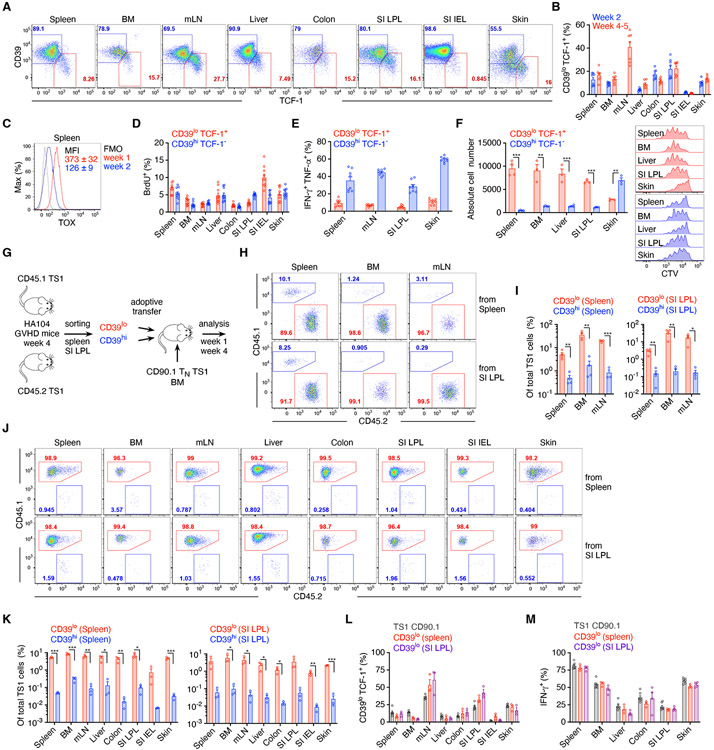
In allogeneic hematopoietic stem cell transplantation, donor αβ T cells attack recipient tissues, causing graft-versus-host disease (GVHD), a major cause of morbidity and mortality. A central question has been how GVHD is sustained despite T cell exhaustion from chronic antigen stimulation. The current model for GVHD holds that disease is maintained through the continued recruitment of alloreactive effectors from blood into affected tissues. Here, we show, using multiple approaches including parabiosis of mice with GVHD, that GVHD is instead primarily maintained locally within diseased tissues. By tracking 1,203 alloreactive T cell clones, we fitted a mathematical model predicting that within each tissue a small number of progenitor T cells maintain a larger effector pool. Consistent with this, we identified a tissue-resident TCF-1+ subpopulation that preferentially engrafted, expanded, and differentiated into effectors upon adoptive transfer. These results suggest that therapies targeting affected tissues and progenitor T cells within them would be effective.

Keywords: T cell exhaustion; TCF-1; TCF-7; Tpex; allogeneic hematopoietic stem cell transplantation; computational modeling; graft-versus-host disease; mouse models; parabiosis; single-cell RNA sequencing.


Conflict of interest statement

Declaration of interests W.D.S. is a cofounder, stockholder, and compensated advisor for BlueSphere Bio. He is also a compensated advisor for Orca Bio.

Figures

Figure 1.
Figure 1.. TS1 clonal progeny distribute unequally.
(A) Experimental design. Irradiated BALB/c Rag2−/− HA104 mice were reconstituted with BALB/c Rag2−/− BM, 500 TS1 of one clonotype and single cell-sorted TS1 of 6-8 additional clonotypes. (B) Percentages of infused clones (#detected/#infused) recovered at analysis timepoints; error bars represent 95% confidence intervals obtained with nonparametric Bootstrap . Statistical significance was determined by Fisher’s exact test. (C) Clone distributions in 4 representative mice. Each mouse received 6-8 of 9 possible clones. (D) Clone frequencies represented as a heat map (see Supplemental Methods) at each time point. Each cell in a column depicts the frequency of a single clone in a single mouse in each tissue. Clones are ordered left to right from highest to lowest frequency. White rectangles indicate technical failures in cell isolations and gray boxes represent clones that were not detected. (E) Fraction of clones detected in 0-9 tissues. Data are from the analysis of 1203 infused clones recovered from a total of 186 mice (17 at week 1; 61 at week 2; 30 at week 3; 38 at week 4; and 40 at week 5. See Figure S1.
Figure 2.
Figure 2.. GVHD initiation and maintenance as revealed by clone frequency analyses.
(A) Comparison of clone frequencies in spleen and mLN 1-week post-transplant. Solid and dashed lines represent the inverse of the average number of TS1 events recorded in spleen and mLN, respectively (smaller values indicate more sensitive clone detection). Red and blue clones have higher frequencies in spleen or mLN (respectively). Shared clones in the gray area likely originated in spleen, diluted by TS1 originating in the mLN. Clones in the blue area likely originated in mLN, diluted by clones originating in spleen. (B) As in (A) but for week 2. (C) The fraction of clones detected in spleen or mLN. (D) The fraction of clones detected in mLN or spleen (SLT) and in all other locations. (E) Clone frequencies in spleen versus other tissues. Solid lines are the inverse of the average number of TS1 events analyzed. Dot color (blue to red) indicates each clone’s frequency in mLN. “r” denotes Spearman’s rank correlation coefficients with upper and lower 95% confidence limits obtained via nonparametric bootstrap. Data are from the analysis of 1203 infused clones recovered from a total of 186 mice (17 at week 1; 61 at week 2; 30 at week 3; 38 at week 4; and 40 at week 5). See Figure S2.
Figure 3.
Figure 3.. Clonal compositions of some tissues become less related to each other over time.
(A) Clone frequency plots from weeks 1 to 5 post-transplant comparing TS1 clone frequencies in colon to TS1 clone frequencies in all other tissues. Solid lines are the inverse of the average number of TS1 analyzed for each tissue, “r” are Spearman’s rank correlation coefficients with upper and lower 95% confidence limits obtained via nonparametric bootstrap. (B) Spearman rank correlation coefficients for cross-tissue clonal composition comparisons. * Denotes a statistically significant divergence between tissues over time (Brown-Forsythe test with p<0.05; see Supplemental Methods). Data are from the analysis of 1203 infused clones recovered from a total of 186 mice (17 at week 1; 61 at week 2; 30 at week 3; 38 at week 4; and 40 at week 5). Error bars (B) and bounds on r values (A) show upper and lower 95% confidence limits obtained via nonparametric bootstrap.
Figure 4.
Figure 4.. Modeling GVHD maintenance.
(A) T cells in GVHD target tissues could be maintained by self-renewal of tissue-resident T cells (local maintenance; blue curved arrows) and/or influx of T cells from SLTs via blood (global maintenance; red arrow). (B) Models wherein T cells are maintained only by influx from SLTs (upper row), a combination of influx and self-renewal (middle row), or solely self-renewal (lower row). Influx (μ); self-renewal (λ); and loss (δ). (C) Clonal divergence is manifest by tissue-versus-tissue (e.g., spleen vs IEL) clone frequencies becoming less similar over time. (D) Clonal divergence in mathematical models and experimental data. Upper row, clone frequencies in spleen and SI-IEL at week 5 simulated with the models in (B) and using the observed clone frequencies at week 2 as the initial condition. The “mixed” model assumes 30% maintenance by influx. Lower row, clonal divergence over time for global, mixed, and local maintenance models, comparing SI-IEL to the spleen or mLN. (E) Models with a progenitor (P)-effector (E) hierarchy, maintaining the T cell population only by influx from SLTs (upper row), a combination of influx and self-renewal (middle row), or solely self-renewal (lower row). (F) For each clone, during the seeding phase relatively rare T cells with progenitor potential can be unequally distributed to tissues through stochastic effects. This will cause the frequency of each clone’s contribution to the entire progenitor pool to be different from the frequency of that clone among all effector cells. With time, clone frequencies of effector cells will shift to parallel that of the seeded progenitors which could be a driver of later clone divergence. (G) Clonal divergence in mathematical models as in (D) except now incorporating the progenitor-effector cell relationships as in (E) and (F). (H) Stochastic effects on clone frequency changes over time (blue, red, and green shaded areas indicate 0.05-quantile ranges) are inversely proportional to the number of colonizing progenitors and the clone frequency itself (top panel). The bottom panel shows this concept applied to simulations of clone correlations between spleen or mLN with SI-IEL (same data as in G), colon and SI-LPL which have high, intermediate, and little clone decorrelation. The simulations fit the observed data assuming 300, 3000 and 30,000 colonizing progenitors in SI-IEL, colon, and SI-LPL, respectively, by week 2 post-transplant. Error bars show upper and lower 95% confidence limits obtained via nonparametric bootstrap. See Figure S3.
Figure 5.
Figure 5.. Parabiosis demonstrates a component of local GVHD maintenance.
(A) Experimental design and representative staining of blood from a pair at sacrifice. (B, C) Percentages of partner-derived TS1 and CD11b+ cells in tissues (B), normalized to their percentages in blood (C). (D) Experimental design for parabiosis of F1 mice. (E, F) Contributions by partner-derived polyclonal CD4+ and CD8+ T cells and CD11b+ cells (E), normalized to their ratios in blood (F). (G) Host-derived/partner-derived ratios of tissue TS1 cells (left panel) and normalized to the host/partner ratio of polyclonal CD4+ T cells in blood (right panel). (H) Experimental design for parabiosis of B6actH60 mice. (I) Ratio of host/partner TetH60+ cells, also normalized to the ratios of polyclonal CD8+ T cells in blood. (J) Percentage of all partner-derived CD8+ T cells and CD11b+ cells normalized to their ratios in blood. Data are mean ± SEM from a total of n=19 (B, C), n=16 (E-G) and n=4 (I, J) mice. Statistical significance was determined by one-way ANNOVA (p**<0.01, p***<0.001, p***<0.0001). See Figure S4.
Figure 6.
Figure 6.. scRNAseq reveals progenitor-like clusters.
TS1 cells extracted from spleen, colon, SI-IEL, SI-LPL and skin 28 days post-transplant underwent scRNAseq (2 biologic replicates; See Methods). (A) Transcriptomes grouped in UMAP space segregated by tissue-of-origin driven by genes shown in (B). (C) Left panels, UMAP representations. Based on core expressed genes, clusters were labeled as having signatures of being in cell cycle (cc), effectors (eff1, eff2), interferon response (ifn) or being progenitor-like (prog). Right panels. Relative expression of selected genes in each cluster. (D) Frequency of Tcf7-expressing cells that also have a cell cycle signature. (E) Gene overlap of clusters across tissues. (F) Significance of marker gene overlap across clusters and tissue. Cluster grouping and annotation as in (E). See Figure S6.
Figure 7.
Figure 7.. TCF-1+ T cells develop and have greater proliferation and survival.
(A) Representative CD39 and TCF-1 staining, 5 weeks post-transplantation. (B) Frequencies of CD39hiTCF-1 and CD39loTCF-1+ TS1 cells at the indicated times post-transplantation. (C) TOX expression of splenic TS1. (D) Percentage of BrdU+ CD39hiTCF-1 and CD39loTCF-1+ TS1 cells from the indicated tissues, 5 weeks post-transplantation. (E) Frequencies of IFN-γ+TNF-α+ among CD39hiTCF-1 and CD39loTCF-1+ TS1 cells 4 weeks post-transplant after stimulation with S1 peptide-pulsed splenocytes. (F) CD39hi and CD39lo TS1 cells sorted from the indicated tissues 4 weeks post-transplant were cultured with S1 peptide-pulsed splenocytes. Numbers of cells and representative CTV dilution histograms are shown. (G) Design for the competitive adoptive transfer experiments. (H-K) Recipients were analyzed 1 (H, I) and 4 weeks (J, K) post-transplant. (H, J) Representative flow cytometry. (I, K) Percentages of total TS1 cells derived from the progeny of adoptively transferred CD39lo and CD39hi TS1 cells. (L, M) Percentages of CD39loTCF-1+ (L) and IFN-γ+ (M) cells among progeny of adoptively transferred CD39lo and naïve TS1 cells. Data are representative of 2 independent experiments (A, D-L), or pooled from one (C, M) or two (B) experiments with n=3-4 mice/group per experiment. Bar graphs depict means ± SEM. Statistical significance was determined by two-tailed Student’s t-test (p*<0.05, p**<0.01, p***<0.001). See Figure S7.

References

    1. Copelan EA (2006). Hematopoietic stem-cell transplantation. New England Journal of Medicine 354, 1813–1826. - PubMed
    1. Hill GR, Betts BC, Tkachev V, Kean LS, and Blazar BR (2021). Current Concepts and Advances in Graft-Versus-Host Disease Immunology. Annu Rev Immunol 39, 19–49. 10.1146/annurev-immunol-102119-073227. - DOI - PMC - PubMed
    1. Zeiser R, and Blazar BR (2017). Acute Graft-versus-Host Disease - Biologic Process, Prevention, and Therapy. N Engl J Med 377, 2167–2179. 10.1056/NEJMra1609337. - DOI - PMC - PubMed
    1. Shlomchik WD (2007). Graft-versus-host disease. Nat Rev Immunol 7, 340–352. - PubMed
    1. Koyama M, Kuns RD, Olver SD, Raffelt NC, Wilson YA, Don AL, Lineburg KE, Cheong M, Robb RJ, Markey KA, et al. (2011). Recipient nonhematopoietic antigen-presenting cells are sufficient to induce lethal acute graft-versus-host disease. Nat Med 18, 135–142. 10.1038/nm.2597. - DOI - PubMed

Publication types

MeSH terms