. 2023 Feb 14;56(2):444-458.e5.
doi: 10.1016/j.immuni.2023.01.002. Epub 2023 Jan 30.

The landscape of immune dysregulation in Crohn's disease revealed through single-cell transcriptomic profiling in the ileum and colon

Affiliations

The landscape of immune dysregulation in Crohn's disease revealed through single-cell transcriptomic profiling in the ileum and colon

Lingjia Kong et al. Immunity. .

Erratum in

Abstract

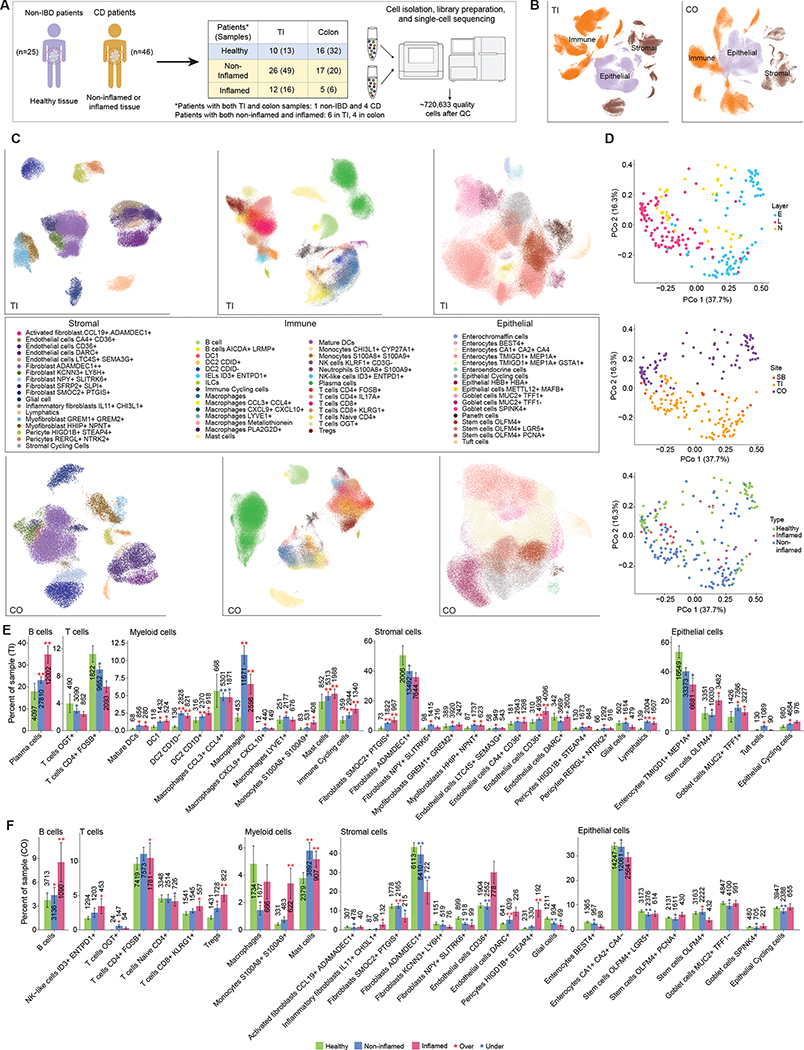
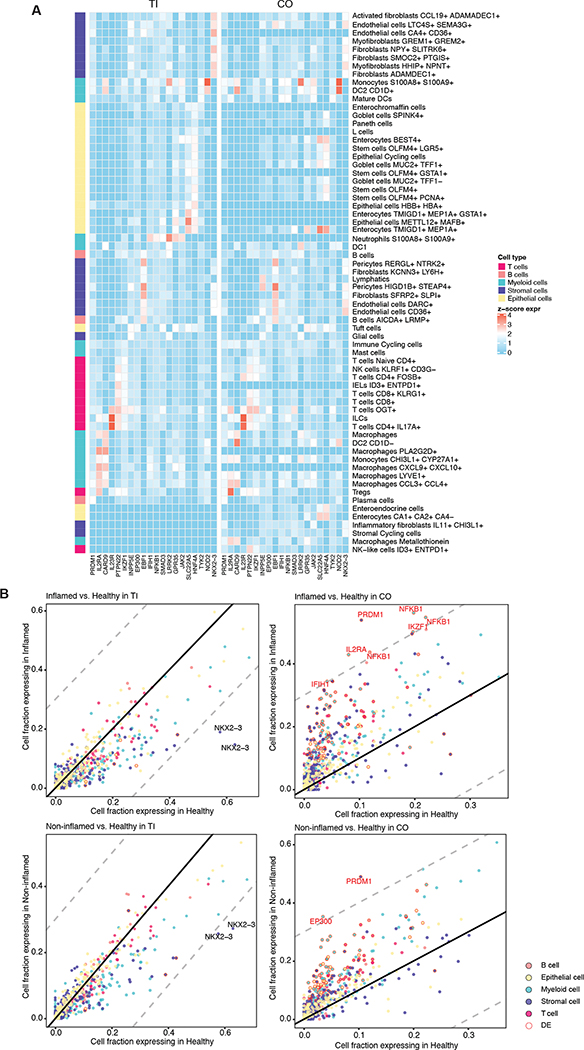
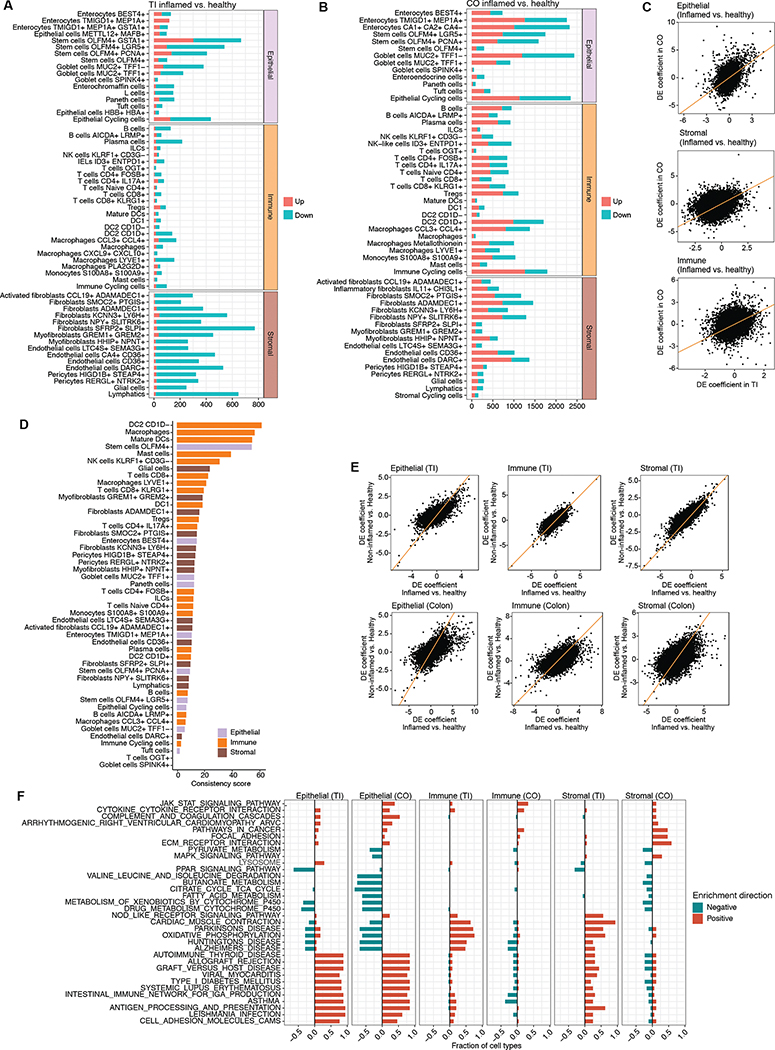
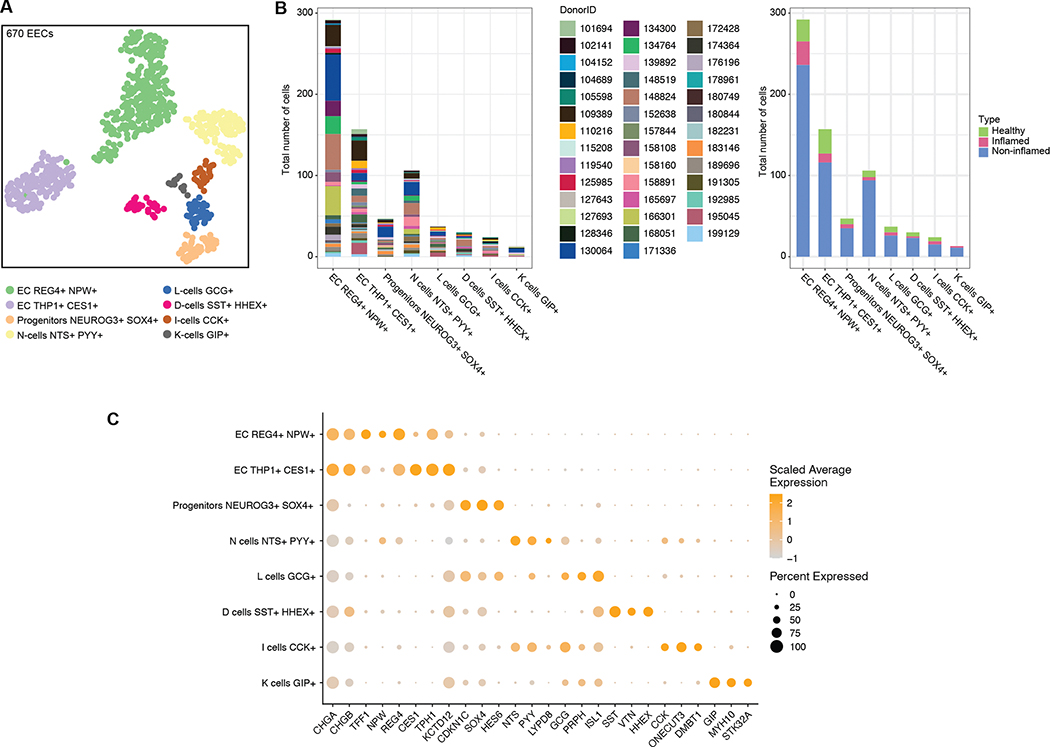
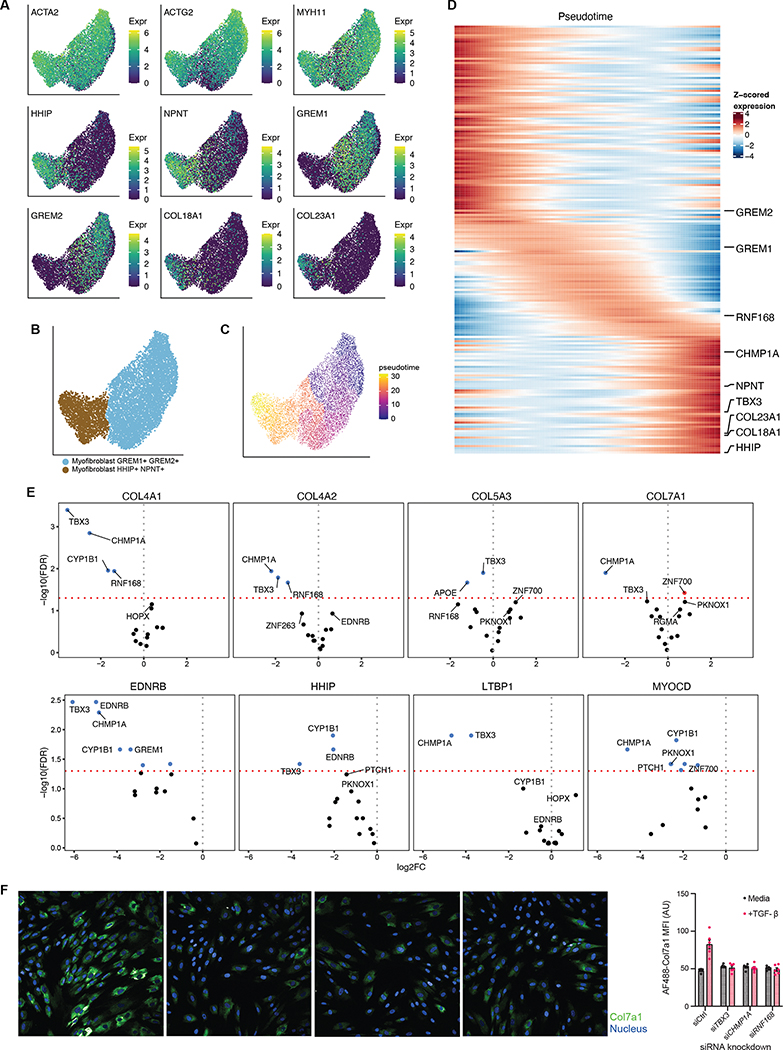
Crohn's disease (CD) is a chronic gastrointestinal disease that is increasing in prevalence worldwide. CD is multifactorial, involving the complex interplay of genetic, immune, and environmental factors, necessitating a system-level understanding of its etiology. To characterize cell-type-specific transcriptional heterogeneity in active CD, we profiled 720,633 cells from the terminal ileum and colon of 71 donors with varying inflammation status. Our integrated datasets revealed organ- and compartment-specific responses to acute and chronic inflammation; most immune changes were in cell composition, whereas transcriptional changes dominated among epithelial and stromal cells. These changes correlated with endoscopic inflammation, but small and large intestines exhibited distinct responses, which were particularly apparent when focusing on IBD risk genes. Finally, we mapped markers of disease-associated myofibroblast activation and identified CHMP1A, TBX3, and RNF168 as regulators of fibrotic complications. Altogether, our results provide a roadmap for understanding cell-type- and organ-specific differences in CD and potential directions for therapeutic development.

Keywords: Crohn's disease; IBD; high-dimensional profiling; inflammation; inflammatory bowel disease; myofibroblasts; single-cell RNA sequencing.


Conflict of interest statement

Declaration of interests R.J.X. is a co-founder of Celsius Therapeutics and Jnana Therapeutics.

Figures

Figure 1.
Figure 1.. Single-cell measurement of healthy, non-inflamed and inflamed terminal ileum (TI) and colon (CO), biopsies in Crohn’s Disease.
(A) Workflow of biopsy collection and scRNA-seq measurements. *Note that some patients contributed samples to multiple locations and/or inflammation statuses. (B-C) UMAP visualization of all cells in TI and CO, colored by cell type compartment (B) and detailed cell types within compartments (C). (D) Principal coordinates analysis (PCoA) of Bray-Curtis dissimilarities from sample-level cell type composition profiles. Top: Colored by layer information: E: epithelium, L: lamina propria, N: not separated. Middle: Colored by location. Bottom: Colored by disease status (Healthy, Non-inflamed or Inflamed). (E) Barplots show significant differences in cell type frequency for non-inflamed (blue) and inflamed (red) samples relative to healthy (green) samples in immune, stromal and epithelial compartments in TI (top-row) and CO (bottom-row). (*adjusted p<0.05, **adjusted p<0.01, red* = overrepresented in inflamed or non-inflamed samples vs. healthy, blue* = underrepresented). The total number of cells contributing to each bar is also shown. In TI, the sample size for Healthy/Non-inflamed/Inflamed was 13/49/16 for the stromal and immune compartments, and 11/45/14 for epithelial. In CO, these were 32/20/6 and 32/18/5 respectively.
Figure 2.
Figure 2.. Expression profiles across cell types of core IBD risk genes.
(A) Scaled mean expression (Methods) of 20 core IBD risk genes in both TI and colon. (B) Fraction of cells from healthy, non-inflamed, and inflamed samples expressing core IBD genes for cell types with at least 200 cells available. Each point represents the fractions of cells within a cell type expressing that particular gene. Gene-cell type pairs with a difference in fraction of genes expressing greater than 0.3 (dashed lines) are labeled. Note that for readability, cell types are summarized to their category, causing some gene labels to be repeated for each specific cell type. Individually differentially expressed gene-cell type pairs (FDR<0.05) are highlighted (red).
Figure 3.
Figure 3.. Location- and cell type-specific differential expression in active CD.
(A) Number of differentially-expressed genes between inflamed CD and healthy samples in TI, broken down by cell type (discrete component of a MAST model; FDR < 0.05). (B) Same as (A) but for colon. (C) Relationship between differential expression in TI and colon for each cell compartment. (D) Consistency score (Methods) of differential expression in inflammation for each common cell type between TI and CO. (E) Relationship between inflamed vs healthy and non-inflamed vs healthy samples in TI and colon within each cell compartment. (F) Fraction of cell types in which KEGG pathways are significantly enriched (FDR < 0.05; see Methods) within each compartment and location, split by enrichment direction (all pathway enrichment results in Table S5).
Figure 4.
Figure 4.. Enteroendocrine Cells (EEC) in TI.
(A) UMAP of 670 EECs in TI, colored by subset. (B) Donor and disease composition among EEC subsets. (C) Expression of markers for major EEC subsets.
Figure 5.
Figure 5.. Molecular regulators of myofibroblast activation in inflamed tissues.
(A) UMAP of the myofibroblast sub-groups in TI (HHIP+ NPNT+ and GREM1+ GREM2+), overlaid with expression of myofibroblast markers and sub-group markers. (B) Myofibroblast sub-groups clustered into two distinct clusters. (C) Pseudotime analysis of TI myofibroblasts. (D) Expression profiles of 200 selected genes with significant expression changes with respect to pseudotime (Methods). Highlighted genes include sub-group marker genes from (A) for the myofibroblast sub-groups, as well as significant genes in (E). Expression (TP10K) was first smoothed with a cubic spline and standardized to highlight expression differences (Methods). (E) Volcano plots for differential expression of four collagen genes and four HHIP+ NPNT+ marker genes in siRNA knockdown of select genes. Collagen genes were selected based on their expression in this population of cells (COL5A3 and COL7A1), and expression in myofibroblasts in literature. The top 5 genes by FDR are labeled. Dashed red line indicates FDR 0.05. (F) (Left) Fibroblasts were stained for COL7A1 expression (green) and counterstained with DAPI (blue) after knock-down of the indicated genes (left to right: control, TBX3, CHMP1A and RNF168). (Right) MFI of COL7A1 staining in the indicated cells with (pink) and without (gray) TGFβ treatment. Each dot represents the average of 30 images, n = 6 independent wells.

References

    1. Molodecky NA, Soon IS, Rabi DM, Ghali WA, Ferris M, Chernoff G, Benchimol EI, Panaccione R, Ghosh S, Barkema HW, et al. (2012). Increasing incidence and prevalence of the inflammatory bowel diseases with time, based on systematic review. Gastroenterology 142, 46–54.e42; quiz e30. - PubMed
    1. Ng SC, Shi HY, Hamidi N, Underwood FE, Tang W, Benchimol EI, Panaccione R, Ghosh S, Wu JCY, Chan FKL, et al. (2017). Worldwide incidence and prevalence of inflammatory bowel disease in the 21st century: a systematic review of population-based studies. Lancet 390, 2769–2778. - PubMed
    1. [No title] https://www.crohnscolitisfoundation.org/sites/default/files/2019-02/Upda....
    1. Khor B, Gardet A, and Xavier RJ (2011). Genetics and pathogenesis of inflammatory bowel disease. Nature 474, 307–317. - PMC - PubMed
    1. Mitsialis V, Wall S, Liu P, Ordovas-Montanes J, Parmet T, Vukovic M, Spencer D, Field M, McCourt C, Toothaker J, et al. (2020). Single-Cell Analyses of Colon and Blood Reveal Distinct Immune Cell Signatures of Ulcerative Colitis and Crohn’s Disease. Gastroenterology 159, 591–608.e10. - PMC - PubMed

Publication types

Substances