

Quantitative magnetic resonance imaging reflects different levels of histologically determined myelin densities in multiple sclerosis, including remyelination in inactive multiple sclerosis lesions
- PMID: 36720269
- PMCID: PMC10580011
- DOI: 10.1111/bpa.13150
Quantitative magnetic resonance imaging reflects different levels of histologically determined myelin densities in multiple sclerosis, including remyelination in inactive multiple sclerosis lesions
Abstract
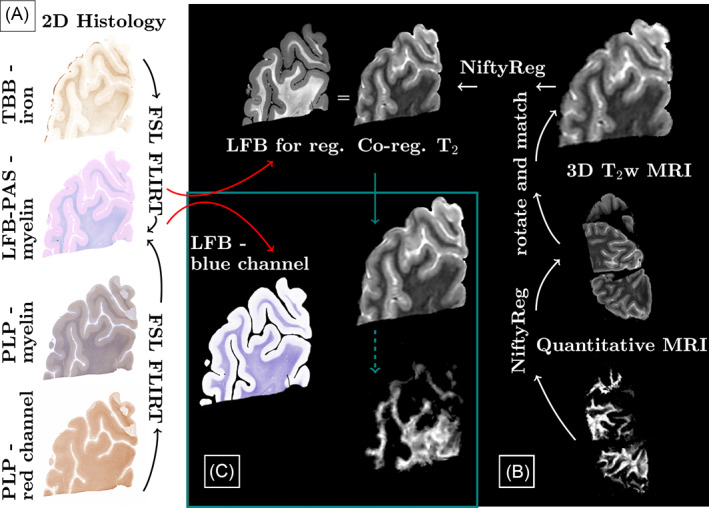
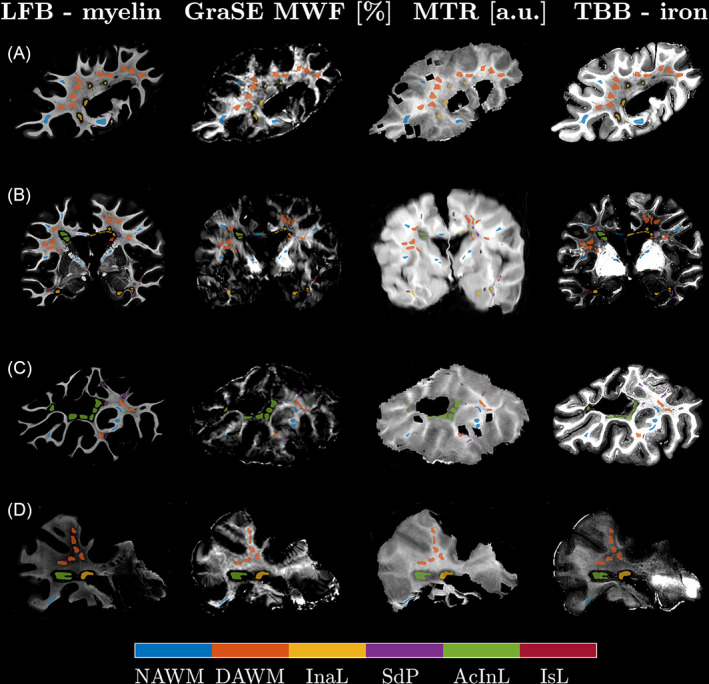
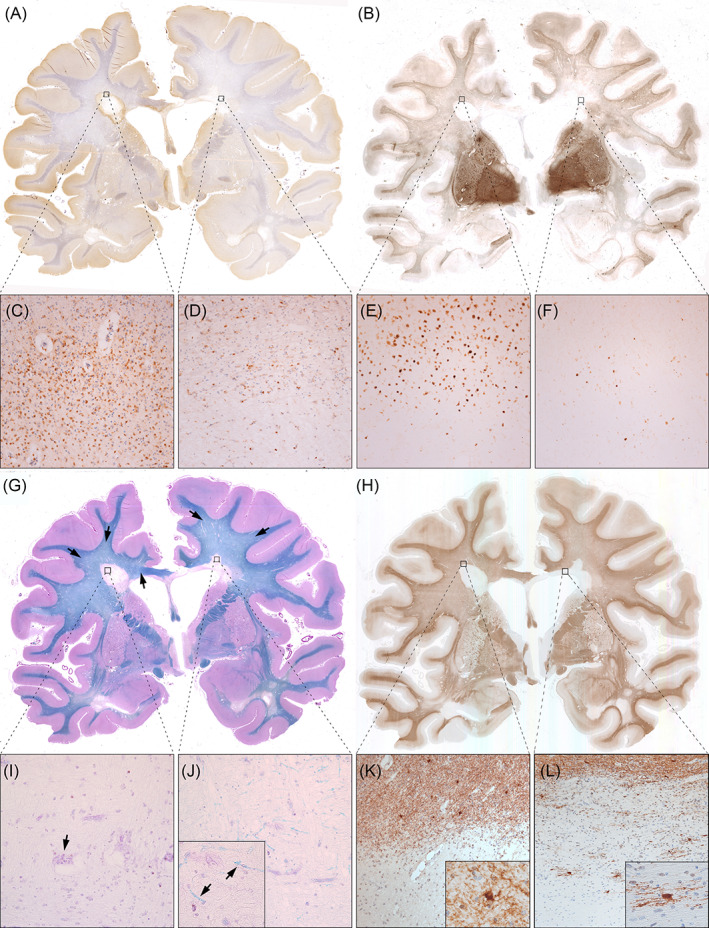
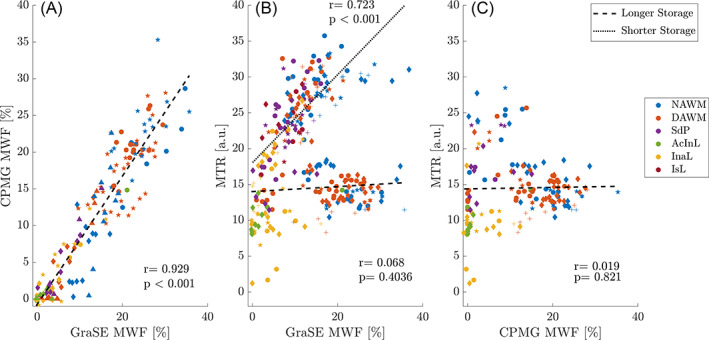
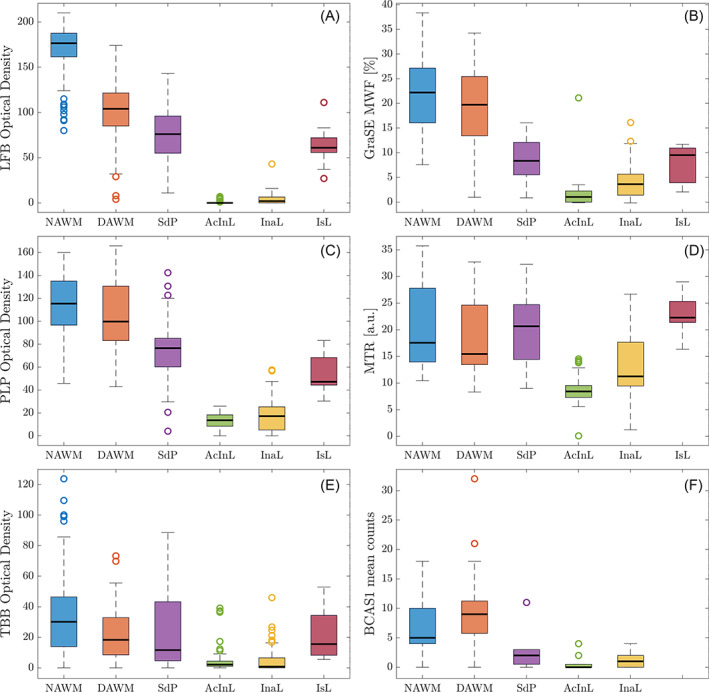
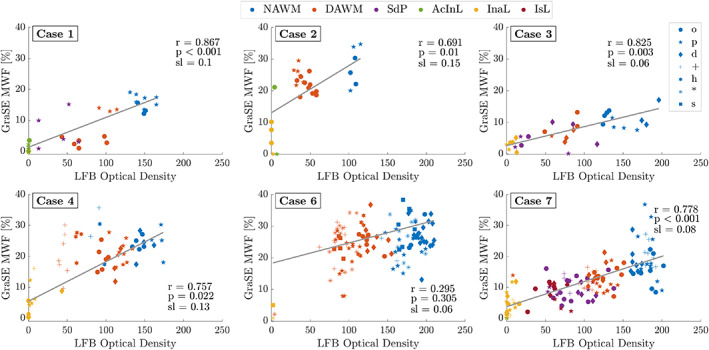
Magnetic resonance imaging (MRI) of focal or diffuse myelin damage or remyelination may provide important insights into disease progression and potential treatment efficacy in multiple sclerosis (MS). We performed post-mortem MRI and histopathological myelin measurements in seven progressive MS cases to evaluate the ability of three myelin-sensitive MRI scans to distinguish different stages of MS pathology, particularly chronic demyelinated and remyelinated lesions. At 3 Tesla, we acquired two different myelin water imaging (MWI) scans and magnetisation transfer ratio (MTR) data. Histopathology included histochemical stainings for myelin phospholipids (LFB) and iron as well as immunohistochemistry for myelin proteolipid protein (PLP), CD68 (phagocytosing microglia/macrophages) and BCAS1 (remyelinating oligodendrocytes). Mixed-effects modelling determined which histopathological metric best predicted MWF and MTR in normal-appearing and diffusely abnormal white matter, active/inactive, inactive, remyelinated and ischemic lesions. Both MWI measures correlated well with each other and histology across regions, reflecting the different stages of MS pathology. MTR data showed a considerable influence of components other than myelin and a strong dependency on tissue storage duration. Both MRI and histology revealed increased myelin densities in inactive compared with active/inactive lesions. Chronic inactive lesions harboured single scattered myelin fibres indicative of low-level remyelination. Mixed-effects modelling showed that smaller differences between white matter areas were linked to PLP densities and only to a small extent confounded by iron. MWI reflects differences in myelin lipids and proteins across various levels of myelin densities encountered in MS, including low-level remyelination in chronic inactive lesions.
Keywords: MRI; MTR; histopathology; iron; multiple sclerosis; remyelination.
© 2023 The Authors. Brain Pathology published by John Wiley & Sons Ltd on behalf of International Society of Neuropathology.
Conflict of interest statement
The authors have no conflicts to disclose related to the manuscript. Romana Höftberger has received speaker honoraria from Euroimmun, Novartis and Biogen.
Figures
Similar articles
-
Postmortem quantitative MRI disentangles histological lesion types in multiple sclerosis.Brain Pathol. 2023 Nov;33(6):e13136. doi: 10.1111/bpa.13136. Epub 2022 Dec 8. Brain Pathol. 2023. PMID: 36480267 Free PMC article.
-
Longitudinal evaluation of demyelinated lesions in a multiple sclerosis model using ultrashort echo time magnetization transfer (UTE-MT) imaging.Neuroimage. 2020 Mar;208:116415. doi: 10.1016/j.neuroimage.2019.116415. Epub 2019 Dec 4. Neuroimage. 2020. PMID: 31811900 Free PMC article.
-
Remyelinated lesions in multiple sclerosis: magnetic resonance image appearance.Arch Neurol. 2003 Aug;60(8):1073-81. doi: 10.1001/archneur.60.8.1073. Arch Neurol. 2003. PMID: 12925362
-
Mechanisms of myelin repair, MRI techniques and therapeutic opportunities in multiple sclerosis.Mult Scler Relat Disord. 2022 Feb;58:103407. doi: 10.1016/j.msard.2021.103407. Epub 2021 Nov 16. Mult Scler Relat Disord. 2022. PMID: 35216787 Review.
-
Using myelin water imaging to link underlying pathology to clinical function in multiple sclerosis: A scoping review.Mult Scler Relat Disord. 2022 Mar;59:103646. doi: 10.1016/j.msard.2022.103646. Epub 2022 Jan 30. Mult Scler Relat Disord. 2022. PMID: 35124302
Cited by
-
Remyelination in multiple sclerosis from the miRNA perspective.Front Mol Neurosci. 2023 Jun 1;16:1199313. doi: 10.3389/fnmol.2023.1199313. eCollection 2023. Front Mol Neurosci. 2023. PMID: 37333618 Free PMC article. Review.
-
The role of NLRP3 inflammasome in multiple sclerosis: pathogenesis and pharmacological application.Front Immunol. 2025 Apr 2;16:1572140. doi: 10.3389/fimmu.2025.1572140. eCollection 2025. Front Immunol. 2025. PMID: 40242770 Free PMC article. Review.
-
Testing the structural disconnection hypothesis: Myelin content correlates with memory in healthy aging.Neurobiol Aging. 2024 Sep;141:21-33. doi: 10.1016/j.neurobiolaging.2024.05.013. Epub 2024 May 23. Neurobiol Aging. 2024. PMID: 38810596
-
Recent developments in multiple sclerosis neuropathology.Curr Opin Neurol. 2025 Jun 1;38(3):173-179. doi: 10.1097/WCO.0000000000001370. Epub 2025 Apr 3. Curr Opin Neurol. 2025. PMID: 40178490 Free PMC article. Review.
-
Honing in on magnetic resonance imaging predictors of multiple sclerosis pathology.Brain Pathol. 2023 Nov;33(6):e13209. doi: 10.1111/bpa.13209. Epub 2023 Aug 30. Brain Pathol. 2023. PMID: 37646614 Free PMC article. No abstract available.
References
-
- Goldschmidt T, Antel J, König FB, Brück W, Kuhlmann T. Remyelination capacity of MS brain decreases with disease chronicity. Neurology. 2009;72(22):1914–21. - PubMed
-
- Patrikios P, Stadelmann C, Kutzelnigg A, Rauschka H, Schmidbauer M, Laursen H, et al. Remyelination is extensive in a subset of multiple sclerosis patients. Brain. 2006;129(12):3165–72. - PubMed
-
- Stankoff B, Jadasz JJ, Hartung HP, Küry P, Zalc B, Lubetzki C. Repair strategies for multiple sclerosis: challenges, achievements and perspectives. Curr Opin Neurol. 2016;29(3):286–92. - PubMed
-
- MacKay A, Whittall K, Adler J, Li D, et al. In vivo visualization of myelin water in brain by magnetic resonance. Magn Reson Med. 1994;31(6):673–7. - PubMed
Publication types
MeSH terms
Substances
Grants and funding
LinkOut - more resources
Full Text Sources
Medical
Research Materials
