. 2023 Mar:69:101683.
doi: 10.1016/j.molmet.2023.101683. Epub 2023 Jan 30.

Impairment of adrenergically-regulated thermogenesis in brown fat of obesity-resistant mice is compensated by non-shivering thermogenesis in skeletal muscle

Affiliations

Impairment of adrenergically-regulated thermogenesis in brown fat of obesity-resistant mice is compensated by non-shivering thermogenesis in skeletal muscle

Petra Janovska et al. Mol Metab. 2023 Mar.

Abstract

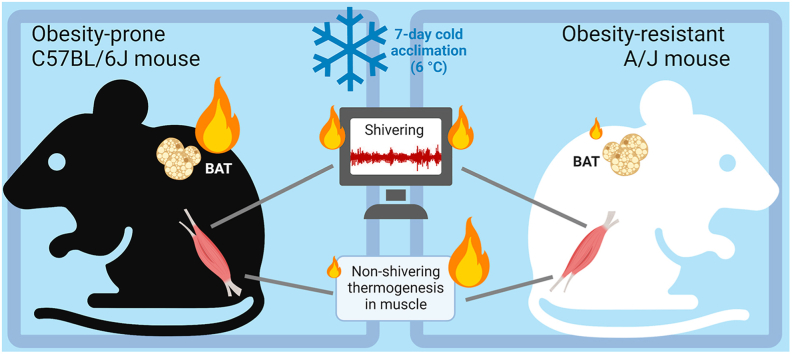
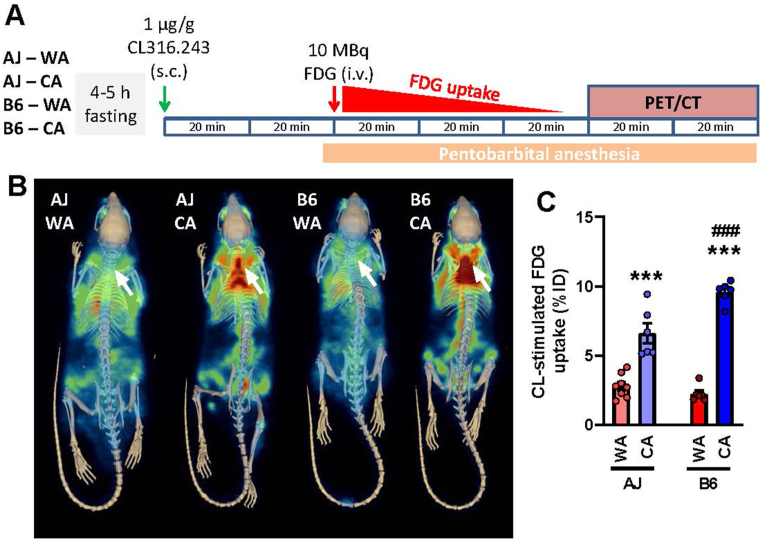
Objective: Non-shivering thermogenesis (NST) mediated by uncoupling protein 1 (UCP1) in brown adipose tissue (BAT) can be activated via the adrenergic system in response to cold or diet, contributing to both thermal and energy homeostasis. Other mechanisms, including metabolism of skeletal muscle, may also be involved in NST. However, relative contribution of these energy dissipating pathways and their adaptability remain a matter of long-standing controversy.

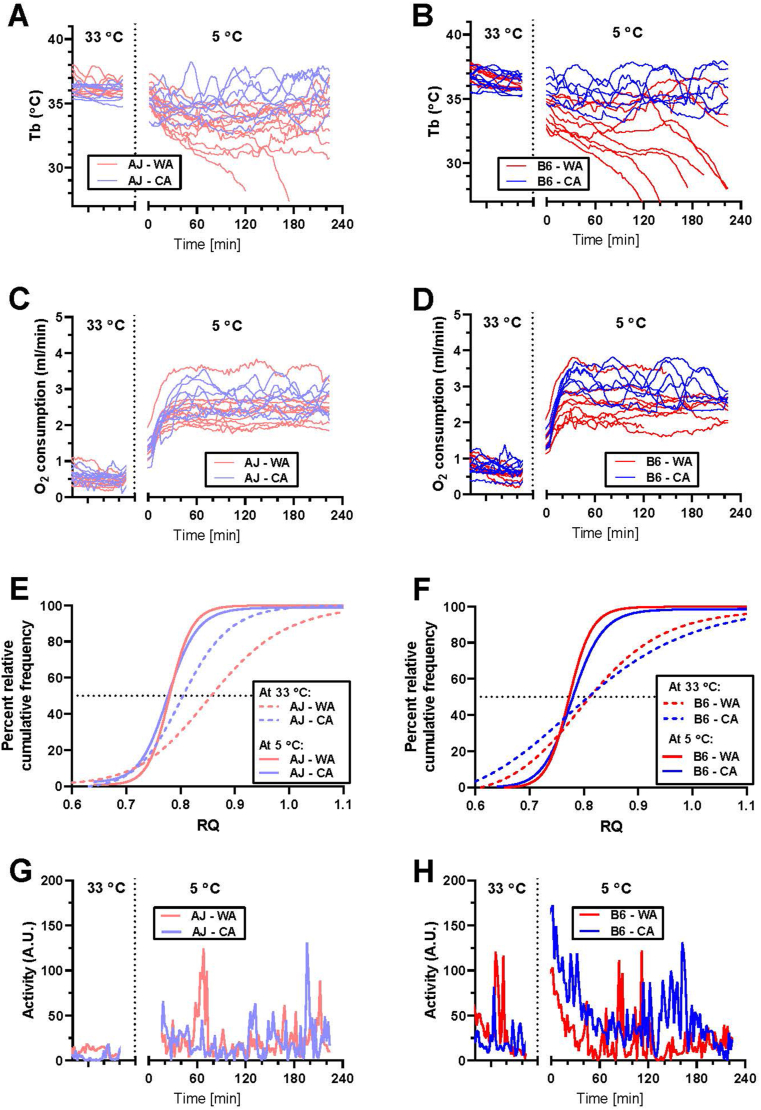
Methods: We used warm-acclimated (30 °C) mice to characterize the effect of an up to 7-day cold acclimation (6 °C; CA) on thermoregulatory thermogenesis, comparing inbred mice with a genetic background conferring resistance (A/J) or susceptibility (C57BL/6 J) to obesity.

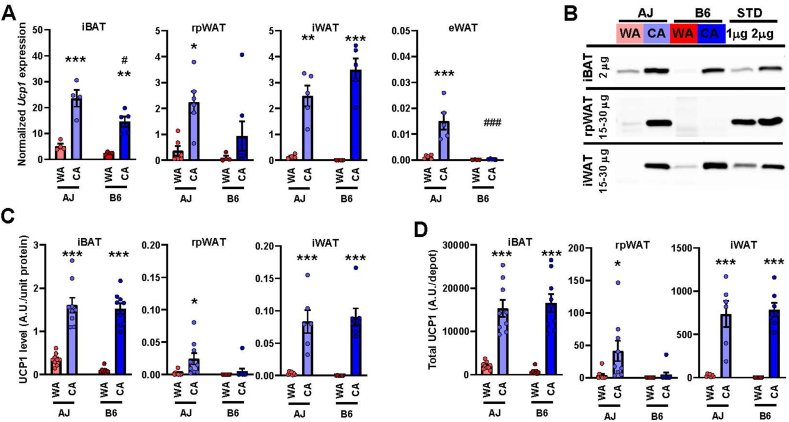
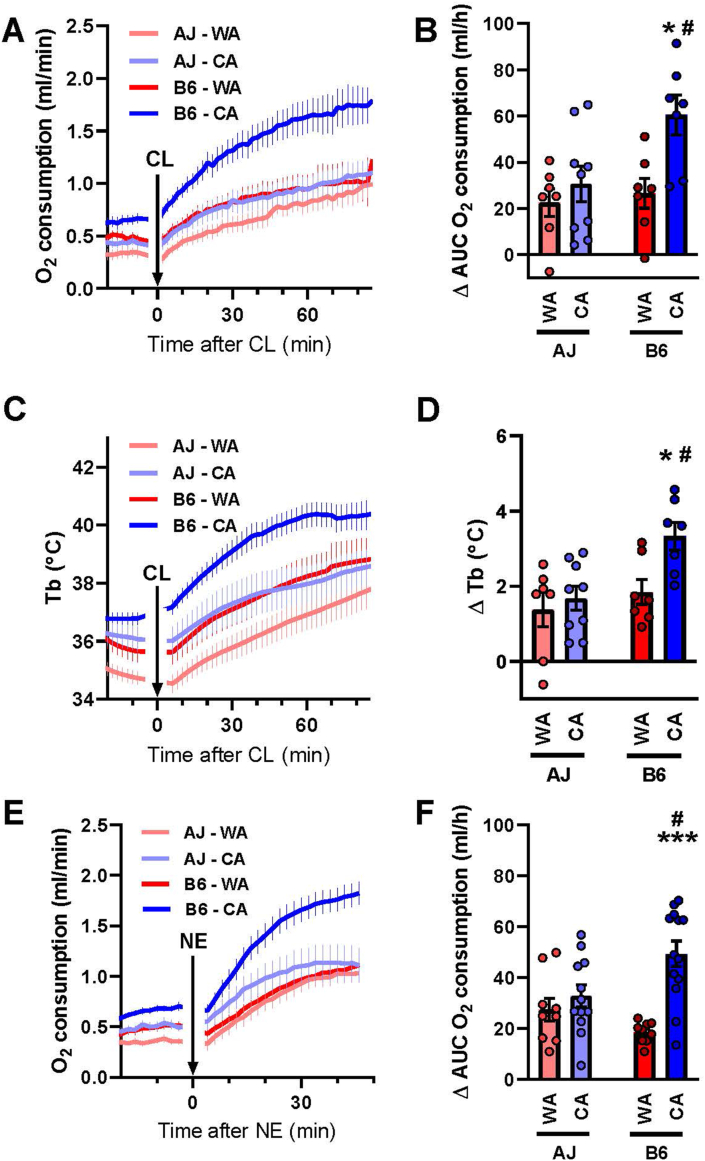
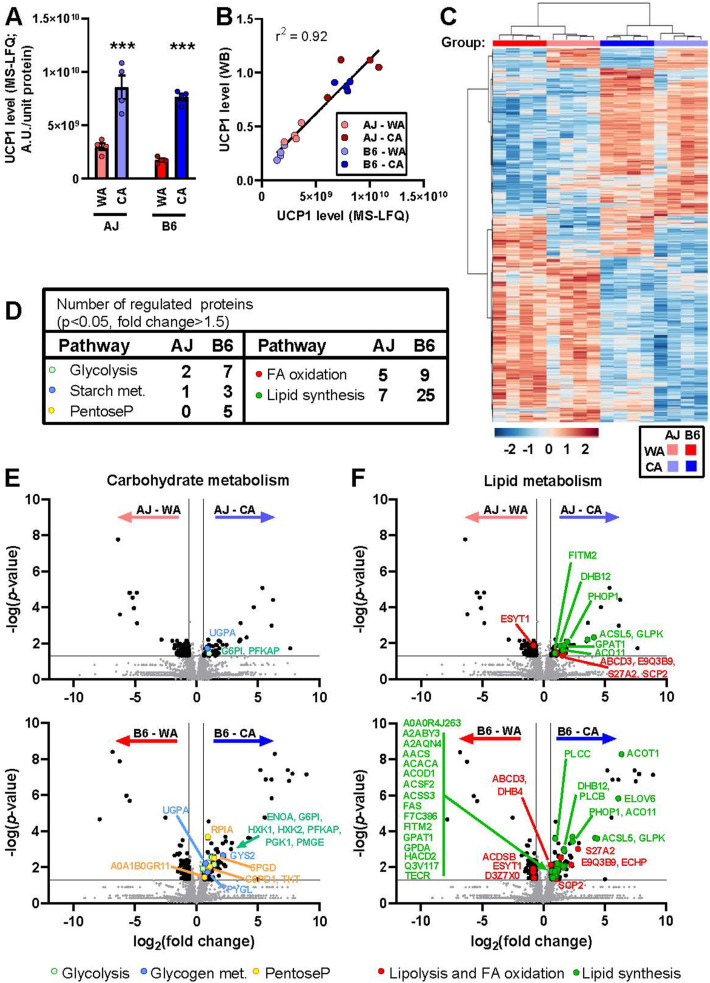
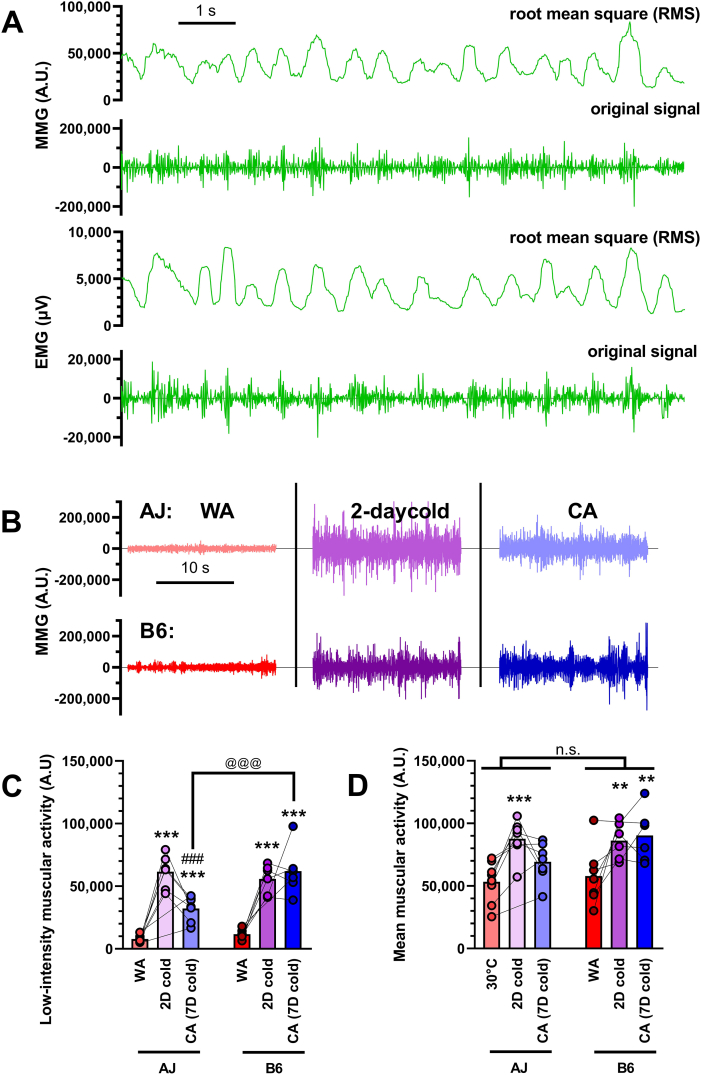
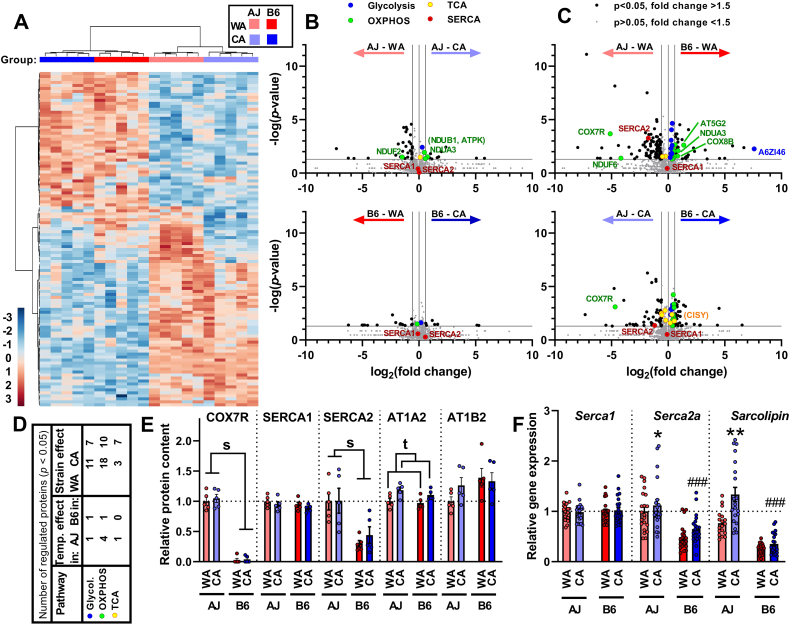
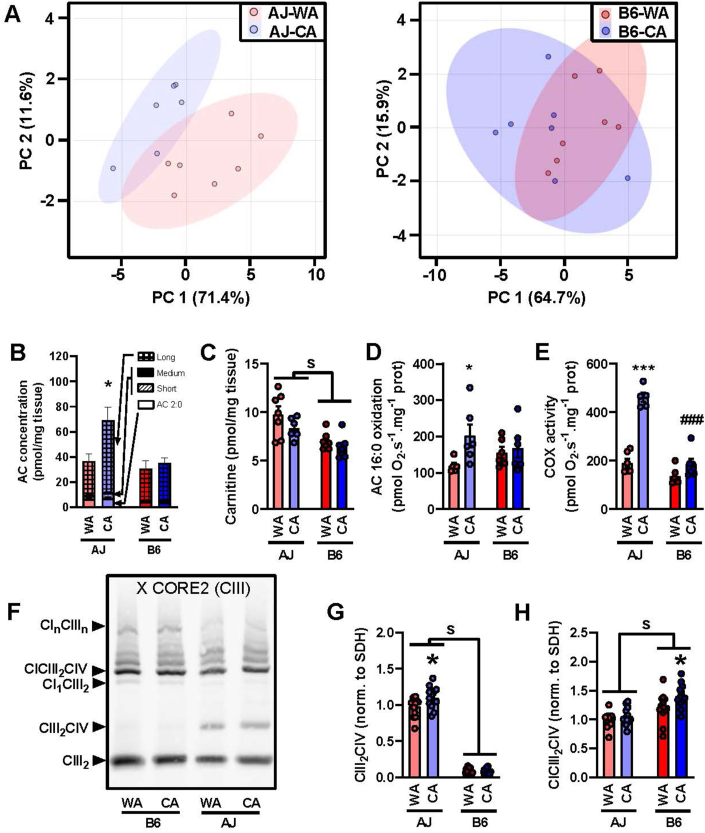
Results: Both warm-acclimated C57BL/6 J and A/J mice exhibited similar cold endurance, assessed as a capability to maintain core body temperature during acute exposure to cold, which improved in response to CA, resulting in comparable cold endurance and similar induction of UCP1 protein in BAT of mice of both genotypes. Despite this, adrenergic NST in BAT was induced only in C57BL/6 J, not in A/J mice subjected to CA. Cold tolerance phenotype of A/J mice subjected to CA was not based on increased shivering, improved insulation, or changes in physical activity. On the contrary, lipidomic, proteomic and gene expression analyses along with palmitoyl carnitine oxidation and cytochrome c oxidase activity revealed induction of lipid oxidation exclusively in skeletal muscle of A/J mice subjected to CA. These changes appear to be related to skeletal muscle NST, mediated by sarcolipin-induced uncoupling of sarco(endo)plasmic reticulum calcium ATPase pump activity and accentuated by changes in mitochondrial respiratory chain supercomplexes assembly.

Conclusions: Our results suggest that NST in skeletal muscle could be adaptively augmented in the face of insufficient adrenergic NST in BAT, depending on the genetic background of the mice. It may provide both protection from cold and resistance to obesity, more effectively than BAT.

Keywords: Brown adipose tissue; Mitochondrial supercomplex; Non-shivering thermogenesis; Obesity; Sarcolipin; Skeletal muscle.


Figures

Image 1
Graphical abstract
Figure 1
Figure 1
Lower cold endurance of B6 compared to AJ warm-acclimated mice and rescue of the endurance by CA. Whole-body measurements were performed using AJ and B6 mice acclimated to a thermoneutral housing temperature (30 °C; WA) or to cold (6 °C; CA), at 33 °C and 5 °C, respectively, using different groups of mice; for n in various groups, see legend to S2 Table. (A and B) Core body temperature (Tb) of AJ (A) and B6 mice (B) measured at 33 °C (left part of the graphs) or at 5 °C (right part of the graphs); data for individual mice are plotted (for mean curves, see S1A and S1B Fig). (C and D) Oxygen consumption of AJ (C) and B6 mice (D) measured at 33 °C (left part of the graphs) or at 5 °C (right part of the graphs); data for individual mice are plotted (for mean curves, see S1C and S1D Fig). (E and F) Percent relative cumulative frequency (PRCF) of respiratory quotient (RQ) of AJ (E) and B6 mice (F); the PRCF curves pooled from RQ values from all animals in a given group. (G and H) Physical activity of AJ (G) and B6 (H) mice; mean curves for whole experimental group are plotted. See S2 Table for the mean values of the measured parameter, and the number of the animals.
Figure 2
Figure 2
Higher expression and content of UCP1 in fat depots of AJ than B6 warm-acclimated mice and higher induction by CA in B6 mice. Analyses were performed using AJ and B6 mice acclimated to a thermoneutral temperature (30 °C; WA) or to cold (6 °C; CA). (A) Quantification of Ucp1 transcripts in various fat depots using qPCR (data were normalized to a geometric mean of 3 housekeeping genes, see Materials and Methods); n = 4–7. (BD) Quantification of UCP1 using Western blotting; n = 7–9; (B) representative blots (protein quantity of tissue homogenate analyzed is indicated); (C) specific content of UCP1 adjusted to protein of tissue homogenate); (D) total UCP1 protein per adipose tissue depot (calculated using the protein content of each fat depot; see S1 Table). iBAT, interscapular BAT; rpWAT, retroperitoneal WAT; iWAT, subcutaneous WAT from inquinal region; eWAT, epididymal WAT. Data are means ± SEM; ∗p < 0.05 and ∗∗∗p < 0.001 vs. the respective WA group; #p < 0.05 and ###p < 0.05 vs. the AJ mice (two-way ANOVA and Tukey's test). (A, C, D) Values for each data point can be found in S1 Data.
Figure 3
Figure 3
Lower adrenergic stimulation of metabolism in AJ compared to B6 mice. Thermoregulatory parameters of AJ and B6 mice acclimated to a thermoneutral temperature (30 °C; WA) or to cold (6 °C; CA) and measured in pentobarbital-anesthetized mice at 33 °C. (A) Oxygen consumption before and after injection of β3-adrenergic agonist CL316,243 (CL). (B) CL-stimulated oxygen consumption (corresponds to panel A); area under curve (AUC), of oxygen consumption during 60 min after CL injection with basal oxygen consumption (i.e. before the CL injection) subtracted (ΔAUC). (C) Core body temperature (Tb) before and after injection of CL (the same animals as in panel A). (D) CL-stimulated Tb (corresponds to panel C); mean Tb during 30–75 min after CL injection, with the average Tb during 30 min before the CL injection subtracted (ΔTb). (E) Oxygen consumption before and after injection of norepinephrine (NE). (F) NE-stimulated oxygen consumption (corresponds to panel E; calculated as in B). Separate groups of mice were used for (i) A-D, and (ii) E and F, respectively (n = 7–13). (A, C, E) Data are means ± SEM. (B, D, F). Columns and error bars represent means ± SEM; ∗p < 0.05 and ∗∗∗p < 0.001 vs. the respective WA group; #p < 0.05 vs. the AJ mice (two-way ANOVA and Tukey's multiple comparison test). (B, D, F) Values for each data point can be found in S1 Data.
Figure 4
Figure 4
CA results in higher induction of adrenergically-stimulated glucose uptake in iBAT of B6 compared with AJ mice. In situ glucose uptake in iBAT was evaluated using PET/CT imaging. Both AJ and B6 mice acclimated to a thermoneutral temperature (30 °C; WA) or to cold (6 °C; CA) were used (n = 6–8). (A) Scheme of the experiment: fasted mice were first injected with CL316,243 (CL), 40 min later (to allow enough time to reach the maximal response to CL) anesthetized by pentobarbital, placed on a heating pad, and injected with 18F-fluorodeoxyglucose (FDG). (B) Representative PET/CT scans showing FDG accumulation in tissues of the whole mice after stimulation with CL. Arrows indicate iBAT location. (C) Quantification of FDG uptake in iBAT; data are means ± SEM; ∗∗∗p < 0.001 vs. the WA mice; ###p < 0.001 vs. the AJ mice (two-way ANOVA and Tukey's multiple comparison test). (C) Values for each data point can be found in S1 Data.
Figure 5
Figure 5
Acclimation temperature dominates over the mouse strain in the effects on iBAT proteome. Analyses of iBAT proteome of AJ and B6 mice acclimated to a thermoneutral temperature (30 °C; WA) or to cold (6 °C; CA) was performed using mass-spectrometry label-free quantification (MS-LFQ; n = 4). (A) Specific UCP1 content in iBAT homogenate; data are means ± SEM; ∗∗∗p < 0.001 vs. the WA mice (two-way ANOVA and Tukey's multiple comparison test). (B) Comparison of UCP1 quantification using MS-LFQ and Western blotting (WB); analysis performed as in Figure 2B. (C) Hierarchical clustering of proteins based on MS-LFQ intensity. Each column represents an individual animal (experimental group is indicated by colour code above the column), each row represents an individual protein. Only proteins differing significantly among the experimental groups (one-way ANOVA) were considered (i.e. 570 out of 3501 proteins detected). Both mice and proteins were automatically clustered using MetaboAnalyst (v 4.0 and 5.0) software [70] as indicated by dendrograms above and left of the plot. For the list of proteins, see S2 Data (sheet “BAT_ANOVA”). Hue represents the autoscaled t-test/ANOVA score. (D, E, F) Effect of temperature on the abundance of individual proteins in AJ and B6 mice. Total number of proteins/enzymes of selected metabolic pathways affected by cold in AJ and B6 mice (D). Volcano plots showing effects of temperature on proteins involved in glucose (E) and lipid metabolism (F). For the background data see S2 Data). For the effect of the strain on the above proteins, see S3 Fig. For the Volcano plot analysis of the quantitative composition of protein subunits of mitochondrial oxidative phosphorylation system, see S4 Fig. Volcano plots to demonstrate the difference in quantitative proteome composition between the WA- and the CA-mice, based on all 3501 proteins detected; S2 and S3 Data); plotted separately for AJ and B6 mice (upper and lower panels, respectively). Significantly regulated proteins (i.e. p-value <0.05; fold change >1.5) were (i) indicated by black dots (in AJ-WA vs. AJ-CA comparison: 48 proteins upregulated by CA and 85 proteins downregulated by CA; in B6-WA vs. B6-CA comparison: 140 proteins upregulated by CA and 93 proteins downregulated by CA; see S3 Data); (ii) ascribed to major metabolic pathways using KEGG database (see S3 Data); and (iii) color-coded according their involvement in carbohydrate (E) or lipid (F) metabolism. For the protein codes, see the entry name of UniProt database (used here without the name of the organism, e.g. UCP1 is originally UCP1_MOUSE; see S3 Data). (A, B) Values for each data point can be found in S1 Data.
Figure 6
Figure 6
Muscular activity (shivering) shows no major difference between strains. EMG and MMG measurement of muscular activity were performed on AJ and B6 mice adapted to thermoneutral temperature (30 °C; WA) and consecutively exposed to cold (6 °C) for 2 and 7 days (CA) (n = 5–8). (A) Comparison of EMG and MMG signals from mice exposed acutely to cold showing both raw data and root mean square of these data. (B) Representative MMG measurement showing 20 s of low-intensity signal (i.e. without occurrence of physical activity) in each of the experimental conditions. (C) Quantification of low-intensity muscular activity (i.e. 15s-long signal out of 4 min MMG record with minimal or no physical activity). (D) Mean total muscular activity (i.e. including also muscle work). (CD) ∗∗p < 0.01, ∗∗∗p < 0.001 vs. the respective WA group, ###p < 0.001 vs. the respective group after 2 days in cold (repeated measures mixed effect model (REML) and Tukey's multiple comparison test); @@@ p < 0.001 between the indicated groups (Sidak's multiple comparison test). Values for each data point can be found in S1 Data.
Figure 7
Figure 7
Acclimation temperature exerts a weaker effect compared with the mouse strain on skeletal muscle proteome. Analyses of gastrocnemius muscle proteome of AJ and B6 mice acclimated to a thermoneutral temperature (30 °C; WA) or to cold (6 °C; CA) was performed using mass-spectrometry label-free quantification (MS-LFQ; n = 4). (A) Hierarchical clustering of proteins based on MS-LFQ intensity. Each column represents an individual animal (experimental group is indicated by color code above the column), each row represents an individual protein. Only proteins differing significantly among the experimental groups (one-way ANOVA) were considered (i.e. 112 out of 1781 proteins detected in total). Both proteins and mice were automatically clustered using MetaboAnalyst (v 4.0 and 5.0) software [70] as indicated by dendrograms above and left of the plot. For the list of proteins, see S2 Data (sheet “GASTRO_ANOVA”). Hue represents the autoscaled t-test/ANOVA score. (B, C, D) Differences in proteome among the experimental groups. Volcano plots to demonstrate the difference in quantitative proteome composition between the WA- and the CA-mice (B) and between the AJ and B6 mice (C), based on all 1771 proteins detected; S2 and S3 Data). Significantly regulated proteins (i.e. raw p-value <0.05; fold change >1.5) were (i) indicated by black dots (in AJ-WA vs. AJ-CA comparison: 12 proteins upregulated by CA and 32 proteins downregulated by CA; in B6-WA vs. B6-CA comparison: 8 proteins upregulated by CA and 17 proteins downregulated by CA; in AJ-WA vs. B6-WA comparison: 100 proteins upregulated in AJ and 39 proteins upregulated in B6; in AJ-CA vs. B6-CA comparison: 56 proteins upregulated in AJ and 30 proteins upregulated in B6 see S3 Data); (ii) ascribed to major metabolic pathways using KEGG database (see S3 Data). The selected proteins are labelled by protein codes (for the protein codes, see the entry name of UniProt database - used here without the name of the organism, e.g. COX7R is originally COX7R_MOUSE; see S3 Data). Significantly regulated proteins mentioned in text but with fold change <1.5 are labelled by code in parentheses.). (D) Number of differentially regulated proteins/enzymes engaged in selected metabolic pathways (see B and C) in mice of both strains (see S3 Data). (E) Levels of selected proteins (see B and C and S3 Data; n = 4). (F) Expression of selected genes (measured using qPCR; data were normalized to a geometric mean of 2 housekeeping genes, see Materials and Methods). Data combined from 3 independent experiments; n = 18–21; data are means ± SEM; ∗p < 0.05 and ∗∗p < 0.01 vs. the WA mice; ###p < 0.001 vs. the AJ mice (two-way ANOVA and Tukey's multiple comparison test). (E, F) Values for each data point can be found in S1 Data.
Figure 8
Figure 8
CA results in higher induction of lipid catabolim and formation of Q-respirasome in skeletal muscle of AJ compared with B6 mice. Measurements in gastrocnemius muscle extracts (AC) and homogenates (DH) prepared from AJ and B6 mice acclimated to a thermoneutral temperature (30 °C; WA) or to cold (6 °C; CA). (A) Principal component analysis of all acylcarnitine species in gastrocnemius muscle. (B) Cumulative concentrations of acylcarnitine (AC) species, which significantly differ in their abundances among the groups: acetylcarnitine (2:0), short-chain AC (3–7 carbons), medium-chain AC (8–15 carbons, very low abundances), long-chain AC (16 and more carbons) statistics performed on sum of all AC. (C) Concentration of carnitine (n = 6–7). (D) Oxidation of palmitoyl carnitine (n = 5–6). (E) Activity of COX (n = 5–6). (FH) OXPHOS supercomplexes in digitonin solubilisates of gastrocnemius muscle analysed by blue native electrophoresis (n = 13–14; 7 mice in 2 technical replicates). Representative blot (F) and quantification of CIII2CIV (G) and CICIII2CIV (H). Data are means ± SEM; s indicates p < 0.05 effect of strain (two-way ANOVA); ∗p < 0.05 and ∗∗∗p < 0.001 vs. the WA mice, #p < 0.05 and ###p < 0.001 vs. the AJ mice (Tukey's multiple comparison test). For the source data in A, see S4 Data; for the source data in B and C, see S3 Table. (BH) Values for each data point can be found in S1 Data.

Similar articles

Cited by

References

    1. Cannon B., Nedergaard J. Brown adipose tissue: function and physiological significance. Physiol Rev. 2004;84(1):277–359. - PubMed
    1. Rohm M., Zeigerer A., Machado J., Herzig S. Energy metabolism in cachexia. EMBO Rep. 2019;20(4) - PMC - PubMed
    1. Jansky I. Humoral thermogenesis and its role in maintaining energy balance. Physiol Rev. 1995;75(2):237–259. - PubMed
    1. Silva J.E. Thermogenic mechanisms and their hormonal regulation. Physiol Rev. 2006;86(2):435–464. - PubMed
    1. Flachs P., Rossmeisl M., Kuda O., Kopecky J. Stimulation of mitochondrial oxidative capacity in white fat independent of UCP1: a key to lean phenotype. Biochim Biophys Acta. 2013;1831(5):986–1003. - PubMed

Publication types

Substances