

Low L3 skeletal muscle index associated with the clinicopathological characteristics and prognosis of ovarian cancer: a meta-analysis
- PMID: 36720459
- PMCID: PMC10067470
- DOI: 10.1002/jcsm.13175
Low L3 skeletal muscle index associated with the clinicopathological characteristics and prognosis of ovarian cancer: a meta-analysis
Abstract
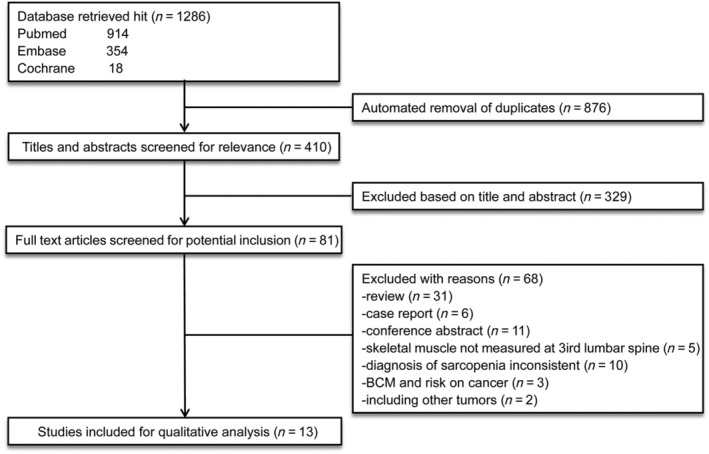
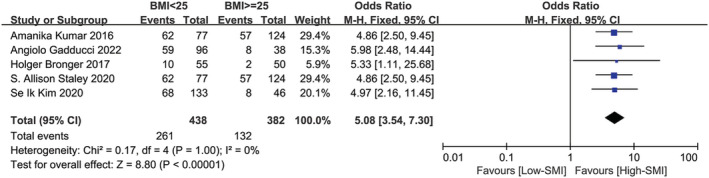
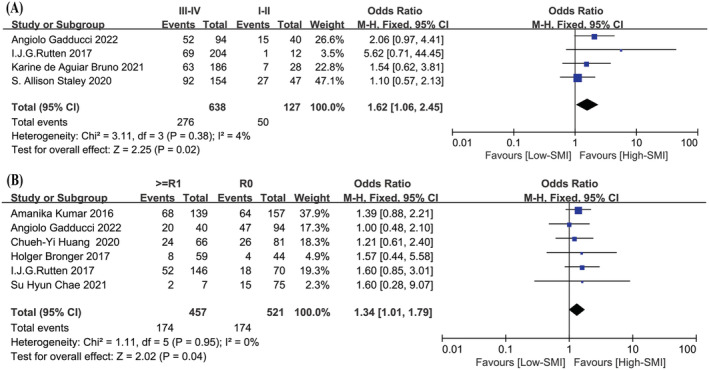
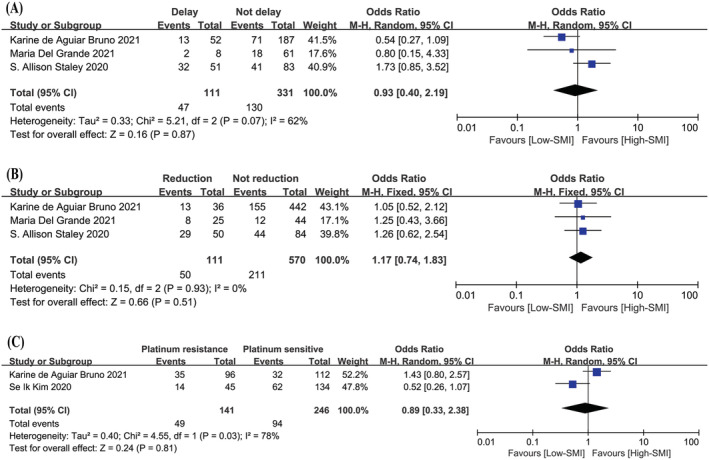
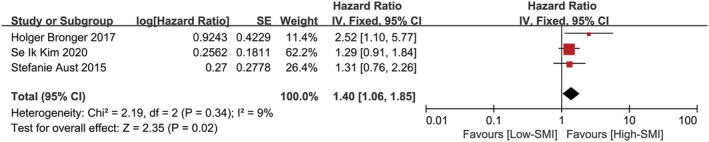
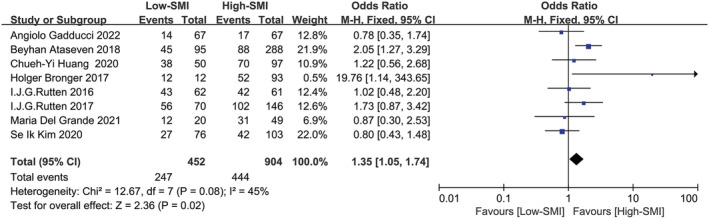
Sarcopenia is a syndrome characterized by progressive loss of skeletal muscle mass, strength and function, which is one of the most important clinical features of cancer malnutrition, representing a poor prognostic indicator in oncology. Sarcopenia is commonly assessed by measuring the skeletal muscle index (SMI) of the third lumbar spine (L3) using computed tomography (CT). The primary aim of this meta-analysis was to study the association between low SMI and comprehensive clinicopathological characteristics as well as prognosis in patients with ovarian cancer. Data were searched in PubMed, EMBASE and Cochrane databases from inception to 10 June 2022. Studies evaluating the prognostic effect of SMI on ovarian cancer survival or chemotherapy-related side effects were included. The risk of bias and study quality were assessed via the Newcastle-Ottawa Scale (NOS). The search strategy yielded 1286 hits in all three databases combined. Thirteen studies were included for qualitative and quantitative analysis, comprising 1814 patients. Our meta-analysis revealed the significant association between low SMI and progression-free survival (PFS) [P = 0.02; hazard ratio (HR): 1.40, 95% confidence interval (CI): 1.06-1.85], as well as 5-year overall survival (OS) [P = 0.02; odds ratio (OR): 1.35, 95% CI: 1.05-1.74]. Low SMI was also obviously associated with body mass index (BMI) < 25 (P < 0.00001; OR: 5.08, 95% CI: 3.54-7.30), FIGO stage (P = 0.02; OR: 1.62, 95% CI: 1.06-2.45) and R0 cytoreduction (P = 0.04;OR: 1.34, 95% CI: 1.01-1.79). There was no correlation between low SMI and histological types, pathological grades and chemotherapy-related toxicity. The quality of the evidence was relatively high according to NOS. Our meta-analysis indicated that sarcopenia assessed by SMI was associated with poor clinical characteristics and adverse prognosis in patients with ovarian cancer. Consensus should be reached on standardized cut-off values for defining sarcopenia in patients with ovarian cancer.
Keywords: clinical characteristic; meta-analysis; ovarian cancer; prognosis; skeletal muscle index.
© 2023 The Authors. Journal of Cachexia, Sarcopenia and Muscle published by John Wiley & Sons Ltd on behalf of Society on Sarcopenia, Cachexia and Wasting Disorders.
Conflict of interest statement
The authors declare that they have no conflicts of interest relevant to the content of this review. The authors of this manuscript certify that they comply with the ethical guidelines for authorship and publishing in the
Figures
References
-
- Huang CY, Sun FJ, Lee J. Prognostic value of muscle measurement using the standardized phase of computed tomography in patients with advanced ovarian cancer. Nutrition 2020;72:110642. - PubMed
-
- Shachar SS, Williams GR, Muss HB, Nishijima TF. Prognostic value of sarcopenia in adults with solid tumours: a meta‐analysis and systematic review. Eur J Cancer 2016;57:58–67. - PubMed
-
- Pamoukdjian F, Bouillet T, Levy V, Soussan M, Zelek L, Paillaud E. Prevalence and predictive value of pre‐therapeutic sarcopenia in cancer patients: a systematic review. Clin Nutr 2018;37:1101–1113. - PubMed
Publication types
MeSH terms
Grants and funding
LinkOut - more resources
Full Text Sources
Medical
