. 2023 Feb 13;9(2):1020-1029.
doi: 10.1021/acsbiomaterials.2c01147. Epub 2023 Jan 31.

High-Performance Implantable Sensors based on Anisotropic Magnetoresistive La0.67Sr0.33MnO3 for Biomedical Applications

Affiliations

High-Performance Implantable Sensors based on Anisotropic Magnetoresistive La0.67Sr0.33MnO3 for Biomedical Applications

Arturo Vera et al. ACS Biomater Sci Eng. .

Abstract

We present the design, fabrication, and characterization of an implantable neural interface based on anisotropic magnetoresistive (AMR) magnetic-field sensors that combine reduced size and high performance at body temperature. The sensors are based on La0.67Sr0.33MnO3 (LSMO) as a ferromagnetic material, whose epitaxial growth has been suitably engineered to get uniaxial anisotropy and large AMR output together with low noise even at low frequencies. The performance of LSMO sensors of different film thickness and at different temperatures close to 37 °C has to be explored to find an optimum sensitivity of ∼400%/T (with typical detectivity values of 2 nT·Hz-1/2 at a frequency of 1 Hz and 0.3 nT·Hz-1/2 at 1 kHz), fitted for the detection of low magnetic signals coming from neural activity. Biocompatibility tests of devices consisting of submillimeter-size LSMO sensors coated by a thin poly(dimethyl siloxane) polymeric layer, both in vitro and in vivo, support their high suitability as implantable detectors of low-frequency biological magnetic signals emerging from heterogeneous electrically active tissues.

Keywords: anisotropic magnetoresistance; detectivity measurements; in vitro and in vivo biocompatibility; magnetic sensors; neural interfaces; thin film oxide.


Conflict of interest statement

The authors declare no competing financial interest.

Figures
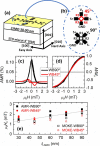
Figure 1
Figure 1
WB sensor configurations and representative transport and magnetic characterization. (a) Typical sample of LSMO film sensors studied, grown onto a STO [001] surface with a miscut angle [010] of 4°. (b) Schematics of WB-45° and WB-90° configurations. The orientation of the WB is fixed by the anisotropy axis of the LSMO thin film. (c) AMR and (d) MOKE hysteresis loops of a 30 nm thick LSMO film with the indicated WB configurations acquired at room temperature and with the field applied parallel to the hard axis. Note the great difference between the AMR hysteresis loops, originated from the independent direction of magnetization rotation which reduces the 45° WB AMR ratio, while the MOKE hysteresis confirms that it is the same sample. (e) Thickness-dependent saturation field (anisotropy field) derived from AMR and MOKE measurements. As expected, the anisotropy field increases slightly with the thickness. A linear fit to the data (gray line) shows an increase of the anisotropy field with a thickness of 0.016 mT/nm.
Figure 2
Figure 2
Thickness-dependent sensor characterization using (a,c) WB-45° and (b,d) WB-90° configurations. Both sensitivity (top) and AMR (bottom) values are derived from magneto-transport measurements performed at the best temperature performance of the sensor.
Figure 3
Figure 3
Searching the best temperature sensor performance. (a,b) Variation of the maximum sensitivity and AMR with temperature, respectively, for a WB-90° and 30 nm thick sensor. Note that both maximum sensitivity and AMR vanish approaching Tc (dark shadowed area) and that the temperature of maximum sensitivity is 41 °C (yellow), at which the maximum AMR still shows a relevant value. (c,d) Examples of the variation of the sensitivity and AMR (in absolute value), respectively, of the sensor with the applied magnetic field along the hard axis for 41 °C. Black (blue) points correspond to the values obtained when going from negative (positive) to positive (negative) H values as indicated by the arrows. Values in (a,b) are extracted from curves as those in (c,d).
Figure 4
Figure 4
Sensor detectivity performance as a function of frequency at different Vb for a 30 nm thick WB-90° LSMO sensor (at 41 °C). The results are comparable to those of commercial sensor HMC1001 also shown in the figure (Vb = 5.5 V), which is engineered with flux concentrators, unlike the simple LSMO sensors presented here. Inset: evolution of the detectivity as a function of Vb for frequencies of 1, 10, 100, and 1000 Hz. Notice that the detectivity does not improve with Vb at low frequencies (where the 1/f dominates), whereas at higher frequencies where the thermal noise dominates, the detectivity can be reduced increasing Vb. Remarkably, the detectivity value is 2–3 nT·Hz–1/2 at low frequency (1 Hz), 1 nT·Hz–1/2 at 10 Hz and reaching 0.3 nT·Hz–1/2 at 100 Hz.
Figure 5
Figure 5
In vitro biocompatibility tests of PDMS-coated LSMO sensors with 1-month organotypic spinal cultures. (a) Top, the full PDMS wafer containing the LSMO sensor is shown. Scale bar = 8 mm. The substrate was pasted on top of a glass coverslip to facilitate its handling and culturing. Bottom, a bright-field top view image of the sensor circuitry embedded in the PDMS is also provided. Scale bar = 500 μm. (b) Representative confocal reconstructions show, respectively, a portion of LSMO sensor circuitry to which the spinal cord slice was interfaced (top); the entire organotypic slice (middle) stained with anti-β-tubulin III (red) and SMI-32 anti-neurofilament-H (green) and DAPI (blue); merged image (bottom). Scale bars = 800 μm. (c) Top inset, snapshot at 40× magnification of a spinal cord culture loaded with Fluo4-AM. Scale bar = 50 μm. Two representative traces of calcium transients are shown depicting basal spontaneous activity (top) and bicuculline-strychnine activity (middle) and TTX effects (bottom). Calcium transients are expressed as fractional amplitude increase (ΔF/F0).
Figure 6
Figure 6
In vivo biocompatibility tests of PDMS-encapsulated LSMO sensors in subcutaneous pockets in a rat model. (a) Lateral and top view of a LSMO encapsulated sensor before implantation. (b) Gross view of the wound healing process at the site of implantation at different time points. The red arrows indicate the location of the sensor under the skin. (c) Representative images of the sensor and the PDMS control at the explantation time (8 weeks). Blue arrows point the implant encapsulated in the subcutaneous connective tissue.

References

    1. Dagotto E. Open questions in CMR manganites, relevance of clustered states and analogies with other compounds including the cuprates. New J. Phys. 2005, 7, 67.10.1088/1367-2630/7/1/067. - DOI
    1. Han S. J.; Xu L.; Yu H.; Wilson R. J.; White R. L.; Pourmand N.; Wang S. X.. CMOS Integrated DNA Microarray Based on GMR Sensors International Electron Device Meeting San Francisco, CA, USA, 2006, pp. 1-4, 10.1109/IEDM.2006.346887. - DOI
    1. Mao S.; ChenLiu Y. F.; Chen X.; Xu B.; Lu P.; Patwari M.; Xi H.; Chang C.; Miller B.; Menard D.; Pant B.; Loven J.; Duxstad K.; Li S.; Zhang Z.; Johnston A.; Lamberton R.; Gubbins M.; McLauguin T.; Gadbois J.; Ding J.; Cross B.; Xue S.; Ryan P. IEEE Trans. Magn. 2006, 42, 97–102. 10.1109/tmag.2005.863772. - DOI
    1. Siwach P. W.; Singh H. K.; Srivastava O. N. Low field magnetotransport in manganites. J. Phys.: Condens. Matter 2008, 20, 273201.10.1088/0953-8984/20/27/273201. - DOI - PubMed
    1. Stutzke N. A.; Russek S. E.; Pappas D. P.; Tondra M. Low-frequency noise measurements on commercial magnetoresistive magnetic field sensors. J. Appl. Phys. 2005, 97, 10Q107.10.1063/1.1861375. - DOI

Publication types