. 2023 Jan 31;6(4):e202201877.
doi: 10.26508/lsa.202201877. Print 2023 Apr.

The ribose methylation enzyme FTSJ1 has a conserved role in neuron morphology and learning performance

Affiliations

The ribose methylation enzyme FTSJ1 has a conserved role in neuron morphology and learning performance

Mira Brazane et al. Life Sci Alliance. .

Abstract

FTSJ1 is a conserved human 2'-O-methyltransferase (Nm-MTase) that modifies several tRNAs at position 32 and the wobble position 34 in the anticodon loop. Its loss of function has been linked to X-linked intellectual disability (XLID), and more recently to cancers. However, the molecular mechanisms underlying these pathologies are currently unclear. Here, we report a novel FTSJ1 pathogenic variant from an X-linked intellectual disability patient. Using blood cells derived from this patient and other affected individuals carrying FTSJ1 mutations, we performed an unbiased and comprehensive RiboMethSeq analysis to map the ribose methylation on all human tRNAs and identify novel targets. In addition, we performed a transcriptome analysis in these cells and found that several genes previously associated with intellectual disability and cancers were deregulated. We also found changes in the miRNA population that suggest potential cross-regulation of some miRNAs with these key mRNA targets. Finally, we show that differentiation of FTSJ1-depleted human neural progenitor cells into neurons displays long and thin spine neurites compared with control cells. These defects are also observed in Drosophila and are associated with long-term memory deficits. Altogether, our study adds insight into FTSJ1 pathologies in humans and flies by the identification of novel FTSJ1 targets and the defect in neuron morphology.


Conflict of interest statement

The authors declare that they have no conflict of interest.

Figures
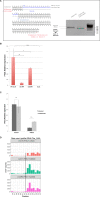
Figure S1.
Figure S1.
(A) Characterization of the FTSJ1 transcript variant MM. FTSJ1 transcripts were amplified from total RNA by RT–PCR of a control (LCL25) and the affected individual LCL MM harbouring a splice site mutation predicted to cause the skipping of exon 6 (see the Materials and Methods section). PCR products were run in 1% agarose gel + 0.5X TAE buffer. Predictably, a size shift is observed between the amplified products in the control as compared to the MM variant (right panel). Sanger sequencing confirmed skipping of the entire exon 6, thus disrupting the reading frame and appearance of a premature termination codon in exon 8 (left panel, see detail in the Materials and Methods section). (B) FTSJ1 mRNA relative abundance in patient LCLs. FTSJ1 mRNA is significantly reduced in LCL MM compared with a control LCL. Relative abundance of mRNA is quantified by qRT–PCR on total RNAs from each indicated cell line. Ratios are expressed in fold change of starting quantities of FTSJ1/GAPDH. Error bars represent the SD between four independent biological samples. P-values are indicated with stars, *P = 0.04; **P = 0.006; and ***P = 0.0008 (paired t test). (C) FTSJ1 mRNA targeted for degradation by nonsense-mediated mRNA decay (NMD) in LCL-MM. FTSJ1 mRNA is significantly down-regulated in affected patient cells (LCL-MM) when compared to control cells (LCL-25) ((B) above). Inhibition of translation by treatment of LCLs with 100 μg ml–1 cycloheximide rescued FTSJ1 mRNA from NMD, resulting in a threefold increase as analysed by qRT–PCR. Starting quantity values were normalized against GAPDH and expressed in fold change. ***P = 0.0008 (Mann–Whitney test). Error bars indicate s.d. N = 6. (D) FTSJ1 targets human tRNAPhe(GAA) at position 32. Related to Fig 1B. RiboMethSeq analysis of tRNAPhe(GAA) modification at positions Cm32 and Gm34 alkaline fragmentation–based RiboMethSeq was performed on total RNAs extracted from indicated LCL hemizygous mutants for FTSJ1 (LCL11 and LCLMM) and control FTSJ1 (non-mutated: LCL16) as indicated. For better visualization, raw read counts are presented in a non-normalized fashion (5′/3′-counts, raw count profile). The positions of interest (Cm32) in tRNAPhe(GAA) are indicated by a black line crossing the three graphs.
Figure 1.
Figure 1.. FTSJ1 targets multiple tRNAs at positions 32 and 34 in humans.
Methylation scores (MethScore) for 2′-O-methylated positions in tRNAs showing altered methylation in FTSJ1 loss of function mutant LCLs. MethScore (Score C), representing the level of ribose methylation, was calculated from protection profiles. Data are shown for positions 32 and 34 in different H. sapiens tRNAs as measured in different LCL lines that are indicated with a different colour code. Grey: control LCL; blue: FTSJ1 mutant LCLs. Met(CAU)-Cm34 is not deposited by FTSJ1 and shown here as a control (unaltered methylation in FTSJ1 mutants).
Figure S2.
Figure S2.
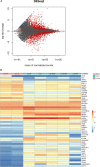
(A) FTSJ1 loss of function leads to mRNA deregulation in XLID affected individuals’ LCLs. MA plot on data from sequencing of mRNAs showing multiple deregulated mRNAs. (B) FTSJ1 loss of function leads to mRNA deregulation in XLID affected individuals’ LCLs. Heat map showing the top 50 deregulated mRNAs in P-values, and sorted fold change from most down-regulated to most up-regulated is represented in FTSJ1 loss of function LCLs compared with controls LCLs. Condition points to the FTSJ1 LCL status, WT (control) or mutated for the FTSJ1 gene (FTSJ1). The data come from normalized and variance-stabilizing transformed read counts using the DESeq2 package in R. Names of the LCLs are indicated in Condition lane.
Figure 2.
Figure 2.. FTSJ1 loss of function leads to mRNA deregulation in XLID affected individuals’ LCLs.
(A) FTSJ1 loss of function mRNA GO term. GO analysis of the 686 deregulated genes in FTSJ1 function–deficient LCLs derived from XLID affected individuals (five mutants versus two control LCLs); P-values are indicated with error bars on the right of each box. The most enriched GO term is brain morphogenesis. GO analysis was performed using http://geneontology.org/. (B) qRT–PCR analysis confirms deregulation in ZNF711, BTBD3, and SPARC mRNA expression levels. Normalized to GAPDH steady-state levels. n > 3. P-values were calculated with a paired t test: **P < 0.01 and ***P < 0.001. WT values: mean of two control FTSJ1 LCLs. Mutant values: mean of all (×5) FTSJ1 mutant LCLs of this study, or two (LCL MM and LCL 65JW) for ZNF711 qRT-PCR.
Figure S3.
Figure S3.
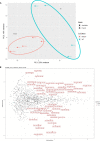
(A) FTSJ1 loss of function leads to miRNA deregulation in XLID affected individuals’ cells. The principal component analysis plot shows a well-defined cluster of all LCL lines lacking FTSJ1 function that is separated from the more dispersed cluster of control lines (LCL WT for FTSJ1: WT; LCL mutant for FTSJ1: mutant). (B) FTSJ1 loss of function leads to miRNA deregulation in XLID affected individuals’ LCLs. MA plot on data from sequencing of miRNAs showing multiple deregulated miRNAs (LCL WT for FTSJ1: WT; LCL mutant for FTSJ1: mutant).
Figure 3.
Figure 3.. FTSJ1 loss of function leads to miRNA deregulation in XLID affected individuals’ LCLs.
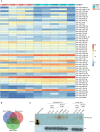
(A) Heat map generated using the pheatmap package in R showing the 50 best deregulated miRNAs in P-values, and sorted fold change from most down-regulated (blue) to most up-regulated (red) is represented in two experimental conditions: FTSJ1 loss of function LCLs (blue turquoise) compared with controls LCLs (pink). Condition points to the FTSJ1 LCL status, WT (control) or mutated for the FTSJ1 gene (FTSJ1). The data come from normalized and variance-stabilizing transformed read counts using the DESeq2 package in R. (B) Bibliographic search (Table 4) of the miRNAs deregulated in FTSJ1 loss of function LCLs reveals evidence for many of them as being implicated in cancers or brain development and brain diseases. The number of miRNAs related to brain, cancer, and brain–cancer specifically is indicated respectively in the blue, green, and red circles. The Venn diagram was generated by http://bioinformatics.psb.ugent.be/webtools/Venn/. (C) Northern blot analysis with 32P-labelled probe specific for hsa-miR-181a-5p confirms the up-regulation of this miRNA in FTSJ1 loss of function condition already detected by small RNA-seq analysis. A 32P-labelled probe specific for human U6 RNA was used to assess equal loading on the blot.
Figure S4.
Figure S4.
(A) BTBD3 and miR-181a-5p are expressed in HeLa cells similar to LCLs. qRT–PCR analysis confirms expression of BTBD3 (left panel) and hsa-miR-181a-5p (right panel) in WT and FTSJ1 KO HeLa cells. Similar to what is observed in patient cells, both BTBD3 and hsa-miR-181a-5p are up-regulated in FTSJ1 KO cells. BTBD3 levels were normalized to GAPDH steady-state levels, and miR-181-a-5p levels were normalized to the small spike-in RNA UniSp6. Error bars represent the SD between three and six independent biological samples, respectively. BTBD3, ***P = 4.17 × 10⁻⁴; miR-181a-5p, ***P = 1.31 × 10⁻⁴ (paired t test). (B) miR-181a-5p targets BTBD3 in HeLa cells. Left panel: miR-181a-5p complementation in HeLa cells results in down-regulation of BTBD3 mRNA when compared to an untransfected control, as shown by relative quantification by qRT–PCR (***P = 8.55 × 10⁻⁵). Inhibition of miR-181a-5p in HeLa cells results in up-regulation of BTBD3 mRNA (***P = 1.61 × 10⁻⁴). BTBD3 levels were normalized to GAPDH. P-values are calculated with a t test on four independent biological samples. Right panel: miR-181a-5p up-regulation and down-regulation are verified by qRT–PCR to assess transfection efficiency. miR-181-a-5p levels were normalized to the small spike-in RNA UniSp6. Indicated P-values were calculated with a paired t test (untransfected control/mimic miR-181a-5p, ***P = 2.88 × 10⁻⁴; untransfected control/inhib. miR-181a-5p, ***P = 6.37 × 10⁻⁴).
Figure 4.
Figure 4.. FTSJ1 depletion affects human neurons’ spine morphology.
(A) DAP-induced FTSJ1 inhibition does not affect human NPC to immature neuron differentiation. Immunostainings for DCX and SOX2 were performed on human iPSC-derived NPCs treated with either 100 μM DAP or equal volume of H2O for 24 h. Cells were numbered on microscopy acquisitions, and the ratio of DCX-expressing cells over total cell number was calculated and expressed in fold change. Error bars represent SD of three independent experiments; n.s., not significant (over 1,400 cells numbered for a single experiment). (B) Lower panel: human NPCs inhibited for FTSJ1 with 100 μM DAP for 24 h (DAP 100 μM) present an increased number of neurite spines during NPC to immature neuron differentiation. DCX protein expressed in immature neurons is marked in green (DCX). Dashed white line represents the zoom-in zone depicted in the top right corner with a continuous white line. White stars (*) in the magnified inset point to the fine spine neurites. Upper panel: untreated NPCs (control). Nuclear staining was performed using DAPI depicted in blue (DAPI). (C) Quantification of thin spines of DCX-positive cells ((B) above). Thin projections were numbered and normalized over the total length of the immature neurons as traced and measured by Simple Neurite Tracer (Fiji plugin). Quantifications were carried out on five acquisitions for each experiment (control and DAP 100 μM) (>40 branches/acquisition on average). White scale bar: 30 μm. Aggregate of three independent experiments. Wilcoxon–Mann–Whitney’s test, **P = 0.0098.
Figure 5.
Figure 5.. FTSJ1-dependent Nm regulates axonal morphology in the Drosophila nervous system.
Left panel: representative confocal images of muscle-6/7 NMJ synapses of larval abdominal hemisegments A2–A3 for the indicated genotypes labelled with anti-synaptotagmin (green) and HRP (red) to reveal the synaptic vesicles and the neuronal membrane. White scale bar: 20 μm. Right panel: quantification of normalized bouton number (total number of boutons/muscle surface area [μm2 × 1,000]) (top), normalized axon length (middle), and normalized branching (bottom) of NMJ 6/7 in A2–A3 of the indicated genotypes. Bars show the mean ± SEM. Multiple comparisons were performed using one-way ANOVA with a post hoc Sidak–Bonferroni correction (n.s., not significant; *P < 0.05; ***P < 0.001; and ****P < 0.0001). Numbers of replicated neurons (n) are as follows: 74 for WT; 36 for Trm7_32; 29 for Trm7_34; 48 for Trm7_32; Trm7_34; and 34 for WT untreated and 45 for WT treated with DAP. Canton-S larvae were used as WT control.
Figure 6.
Figure 6.. Drosophila FTSJ1 ortholog Trm7_34 mutants are defective for appetitive long-term memory.
Behavioural performances are reported as the mean±SEM. Statistical significance was tested with a one-way ANOVA followed by Tukey’s post hoc pairwise comparisons. Asterisks on the barplots indicate the level of significance of the pairwise comparison with control. The P-value indicated in the legend corresponds to the output of the ANOVA. (A) Flies were starved on mineral water for 21 h and then trained with an appetitive associative olfactory learning protocol (odour paired with sucrose ingestion). Short-term memory performance was measured 1 h after learning. The short-term memory score of single Trm7_32 (+/Trm7_32) and Trm7_34 (+/Trm7_34), and double Trm7_32; Trm7_34 (Trm7_32; Trm7_34) heterozygous mutant flies was not different from their genotypic controls (+/w1118) (n = 12 per condition; P = 0.99). (B) Flies were starved on mineral water for 21 h and then trained with an appetitive associative olfactory learning protocol (odour paired with sucrose ingestion). Long-term memory performance was measured 24 h after learning. The long-term memory score of single Trm7_32 (+/Trm7_32) and Trm7_34 (+/Trm7_34), and double Trm7_32; Trm7_34 (Trm7_32; Trm7_34) heterozygous mutant flies was severely impaired as compared to their genotypic controls (+/w1118) (n = 16–19 per condition; P = 0.0007). (C) Flies were starved on mineral water for 21 h, and their attraction to sucrose was then measured. The innate sucrose preference of single Trm7_32 (+/Trm7_32) and Trm7_34 (+/Trm7_34), and double Trm7_32; Trm7_34 (Trm7_32; Trm7_34) heterozygous mutant flies was not different from their genotypic controls (+/w1118) (n = 14 per condition; P = 0.99). (D) Flies were starved on mineral water for 21 h, and their avoidance to the odorants used in the olfactory memory assays, 3-octanol (OCT) and 4-methylcyclohexanol (MCH), was then measured. The innate odour avoidance of single Trm7_32 (+/Trm7_32) and Trm7_34 (+/Trm7_34), and double Trm7_32; Trm7_34 (Trm7_32; Trm7_34) heterozygous mutant flies was not different from their genotypic controls (+/w1118) (n = 10 per condition; OCT: P = 0.26; MCH: P = 0.28).

Similar articles

Cited by

References

    1. Abe M, Naqvi A, Hendriks G-J, Feltzin V, Zhu Y, Grigoriev A, Bonini NM (2014) Impact of age-associated increase in 2′-O-methylation of miRNAs on aging and neurodegeneration in Drosophila. Genes Dev 28: 44–57. 10.1101/gad.226654.113 - DOI - PMC - PubMed
    1. Angelova MT, Dimitrova DG, Dinges N, Lence T, Worpenberg L, Carré C, Roignant J-Y (2018) The emerging field of epitranscriptomics in neurodevelopmental and neuronal disorders. Front Bioeng Biotechnol 6: 46. 10.3389/fbioe.2018.00046 - DOI - PMC - PubMed
    1. Angelova MT, Dimitrova DG, Da Silva B, Marchand V, Jacquier C, Achour C, Brazane M, Goyenvalle C, Bourguignon-Igel V, Shehzada S, et al. (2020) tRNA 2’-O-methylation by a duo of TRM7/FTSJ1 proteins modulates small RNA silencing in Drosophila. Nucleic Acids Res 48: 2050–2072. 10.1093/nar/gkaa002 - DOI - PMC - PubMed
    1. Anreiter I, Mir Q, Simpson JT, Janga SC, Soller M (2021) New twists in detecting mRNA modification dynamics. Trends Biotechnol 39: 72–89. 10.1016/j.tibtech.2020.06.002 - DOI - PMC - PubMed
    1. Bartoli KM, Schaening C, Carlile TM, Gilbert WV (2018) Conserved methyltransferase Spb1 targets mRNAs for regulated modification with 2′-O-methyl ribose. BioRxiv. 10.1101/271916 (Preprint posted March 8, 2018). - DOI

Publication types